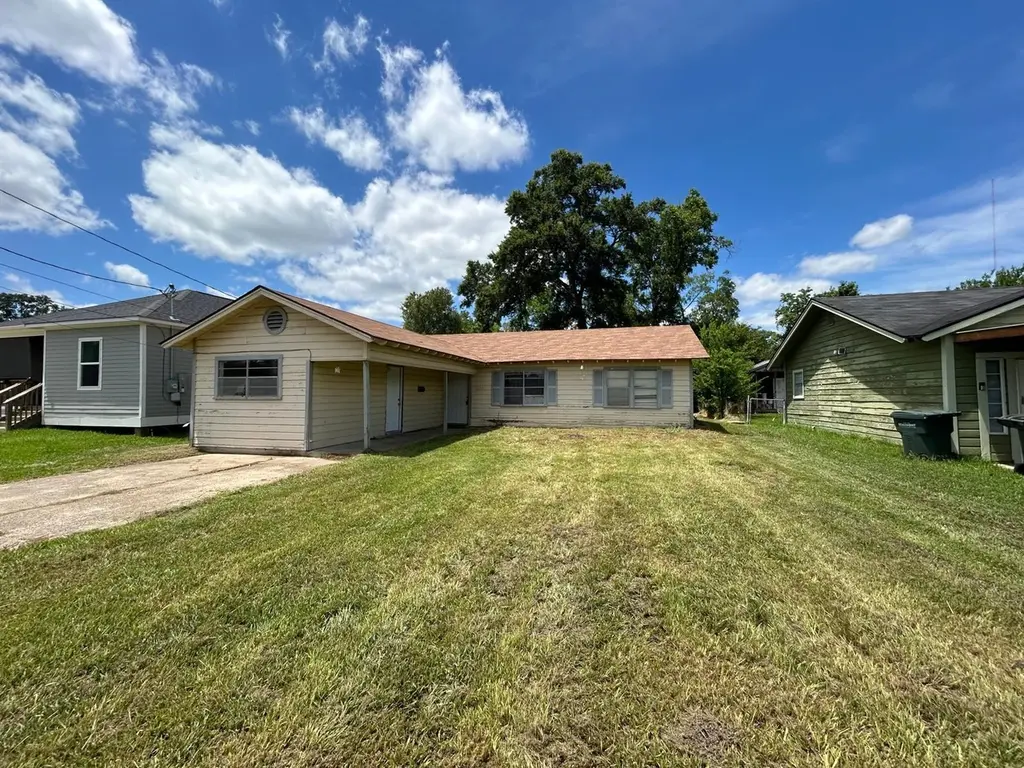
3107 Corley · Beaumont, TX
Flood risk 9/10 · Severe
- FEMA flood zone
- X
- Chance of flooding over 30 yrs
- 0.99%
- Est. flood insurance / yr
- $507 – $1,088
Fire risk 1/10 · Minimal
- Est. fire insurance / yr
- $1,222 – $2,270
Heat risk 9/10 · Severe
- Hot days now (above 109°F)
- 7 days/yr
- Hot days in 30 yrs
- 22 days/yr
Wind risk 9/10 · Severe
- Chance of severe wind over 30 yrs
- 99.0%
Air-quality risk 2/10 · Minimal
- Unhealthy air days now
- 1 days/yr
- Unhealthy air days in 30 yrs
- 1 days/yr
Risk factors via First Street. Map © Google.
Why this score? — see what drove the B+ grade
The composite is a weighted blend of 9 inputs, each scored 0–100. Each bar is that input's sub-score; the figure is the points it added to the 100-point composite (weight × sub-score).
- Cash flow +30.0/30.0
- 1% rule +10.0/10.0
- DSCR +10.0/10.0
- Appreciation +8.1/10.0
- ARV discount +7.5/15.0
- Livability +3.2/5.0
- Rent growth +2.5/5.0
- Condition / age +2.2/5.0
- Schools +1.5/10.0
$59,900
🖨 Deal sheet (PDF) 📄 Offer letter ✓ Due diligence
Listing remarks
WHAT A DEAL!! . .. GREAT LOT with HOME! It needs little TLC to make it YOUR very own but OH WHAT A BARGAIN DEAL!! Priced to MOVE!! Located in EXCELLENT location in seasoned subdivision of "Cartwright & Roberts " in Beaumont ONLY Minutes away from I-10. Close to Schools, shopping, and entertainment PERFECT FIT for those who want to buy SUPER affordable with built in sweat equity. .. At this price this Ol GAL, with great bones will not last long. .. So HURRY! HURRY! Call us TODAY.
Key facts
- Close to schools
- Excellent location
- Close to shopping
Tags
Property features AI
Exterior
- Home design: Single-family residence (Residential property)
- Construction: Single Family construction
- Exterior features: Lot about 0.18 acres
Interior
- Bathrooms: 1 full bathroom
- Interior features: Located in the Cartwright subdivision
Neighborhood map
What this means for you Summary
Snapshot
- This is a 3-bed/1.0-bath single-family listed at $60k. Condition is rated fair.
Deal economics
- At list price, monthly cash flow is $648 ($8k/yr) — positive.
- The deal already cash-flows at list — no discount required.
- Meets the 1% rule at list price ($1k rent vs $60k).
- Recommended offer: $59k (1.5% below list) — sets the bar for market timing.
- Cap rate 20.6% vs local median 5.3% in Beaumont — top-decile yield for the area; either an underpriced asset or a hidden risk that comps aren't pricing in. Stress-test before assuming the spread holds.
Location & tenants
- Location reads 64/100 on livability (#739 in TX) — a middle-class / working-renter tenant base. Strengths: cost of living A+, housing A+, health & safety A+; Watch: employment D, crime F, amenities F.
- Beaumont ISD (urban): math 14% / reading 22% proficiency, ranked #789 of 826 in TX (top 96%) — low school quality limits family demand, transient renter base, plan for 1-2y turnover; 69% free/reduced lunch — lower-income household profile, screen leases tightly.
- Zoned schools: Fehl-Price El (math 2% / reading 12%, grade F, #4,307 of 4,322 statewide, top 100%, 453 students, 97% FRL, charter); Marshall Middle (math 17% / reading 25%, grade F, #1,387 of 1,662 statewide, top 85%, 711 students, 62% FRL); West Brook Sr H S (math 19% / reading 34%, grade F, #1,228 of 1,632 statewide, top 76%, 2,245 students, 58% FRL) — zoned schools at 72% FRL track the district average.
- Market conditions: 73 active listings in the ZIP; 8 comparable units currently listed for rent nearby; rentals lingering (median 45d on market — plan ~5-8 weeks vacancy on turnover, expect pricing pressure); 50% of comp listings sitting > 30 days — soft ceiling on asking rent; 343 units permitted in Jefferson County in 2024 (0 in 5+ unit buildings).
- This rent runs 35% of the median local income ($49k/yr) — at the standard rent-burdened threshold; future hikes will face affordability resistance.
Forward outlook
- In year one you build about $4k of equity ($414 loan paydown + $4k appreciation (6.2% local appreciation)).
- At projected returns (6.2% appreciation + 3.0% rent growth), your $17k cash investment doubles in ~2 years — after that, you're playing with house money.
- By year 8, paydown + projected appreciation supports a ~$32k cash-out refi (75% LTV) — recoverable capital for the next deal without selling this one.
Negotiation context
- It's been on market 23 days — a 2% lower offer ($59k) is reasonable based on typical stale-listing flexibility.
Risks & watch-outs
- Watch-outs: flood insurance adds $66/mo.
- Climate carrying-cost: severe flood risk; severe wind risk, 99% chance of damaging wind over 30y; extreme-heat days projected 7→22/yr by 2055 (HVAC capex compounding) — expect insurance premiums to compound above CPI over the hold.
Questions for the listing agent
- Have any recent inspections been done? Can we get a copy of the seller's disclosures and any deferred-maintenance estimates?
- What's the actual annual flood-insurance premium (NFIP or private), and is the property in a SFHA with mandatory coverage?
- Is there a deadline driving the sale (1031 exchange, divorce, estate, relocation)? That informs how much negotiation room exists.
- Schools are D-rated, which usually means shorter tenancies and higher turnover. Who's the typical renter profile here, and what's been the actual vacancy rate?
- Crime grade is F in this area — have there been break-ins, vandalism, or insurance claims at this property in the last 3 years? What carrier currently insures it and at what premium?
- What's the average days-on-market for RENTAL listings here right now (not sales)? A rising rental-DOM trend means longer vacancies and softer asking-rent achievability than the comps imply.
- What's the recent tenant-quality profile in this submarket — average credit score on applications, eviction rate, late-payment / NSF rate, and stable-employment percentage? A property-management company in the area should have these aggregated.
- How much new for-sale + rental construction is in the pipeline within 1–3 miles? Heavy new supply typically softens prices + rents 12–24 months out; constrained supply supports both.
Investment metrics
- 1% rule
- 2.38% ✓
- Cap rate
- 20.60%
- Cash-on-cash
- 51.09%
- DSCR
- 3.27
- GRM
- 3.5
CMA / ARV
- ARV (on-the-fly)
- $229,554
- Comps found
- 2
Show comp detail 2 sales within ~0.75 mi
| Address | Dist | Beds/Ba | Sqft | Sold | Price | $/sf | Match |
|---|---|---|---|---|---|---|---|
| 3123 Dorothy Ave | 0.45mi | 3/2.0 | 2,052 (+5%) | 11mo | $240,000 | $117 | 58 |
| 3415 Westmoreland St | 0.74mi | 3/3.0 | 1,798 (-8%) | 14mo | $127,900 | $71 | 32 |
Match score weights: distance 35% · size 25% · config 20% · recency 20%. Top-matched comps best support the ARV.
Projected returns pro-forma
6.25% appreciation · 3.0% rent growth · sell at horizon
- IRR
- 55.8%
- Equity multiple
- 4.55×
- Total profit
- $59,504
- Equity at exit
- $38,614
- IRR
- 52.5%
- Equity multiple
- 9.50×
- Total profit
- $142,630
- Equity at exit
- $70,866
Cash invested: $16,772 (down + closing). Projections, not guarantees.
Landlord ↔ Tenant lean methodology
- Overall (STATE)
- 87 Strongly Landlord-Friendly
- State Texas
- 87 Strongly Landlord-Friendly · R+5
- County
- — inherits STATE
- City
- — inherits STATE
ZIP-level market 77701
- Home prices YoY
- 3.8%
- Active inventory
- 73
- Price-to-rent
- 3.5×
Monthly cashflow live
- Estimated rent
- $1,428 high interval (Pro) →
- Mortgage (P&I)
- −$314
- Tax est. 1.5%
- −$75 /mo · $898/yr
- Insurance
- −$25
- Flood insurance flood zone
- −$66 /mo · $798/yr
- HOA
- −$0
- Vacancy / Maint / Mgmt
- −$300
- Net cashflow
- $648
Break-even live
Sensitivity live
| Price | -10% $689 | -5% $668 | +0% $648 | +5% $627 | +10% $606 |
|---|---|---|---|---|---|
| Rent | -10% $535 | -5% $591 | +0% $648 | +5% $704 | +10% $760 |
| Rate | -1.0pp $678 | -0.5pp $663 | base $648 | +0.5pp $632 | +1.0pp $616 |
UW: 25.0% down · 7.5% · 30yr · 1.5% tax · 5.0% vac · 8.0% maint · 8.0% mgmt
Financing live
Cash to close
- Down payment
- $14,975
- Closing costs
- $1,797
- Reserves months
- —
- Total cash needed
- —
Loan-product check · same deal, 3 products live
Conventional
25% down · 7.5% · 30yr
- Down + closing
- —
- Monthly P&I
- —
- Monthly cashflow
- —
- DSCR
- —
- Eligible?
- —
Personal DTI + credit; lowest rate.
DSCR
20% down · 8.5% · 30yr
- Down + closing
- —
- Monthly P&I
- —
- Monthly cashflow
- —
- DSCR
- —
- Eligible?
- —
No personal income docs; deal must DSCR.
Hard money
10% down · 12.0% · 12mo
- Down + closing
- —
- Monthly P&I
- —
- Monthly cashflow
- —
- DSCR
- —
- Eligible?
- —
Short-term bridge; refi at stabilization.
Rent comps 8 comps
| Address | Beds | Baths | Sqft | Rent | $/sqft | DOM | Units | Dist |
|---|---|---|---|---|---|---|---|---|
| 690 E Avenue Unit A Beaumont, TX | 3.0 | 1.0 | 1300 | $975 | $0.75 | 15d | 1 | 0.96mi |
| 4090 Lou St Beaumont, TX | 3.0 | 2.0 | 1281 | $1,675 | $1.31 | 45d | 1 | 1.19mi |
| 1107 Avenue A Beaumont, TX | 4.0 | 2.0 | 1584 | $1,395 | $0.88 | 45d | 1 | 1.26mi |
| 4455 S 5th St Beaumont, TX | 3.0 | 2.0 | 1437 | $1,500 | $1.04 | 15d | 1 | 1.26mi |
| 2350 Pecos St Unit A Beaumont, TX | 4.0 | 2.0 | 2200 | $1,805 | $0.82 | 25d | 1 | 1.39mi |
| 1211 Washington Blvd Beaumont, TX | 3.0 | 1.0 | 1363 | $1,200 | $0.88 | 45d | 1 | 1.44mi |
| 2532 South St Beaumont, TX | 3.0 | 2.0 | 2344 | $2,200 | $0.94 | 45d | 1 | 1.47mi |
| 1417 Church St Beaumont, TX | 2.0 | 1.0 | 1440 | $1,100 | $0.76 | 15d | 1 | 1.49mi |
Listing history 17 events
-
2026-06-21days on market $59,900 Active 23 DOM
-
2026-06-18days on market $59,900 Active 20 DOM
-
2026-06-17days on market $59,900 Active 19 DOM
-
2026-06-16days on market $59,900 Active 18 DOM
-
2026-06-15days on market $59,900 Active 17 DOM
-
2026-06-14days on market $59,900 Active 15 DOM
-
2026-06-13days on market $59,900 Active 14 DOM
-
2026-06-10days on market $59,900 Active 12 DOM
-
2026-06-09days on market $59,900 Active 11 DOM
-
2026-06-08days on market $59,900 Active 10 DOM
-
2026-06-07days on market $59,900 Active 9 DOM
-
2026-06-03days on market $59,900 Active 5 DOM
-
2026-06-02days on market $59,900 Active 4 DOM
-
2026-06-01days on market $59,900 Active 3 DOM
-
2026-05-31days on market $59,900 Active 2 DOM
-
2026-05-30remarks 488-char remark
-
2026-05-30$59,900 Active 1 DOM
ⓘ Source: listings_history table (triggers on properties + properties_extension) + one-shot
backfill from property_details.listing_events for pre-trigger history.
Climate risk First Street
- Flood 9/10 Extreme FEMA zone X · 99% chance over 30 yrs
- Wildfire 1/10 Low
- Heat 9/10 Extreme 7 d/yr ≥109°F today · 22 d/yr by 30 yrs out
- Wind 9/10 Extreme 99% chance of damaging wind over 30 yrs
- Air quality 2/10 Low 1 unhealthy d/yr today · 1 by 30 yrs out
Nearby sold comps map
Loading sold comps map…
Walkable amenities ~0.75 mi
Loading nearby amenities…
Taxation est. · year 1
- Rental income
- $17,135
- − Mortgage interest
- −$3,355
- − Property taxes
- −$898
- − Insurance
- −$1,097
- − Repairs & maintenance
- −$1,371
- − Management
- −$1,371
- − Depreciation
- −$1,743
- Taxable income
- $7,300
- Est. tax owed @ 24.0%
- −$1,752
- After-tax cash flow
- $6,019/yr
For passive investors: Depreciation is non-cash, so a rental often shows a tax loss while cash-flowing — sheltering income. Rental losses are passive: they offset passive income freely, and up to $25,000/yr can offset ordinary (W-2) income if you actively participate and your MAGI is under $100k (phasing out to $0 by $150k); unused losses carry forward. On sale, claimed depreciation is recaptured at up to 25%, and gains may owe capital-gains tax (a 1031 exchange can defer both). Figures are a year-1 estimate at your 24.0% rate — not tax advice; consult a CPA.
Condition & rehab AI · 12 photos
This property requires moderate renovations to bring it up to a fair condition. Key updates include painting, replacing cabinets and fixtures, and installing flooring. The home is located in a desirable area, making it a good investment opportunity.
Repairs flagged
- Major Exposed concrete floors — Structural damage
- Major Missing cabinets and fixtures — Aesthetic and functional issues
- Major Paint peeling — Safety hazard and aesthetic issue
Value-add opportunities
- Both Paint — Enhances curb appeal and interior aesthetics
- Both Cabinets and fixtures — Improves functionality and aesthetics
- Both Flooring — Provides a finished look and improves comfort
Renovation cost estimate screening
| Repair item | Severity | Est. cost |
|---|---|---|
| Exposed concrete floors · Structural damage | Major | $15,000–50,000 |
| Missing cabinets and fixtures · Aesthetic and functional issues | Major | $15,000–50,000 |
| Paint peeling · Safety hazard and aesthetic issue | Major | $15,000–50,000 |
| Total estimated repair cost · 3 items | $45,000–150,000 |
Value-add ROI direction
- Both Paint — Enhances curb appeal and interior aesthetics ↑
- Both Cabinets and fixtures — Improves functionality and aesthetics ↑
- Both Flooring — Provides a finished look and improves comfort ↑
ⓘ Cost ranges are severity-bucket heuristics (US national rule-of-thumb). Get contractor quotes + a written scope before underwriting a rehab budget.
Schools (NCES district)
- District
- Beaumont ISD
- NCES district ID
- 4809670
- Math proficiency
- 14% ▼ -13.00%
- Reading proficiency
- 22% ▼ -7.00%
- Median HH income
- $41,683
- Composite
- 15.43/100
- National rank
- #9316
- State rank
- #789 of 826 in TX
Livability — Beaumont
- Score
- 64/100
- State rank
- #739
- US rank
- #13710
Category grades
Schools grade is shown separately in the Schools card above.
Census & demographics
- Census place
- Beaumont, TX
- County
- Jefferson County · 203,592 people
- City population
- 125,901
- Metro
- Beaumont-Port Arthur, TX
- Population (ZIP)
- 12,381
- Household income
- $49,181
- Rent vs Own
- Severe rent burden
- 516.0
Population outlook (Jefferson County) Hauer SSP2
- Today (2025)
- 259,015 people
- By 2030
- 260,685 · +0.6%
- By 2040
- 263,309 · +1.7%
- By 2050
- 265,237 · +2.4%
- By 2075
- 270,193 · +4.3%
- By 2100
- 255,628 · -1.3%
Race, ethnicity, and origin ACS 2023
- Neighborhood character
- Diverse neighborhood (Simpson 0.60)
- Race & ethnicity
- Hispanic / Latino 44% Black 44% Two or more races 21% White 8% Asian 3%
- Hispanic origin (detail)
- Mexican 38%
- Common ancestry
- Lithuanian 1%
- Foreign-born
- 21% · Canada, Vietnam
- Languages at home
- 56% English-only · Spanish 40% Vietnamese 3%
Political lean MEDSL · Jefferson
- 2024 margin
- Lean R (+8.9) · D 45.1% · R 54.0%
- 2008→2024 swing
- -11.1pp toward R · 2008: 2.2pp · 2024: -8.9pp
- All cycles
- 2024: R+8.9 2020: R+1.6 2016: R+0.5 2012: D+1.6 2008: D+2.2
Not yet ingested
- Civics
- —
Market trends
- HPI YoY
- ▲ 6.25%
- Current HPI
- 170.1843
- Rent YoY
- —
- Metro
- Beaumont-Port Arthur, TX
- State GDP YoY
- ▲ 3.95%
- F500 in state
- 110
Industry mix (Fortune 500 HQ in TX)
| Industry | F500 HQs | Revenue |
|---|---|---|
| Energy | 16 | $1,198B |
|
||
| Technology | 5 | $198B |
|
||
| Engineering / Construction | 4 | $72B |
|
||
| Energy Services | 3 | $60B |
|
||
| Utilities | 3 | $41B |
|
||
| Healthcare | 2 | $330B |
|
||
Price history
1 event — show timeline
- 2026-05-29 Listed $59,900 BBOR
Cash-flow waterfall
monthlySold comps — $/sqft
last 12 mo · ≤1 miLoading sold comps…