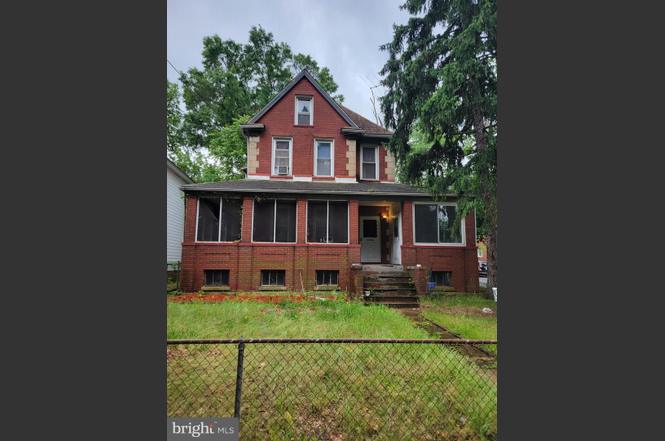
4415 Ord St NE · Washington, DC
Flood risk 1/10 · Minimal
- FEMA flood zone
- X (unshaded)
- Chance of flooding over 30 yrs
- 0.0%
- Est. flood insurance / yr
- $473 – $860
Fire risk 1/10 · Minimal
- Est. fire insurance / yr
- $631 – $1,173
Heat risk 7/10 · Major
- Hot days now (above 105°F)
- 7 days/yr
- Hot days in 30 yrs
- 15 days/yr
Wind risk 4/10 · Minor
- Chance of severe wind over 30 yrs
- 20.0%
Air-quality risk 4/10 · Minor
- Unhealthy air days now
- 4 days/yr
- Unhealthy air days in 30 yrs
- 5 days/yr
Risk factors via First Street. Map © Google.
Why this score? — see what drove the C grade
The composite is a weighted blend of 9 inputs, each scored 0–100. Each bar is that input's sub-score; the figure is the points it added to the 100-point composite (weight × sub-score).
- Cash flow +19.0/30.0
- ARV discount +15.0/15.0
- DSCR +6.0/10.0
- 1% rule +4.5/10.0
- Rent growth +4.0/5.0
- Livability +3.7/5.0
- Schools +3.6/10.0
- Condition / age +2.5/5.0
- Appreciation +0.0/10.0
$314,999
🖨 Deal sheet (PDF) 📄 Offer letter ✓ Due diligence
Listing remarks
Coming Soon!!!!! Do not miss an opportunity to get your piece of DC. Oozing with equity and potential bring your imagination and an offer. Cash, Private Funds, or 203K's. Serious inquiries only. Seller Preferred Title Company - KTL Title.
Key facts
- 6,000 sq ft lot
- Garage
- Built 1912
Property features AI
Exterior
- Parking: Detached front-entry garage (1 space); On-street parking
- Security: Secure storage
- Utilities: Public water; Public sewer; Electric available; Natural gas available
- Home design: Detached property; Corner lot; Front yard, rear yard and side yards; Level and cleared lot
- Construction: Brick construction; Architectural shingle roof; Concrete perimeter foundation; Double-hung windows with screens
- Exterior features: Exterior lighting; Gutter system; Sidewalks; Secure storage; Street lighting; Deck(s); Porch(es) including an enclosed/screened porch; Shed
Interior
- Kitchen: Refrigerator; Built-in microwave; Dishwasher; Garbage disposal; Gas oven/range; Stainless steel appliances
- Bedrooms: Three bedrooms on the upper level; Master bedroom
- Flooring: Hardwood; Carpet; Ceramic tile
- Bathrooms: Two full bathrooms
- Heating & cooling: 90% efficient forced air heating (natural gas); Central air conditioning (electric); Natural gas hot water
- Interior features: Tub and stall showers; Storm door(s); Drywall and high ceilings; Fully finished basement with windows, interior access, walkout stairs and outside entrance; Screened porch
- Laundry & utility: Utility room
Neighborhood map
What this means for you Summary
Snapshot
- This is a 3-bed/1.5-bath single-family listed at $315k.
Deal economics
- At list price, monthly cash flow is $328 ($4k/yr) — positive.
- The deal already cash-flows at list — no discount required.
- To meet the 1% rule (rent ≥ 1% of price), the offer needs to be $299k (5.1% below list).
- Recommended offer: $299k (5.1% below list) — sets the bar for 1% rule.
- Cap rate 7.5% vs local median 2.5% in Washington — top-decile yield for the area; either an underpriced asset or a hidden risk that comps aren't pricing in. Stress-test before assuming the spread holds.
Location & tenants
- Location reads 73/100 on livability (#1 in DC) — a middle-class / working-renter tenant base. Strengths: amenities A+, commute A+, employment A+; Watch: crime F, cost of living F.
- District Of Columbia Public Schools (urban): math 33% / reading 40% proficiency, ranked #8 of 32 in DC (top 25%) — families likely to look elsewhere, expect single-tenant / working-renter base with shorter leases; 65% free/reduced lunch — lower-income household profile, screen leases tightly.
- Market conditions: Rents rising fast (+6.1%/yr); 276 active listings in the ZIP; 22 comparable units currently listed for rent nearby; rentals at typical pace (median 25d on market — plan ~3-4 weeks tenant-placement turnaround); 1,737 units permitted in District of Columbia in 2024 (1,506 in 5+ unit buildings).
- At $2,989/mo this rent would consume 62% of the median local household income ($58k/yr) (locally 5115% of renters already pay >50% of income on rent) — very limited rent-growth headroom before tenants either downsize or default.
Forward outlook
- Local home prices are declining (-3.0%/yr); year-one equity from $2k of loan paydown is wiped out by about $9k of value loss. Plan a longer hold.
- District of Columbia County population projected at +50% by 2050 — long-run rental-demand tailwind backs the buy-and-hold thesis.
Negotiation context
- Only 2 days on market — expect competitive offers; lowballing is unlikely to land.
Risks & watch-outs
- Watch-outs: built in 1912 — expect roof / HVAC / electrical / plumbing capex.
- Climate carrying-cost: extreme-heat days projected 7→15/yr by 2055 (HVAC capex compounding) — expect insurance premiums to compound above CPI over the hold.
Questions for the listing agent
- Built in 1912 — when were the roof, HVAC, electrical panel, plumbing, and water heater last replaced?
- Is there a deadline driving the sale (1031 exchange, divorce, estate, relocation)? That informs how much negotiation room exists.
- Crime grade is F in this area — have there been break-ins, vandalism, or insurance claims at this property in the last 3 years? What carrier currently insures it and at what premium?
- What's the average days-on-market for RENTAL listings here right now (not sales)? A rising rental-DOM trend means longer vacancies and softer asking-rent achievability than the comps imply.
- What's the recent tenant-quality profile in this submarket — average credit score on applications, eviction rate, late-payment / NSF rate, and stable-employment percentage? A property-management company in the area should have these aggregated.
- How much new for-sale + rental construction is in the pipeline within 1–3 miles? Heavy new supply typically softens prices + rents 12–24 months out; constrained supply supports both.
Investment metrics
- 1% rule
- 0.95% ✗
- Cap rate
- 7.54%
- Cash-on-cash
- 4.46%
- DSCR
- 1.20
- GRM
- 8.8
CMA / ARV
- ARV (on-the-fly)
- $469,750
- Comps found
- 12
Show comp detail 12 sales within ~0.75 mi
| Address | Dist | Beds/Ba | Sqft | Sold | Price | $/sf | Match |
|---|---|---|---|---|---|---|---|
| 4308 Nannie Helen Burroughs Ave NE | 0.51mi | 4/3.0 (+1) | 1,882 (+0%) | 1mo | $475,000 | $252 | 64 |
| 4519 Douglas St NE | 0.13mi | 4/3.0 (+1) | 2,070 (+10%) | 6mo | $550,000 | $266 | 61 |
| 4229 Lane Pl NE | 0.32mi | 3/2.0 | 1,646 (-12%) | 5mo | $449,500 | $273 | 58 |
| 4601 Jay St NE | 0.50mi | 3/1.5 | 2,100 (+12%) | 3mo | $345,000 | $164 | 54 |
| 1015 48th St NE | 0.44mi | 3/2.5 | 1,656 (-12%) | 3mo | $495,000 | $299 | 54 |
| 1308 Cougar Ln | 0.58mi | 4/2.5 (+1) | 1,920 (+2%) | 8mo | $625,000 | $326 | 53 |
| 4029 Gault Pl NE | 0.72mi | 4/2.0 (+1) | 1,802 (-4%) | 2mo | $415,000 | $230 | 51 |
| 921 48th St NE | 0.51mi | 4/1.5 (+1) | 1,672 (-11%) | 3mo | $355,000 | $212 | 51 |
| 4227 Gault Pl NE | 0.66mi | 3/2.0 | 2,040 (+9%) | 3mo | $315,000 | $154 | 50 |
| 4225 Gault Pl NE | 0.66mi | 3/2.5 | 2,040 (+9%) | 4mo | $250,000 | $123 | 48 |
| 4839 Jay St NE | 0.60mi | 3/1.5 | 1,602 (-15%) | 9mo | $399,999 | $250 | 40 |
| 5030 Lee St NE | 0.70mi | 4/2.5 (+1) | 2,064 (+10%) | 7mo | $440,000 | $213 | 36 |
Match score weights: distance 35% · size 25% · config 20% · recency 20%. Top-matched comps best support the ARV.
Projected returns pro-forma
-3.0% appreciation · 6.06% rent growth · sell at horizon
- IRR
- -6.1%
- Equity multiple
- 0.77×
- Total profit
- $-20,714
- Equity at exit
- $46,967
- IRR
- 6.7%
- Equity multiple
- 1.57×
- Total profit
- $50,125
- Equity at exit
- $27,235
Cash invested: $88,200 (down + closing). Projections, not guarantees.
Landlord ↔ Tenant lean methodology
- Overall (CITY)
- 0 Strongly Tenant-Friendly
- State District of Columbia
- 12 Strongly Tenant-Friendly · D+43
- County
- — inherits STATE
- City Washington
- 0 Strongly Tenant-Friendly · D+43
ZIP-level market 20019
- Rents YoY
- 6.1%
- Active inventory
- 276
- Price-to-rent
- 8.8×
Monthly cashflow live
- Estimated rent
- $2,989 high interval (Pro) →
- Mortgage (P&I)
- −$1,652
- Tax from tax record
- −$250 /mo · $2,998/yr
- Insurance
- −$131
- HOA
- −$0
- Vacancy / Maint / Mgmt
- −$628
- Net cashflow
- $328
Break-even live
Sensitivity live
| Price | -10% $506 | -5% $417 | +0% $328 | +5% $239 | +10% $150 |
|---|---|---|---|---|---|
| Rent | -10% $92 | -5% $210 | +0% $328 | +5% $446 | +10% $564 |
| Rate | -1.0pp $487 | -0.5pp $408 | base $328 | +0.5pp $246 | +1.0pp $163 |
UW: 25.0% down · 7.5% · 30yr · 1.5% tax · 5.0% vac · 8.0% maint · 8.0% mgmt
Financing live
Cash to close
- Down payment
- $78,750
- Closing costs
- $9,450
- Reserves months
- —
- Total cash needed
- —
Loan-product check · same deal, 3 products live
Conventional
25% down · 7.5% · 30yr
- Down + closing
- —
- Monthly P&I
- —
- Monthly cashflow
- —
- DSCR
- —
- Eligible?
- —
Personal DTI + credit; lowest rate.
DSCR
20% down · 8.5% · 30yr
- Down + closing
- —
- Monthly P&I
- —
- Monthly cashflow
- —
- DSCR
- —
- Eligible?
- —
No personal income docs; deal must DSCR.
Hard money
10% down · 12.0% · 12mo
- Down + closing
- —
- Monthly P&I
- —
- Monthly cashflow
- —
- DSCR
- —
- Eligible?
- —
Short-term bridge; refi at stabilization.
Rent comps 22 comps
| Address | Beds | Baths | Sqft | Rent | $/sqft | DOM | Units | Dist |
|---|---|---|---|---|---|---|---|---|
| 1009 46th St NE Unit 2 Washington, DC | 2.0 | 1.0 | 1512 | $2,250 | $1.49 | 8d | 1 | 0.35mi |
| 1009 46th St NE Unit 1 Washington, DC | 2.0 | 1.0 | 1512 | $1,900 | $1.26 | 11d | 1 | 0.35mi |
| 1316 Eastern Ave NE Washington, DC | 4.0 | 2.0 | 1548 | $3,200 | $2.07 | 24d | 1 | 0.52mi |
| 4950 Just St NE Washington, DC | 3.0 | 2.0 | 1437 | $4,000 | $2.78 | 24d | 1 | 0.58mi |
| 721 Parkside Pl NE Washington, DC | 4.0 | 3.5 | 2100 | $5,500 | $2.62 | 24d | 1 | 0.74mi |
| 4802 Leroy Gorham Dr Capitol Heights, MD | 4.0 | 3.5 | 1482 | $3,500 | $2.36 | 3d | 1 | 0.82mi |
| 4802 Leroy Gorham Dr Capitol Heights, MD | 4.0 | 3.5 | 2000 | $3,250 | $1.62 | 18d | 1 | 0.82mi |
| 621 Parkside Pl NE Washington, DC | 4.0 | 4.5 | 1818 | $4,000 | $2.20 | 24d | 1 | 0.85mi |
| 4800 Addison Rd Capitol Heights, MD | 1.0–3.0 | 1.0–3.0 | 998 | $2,737 | $2.74 | 2d | 40 | 0.86mi |
| 4523 Dix St NE Washington, DC | 3.0 | 3.0 | 1292 | $3,000 | $2.32 | 8d | 1 | 0.95mi |
| 4253 Brooks St NE Unit 1 Washington, DC | 2.0 | 1.0 | 2447 | $2,300 | $0.94 | 24d | 1 | 1.01mi |
| 5501 Jay St NE Washington, DC | 4.0 | 3.0 | 1848 | $3,300 | $1.79 | 24d | 1 | 1.11mi |
| 4011 Blaine St NE Washington, DC | 3.0 | 1.0 | 1632 | $2,500 | $1.53 | 24d | 1 | 1.20mi |
| 809 Eastern Ave Fairmount Heights, MD | 3.0 | 2.0 | 1246 | $2,400 | $1.93 | 5d | 1 | 1.21mi |
| 5032 E Capitol St NE Washington, DC | 2.0 | 3.5 | 1775 | $2,950 | $1.66 | 13d | 1 | 1.36mi |
| 3634 Commodore Joshua Barney Dr NE Washington, DC | 4.0 | 4.5 | 2100 | $4,100 | $1.95 | 24d | 1 | 1.36mi |
| 3423 Baker St NE Washington, DC | 2.0 | 1.5 | 1300 | $2,100 | $1.62 | 24d | 1 | 1.43mi |
| 5347 Ames St NE Washington, DC | 3.0 | 2.0 | 1428 | $3,000 | $2.10 | 24d | 1 | 1.44mi |
| 3351 Clay St NE Washington, DC | 2.0 | 1.5 | 1312 | $2,500 | $1.91 | 24d | 1 | 1.45mi |
| 1105 61st Ave Fairmount Heights, MD | 4.0 | 3.5 | 1352 | $2,500 | $1.85 | 18d | 1 | 1.46mi |
| 5074 Central Ave SE Washington, DC | 4.0 | 2.0 | 1349 | $5,200 | $3.85 | 22d | 1 | 1.48mi |
| 5704 Euclid St Cheverly, MD | 4.0 | 2.0 | 1260 | $2,300 | $1.83 | 13d | 1 | 1.50mi |
Listing history 3 events
-
2026-06-18days on market $314,999 Coming Soon 2 DOM
-
2026-06-17remarks 239-char remark
-
2026-06-17$314,999 Coming Soon 1 DOM
ⓘ Source: listings_history table (triggers on properties + properties_extension) + one-shot
backfill from property_details.listing_events for pre-trigger history.
Tax reassessment forecast DC · Partial reset (capped growth)
- Current annual tax
- $2,998 · $250/mo
- Projected year-2 tax
- $2,998 · $250/mo
- Expected delta
- $0/yr ($0/mo · 0.0%)
ⓘ Screening estimate from a state-policy table — verify with the county assessor before closing.
Climate risk First Street
- Flood 1/10 Low FEMA zone X (unshaded) · 0% chance over 30 yrs
- Wildfire 1/10 Low
- Heat 7/10 Severe 7 d/yr ≥105°F today · 15 d/yr by 30 yrs out
- Wind 4/10 Moderate 20% chance of damaging wind over 30 yrs
- Air quality 4/10 Moderate 4 unhealthy d/yr today · 5 by 30 yrs out
Nearby sold comps map
Loading sold comps map…
Walkable amenities ~0.75 mi
Loading nearby amenities…
Taxation est. · year 1
- Rental income
- $35,863
- − Mortgage interest
- −$17,645
- − Property taxes
- −$2,998
- − Insurance
- −$1,575
- − Repairs & maintenance
- −$2,869
- − Management
- −$2,869
- − Depreciation
- −$9,164
- Taxable loss
- −$1,257
- Est. tax savings @ 24.0%
- +$302
- After-tax cash flow
- $4,238/yr
For passive investors: Depreciation is non-cash, so a rental often shows a tax loss while cash-flowing — sheltering income. Rental losses are passive: they offset passive income freely, and up to $25,000/yr can offset ordinary (W-2) income if you actively participate and your MAGI is under $100k (phasing out to $0 by $150k); unused losses carry forward. On sale, claimed depreciation is recaptured at up to 25%, and gains may owe capital-gains tax (a 1031 exchange can defer both). Figures are a year-1 estimate at your 24.0% rate — not tax advice; consult a CPA.
Schools (NCES district)
- District
- District Of Columbia Public Schools
- NCES district ID
- 1100030
- Math proficiency
- 33% ▲ 3.00%
- Reading proficiency
- 40% ▲ 5.00%
- Median HH income
- $67,671
- Composite
- 35.84/100
- National rank
- #9606
- State rank
- #8 of 32 in DC
Livability — Washington
- Score
- 73/100
- State rank
- #1
- US rank
- #5327
Category grades
Schools grade is shown separately in the Schools card above.
Census & demographics
- Census place
- Washington, DC
- County
- District of Columbia · 671,873 people
- City population
- 671,873
- Metro
- Washington-Arlington-Alexandria, DC-VA-MD-WV
- Population (ZIP)
- 63,380
- Household income
- $58,296
- Rent vs Own
- Severe rent burden
- 5115.0
Population outlook (District of Columbia County) Hauer SSP2
- Today (2025)
- 821,926 people
- By 2030
- 899,517 · +9.4%
- By 2040
- 1,061,162 · +29.1%
- By 2050
- 1,231,493 · +49.8%
- By 2075
- 1,603,312 · +95.1%
- By 2100
- 1,847,141 · +124.7%
Race, ethnicity, and origin ACS 2023
- Neighborhood character
- Predominantly Black (87%)
- Race & ethnicity
- Black 87% Hispanic / Latino 7% Two or more races 4% White 2%
- Hispanic origin (detail)
- Mexican 1% Dominican 1%
- Foreign-born
- 6% · Canada
- Languages at home
- 91% English-only · Spanish 6% French/Haitian/Cajun 1%
Political lean MEDSL · District of Columbia
- 2024 margin
- Solid D (+86.1) · D 91.2% · R 5.1% · Other 3.8%
- 2008→2024 swing
- +0.1pp no change · 2008: 85.9pp · 2024: 86.1pp
- All cycles
- 2024: D+86.1 2020: D+86.8 2016: D+88.7 2012: D+84.2 2008: D+85.9
Not yet ingested
- Civics
- —
Market trends
- HPI YoY
- ▼ -416.91%
- Current HPI
- 326.4481
- Rent YoY
- ▲ 6.06%
- Metro
- Washington-Arlington-Alexandria, DC-VA-MD-WV
- State GDP YoY
- ▲ 1.33%
- F500 in state
- 6
Industry mix (Fortune 500 HQ in DC)
| Industry | F500 HQs | Revenue |
|---|---|---|
| Financial Services | 1 | $153B |
|
||
| Life Sciences / Industrials | 1 | $25B |
|
||
| Industrial Machinery | 1 | $8B |
|
||
Price history
1 event — show timeline
- 2026-06-16 Coming Soon $314,999 BRIGHT MLS
Property tax history
+7.3%/yrLatest (2025): $2,998 · +1.2% YoY. Source: county tax records.
Cash-flow waterfall
monthlySold comps — $/sqft
last 12 mo · ≤1 miLoading sold comps…