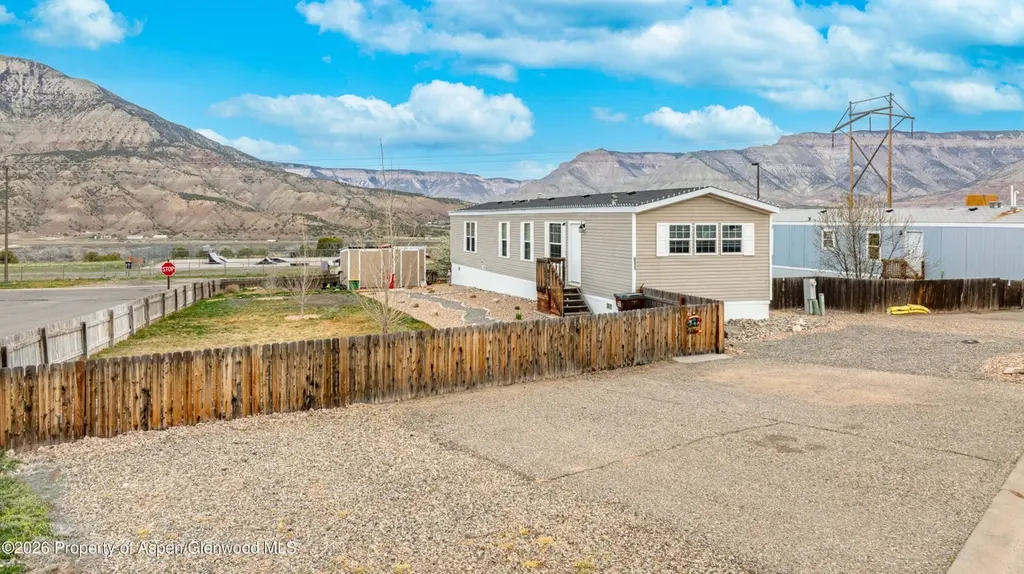
11 Silverton Pl · Battlement Mesa, CO
Flood risk 1/10 · Minimal
- FEMA flood zone
- X
- Chance of flooding over 30 yrs
- 0.0%
- Est. flood insurance / yr
- $507 – $1,088
Fire risk 6/10 · Moderate
- Est. fire insurance / yr
- $939 – $1,743
Heat risk 4/10 · Minor
- Hot days now (above 88°F)
- 7 days/yr
- Hot days in 30 yrs
- 20 days/yr
Wind risk 1/10 · Minimal
- Chance of severe wind over 30 yrs
- —
Air-quality risk 2/10 · Minimal
- Unhealthy air days now
- 2 days/yr
- Unhealthy air days in 30 yrs
- 2 days/yr
Risk factors via First Street. Map © Google.
Why this score? — see what drove the C+ grade
The composite is a weighted blend of 9 inputs, each scored 0–100. Each bar is that input's sub-score; the figure is the points it added to the 100-point composite (weight × sub-score).
- Cash flow +19.3/30.0
- ARV discount +11.7/15.0
- Appreciation +10.0/10.0
- DSCR +6.1/10.0
- 1% rule +5.1/10.0
- Condition / age +3.8/5.0
- Livability +3.0/5.0
- Rent growth +2.5/5.0
- Schools +1.9/10.0
$115,000
🖨 Deal sheet 📄 Offer letter ✓ Due diligence
Listing remarks
Excellent Condition! This home was built in 2020 and meticulously maintained and updated. Featuring central air, new laminate flooring in 2025, a new hot water heater, 2 storage sheds, and lovely landscaping with trees offering you the luxury of shade and privacy. This home wows with excellent views and the perks of an extra-large second bedroom, perfect for crafts, storage, or a bunk room. Ready to welcome you home, perfectly located in Saddleback Village, with Sunset Park close by, on a quiet cul-de-sac and spacious corner lot. Schedule your showing today.
Key facts
- Quiet cul-de-sac
- New hot water heater
- Central air
Tags
Property features AI
Finance
- Other: Directions: Take exit 75 and continue on County Road 215. Turn right onto W Battlement Pkwy. Turn right onto Stone Quarry Rd. Turn right onto Silverton Cir and destination is on your left.
Exterior
- Utilities: Community water
- Home design: Single-family property
- Exterior features: Not new construction; Located in the Saddleback Village subdivision
Interior
- Kitchen: Range; Microwave; Dishwasher; Refrigerator
- Bedrooms: Model: HUD
- Bathrooms: 2 full bathrooms
- Heating & cooling: Forced air heating; Has heating; Has cooling
- Interior features: Property in excellent condition
- Laundry & utility: Washer; Dryer
Neighborhood map
What this means for you Summary
Snapshot
- This is a 2-bed/2.0-bath manufactured listed at $115k. Condition is rated good.
Deal economics
- At list price, monthly cash flow is $126 ($2k/yr) — positive.
- The deal already cash-flows at list — no discount required.
- Meets the 1% rule at list price ($1k rent vs $115k).
- Recommended offer: $112k (3.0% below list) — sets the bar for market timing.
- Cap rate 7.6% vs local median 1.8% in Battlement Mesa — top-decile yield for the area; either an underpriced asset or a hidden risk that comps aren't pricing in. Stress-test before assuming the spread holds.
Location & tenants
- Location reads 59/100 on livability (#287 in CO) — a working-class tenant base; expect higher turnover. Strengths: housing A+, cost of living B+, employment B; Watch: crime C-, schools F, amenities F.
- Grand Valley School District No. 16 In The County Of Garfi (town): math 18% / reading 23% proficiency, ranked #72 of 86 in CO (top 84%) — low school quality limits family demand, transient renter base, plan for 1-2y turnover.
- Market conditions: 121 active listings in the ZIP; 171 units permitted in Garfield County in 2024 (64 in 5+ unit buildings).
Forward outlook
- In year one you build about $12k of equity ($795 loan paydown + $12k appreciation (10.0% local appreciation)).
- Garfield County population projected at +5% by 2050 — modest demand growth; plan on rents tracking national, not racing it.
- At projected returns (10.0% appreciation + 3.0% rent growth), your $32k cash investment doubles in ~3 years — after that, you're playing with house money.
- By year 3, paydown + projected appreciation supports a ~$31k cash-out refi (75% LTV) — recoverable capital for the next deal without selling this one.
Negotiation context
- It's been on market 44 days — a 3% lower offer ($112k) is reasonable based on typical stale-listing flexibility.
Risks & watch-outs
- Climate carrying-cost: major wildfire risk — expect insurance premiums to compound above CPI over the hold.
Questions for the listing agent
- It's been on market 44 days. Have you received any prior offers? Is the seller open to a 3% concession, seller financing, or rate buy-down credit?
- Is there a deadline driving the sale (1031 exchange, divorce, estate, relocation)? That informs how much negotiation room exists.
- Schools are F-rated, which usually means shorter tenancies and higher turnover. Who's the typical renter profile here, and what's been the actual vacancy rate?
- What's the average days-on-market for RENTAL listings here right now (not sales)? A rising rental-DOM trend means longer vacancies and softer asking-rent achievability than the comps imply.
- What's the recent tenant-quality profile in this submarket — average credit score on applications, eviction rate, late-payment / NSF rate, and stable-employment percentage? A property-management company in the area should have these aggregated.
- How much new for-sale + rental construction is in the pipeline within 1–3 miles? Heavy new supply typically softens prices + rents 12–24 months out; constrained supply supports both.
Investment metrics
- 1% rule
- 1.01% ✓
- Cap rate
- 7.61%
- Cash-on-cash
- 4.70%
- DSCR
- 1.21
- GRM
- 8.2
CMA / ARV
- ARV (on-the-fly)
- $126,688
- Comps found
- 12
Show comp detail 12 sales within ~0.75 mi
| Address | Dist | Beds/Ba | Sqft | Sold | Price | $/sf | Match |
|---|---|---|---|---|---|---|---|
| 11 Silverton Pl | 0.00mi | 2/2.0 | 1,184 (0%) | 0mo | $117,500 | $99 | 100 |
| 52 N Emerald Ln | 0.14mi | 3/2.0 (+1) | 1,152 (-3%) | 2mo | $170,000 | $148 | 82 |
| 104 Mahogany Cir | 0.10mi | 3/2.0 (+1) | 1,125 (-5%) | 2mo | $105,000 | $93 | 80 |
| 58 Logans Ln | 0.15mi | 3/2.0 (+1) | 1,110 (-6%) | 2mo | $93,000 | $84 | 76 |
| 32 Bent Creek Cir | 0.29mi | 3/2.0 (+1) | 1,108 (-6%) | 2mo | $127,500 | $115 | 69 |
| 244 Bent Creek Cir | 0.37mi | 3/2.0 (+1) | 1,120 (-5%) | 1mo | $125,000 | $112 | 68 |
| 205 Bent Creek Cir | 0.41mi | 3/2.0 (+1) | 1,170 (-1%) | 8mo | $132,000 | $113 | 67 |
| 116 Iron Wedge Cir | 0.41mi | 3/2.0 (+1) | 1,120 (-5%) | 6mo | $118,000 | $105 | 62 |
| 28 Iron Wedge Cir | 0.48mi | 3/2.0 (+1) | 1,120 (-5%) | 5mo | $119,000 | $106 | 60 |
| 88 W Carson Cir | 0.52mi | 3/2.0 (+1) | 1,120 (-5%) | 6mo | $120,000 | $107 | 56 |
| 103 Bent Creek Cir | 0.33mi | 3/1.5 (+1) | 1,013 (-14%) | 8mo | $109,072 | $108 | 48 |
| 72 Tamarisk Trl | 0.72mi | 3/2.0 (+1) | 1,296 (+10%) | 3mo | $88,000 | $68 | 43 |
Match score weights: distance 35% · size 25% · config 20% · recency 20%. Top-matched comps best support the ARV.
Projected returns pro-forma
10.0% appreciation · 3.0% rent growth · sell at horizon
- IRR
- 27.7%
- Equity multiple
- 3.20×
- Total profit
- $70,680
- Equity at exit
- $103,601
- IRR
- 24.2%
- Equity multiple
- 7.27×
- Total profit
- $201,861
- Equity at exit
- $223,420
Cash invested: $32,200 (down + closing). Projections, not guarantees.
Landlord ↔ Tenant lean methodology
- Overall (STATE)
- 38 Tenant-Leaning
- State Colorado
- 38 Tenant-Leaning · D+4
- County
- — inherits STATE
- City
- — inherits STATE
ZIP-level market 81635
- Home prices YoY
- 3.1%
- Active inventory
- 121
- Price-to-rent
- 8.2×
Monthly cashflow live
- Estimated rent
- $1,166 medium interval (Pro) →
- Mortgage (P&I)
- −$603
- Tax est. 1.5%
- −$144 /mo · $1,725/yr
- Insurance
- −$48
- HOA
- −$0
- Vacancy / Maint / Mgmt
- −$245
- Net cashflow
- $126
Break-even live
UW: 25.0% down · 7.5% · 30yr · 1.5% tax · 5.0% vac · 8.0% maint · 8.0% mgmt
Financing live
Cash to close
- Down payment
- $28,750
- Closing costs
- $3,450
- Reserves months
- —
- Total cash needed
- —
Loan-product check · same deal, 3 products live
Conventional
25% down · 7.5% · 30yr
- Down + closing
- —
- Monthly P&I
- —
- Monthly cashflow
- —
- DSCR
- —
- Eligible?
- —
Personal DTI + credit; lowest rate.
DSCR
20% down · 8.5% · 30yr
- Down + closing
- —
- Monthly P&I
- —
- Monthly cashflow
- —
- DSCR
- —
- Eligible?
- —
No personal income docs; deal must DSCR.
Hard money
10% down · 12.0% · 12mo
- Down + closing
- —
- Monthly P&I
- —
- Monthly cashflow
- —
- DSCR
- —
- Eligible?
- —
Short-term bridge; refi at stabilization.
Listing history 3 events
-
2026-05-07status Pending
-
2026-04-25price $115,000
-
2026-03-23$120,000 Active
ⓘ Source: listings_history table (triggers on properties + properties_extension) + one-shot
backfill from property_details.listing_events for pre-trigger history.
Climate risk First Street
- Flood 1/10 Low FEMA zone X · 0% chance over 30 yrs
- Wildfire 6/10 Major
- Heat 4/10 Moderate 7 d/yr ≥88°F today · 20 d/yr by 30 yrs out
- Wind 1/10 Low
- Air quality 2/10 Low 2 unhealthy d/yr today · 2 by 30 yrs out
Nearby sold comps map
Loading sold comps map…
Walkable amenities ~0.75 mi
Loading nearby amenities…
Taxation est. · year 1
- Rental income
- $13,987
- − Mortgage interest
- −$6,442
- − Property taxes
- −$1,725
- − Insurance
- −$575
- − Repairs & maintenance
- −$1,119
- − Management
- −$1,119
- − Depreciation
- −$3,345
- Taxable loss
- −$338
- Est. tax savings @ 24.0%
- +$81
- After-tax cash flow
- $1,594/yr
For passive investors: Depreciation is non-cash, so a rental often shows a tax loss while cash-flowing — sheltering income. Rental losses are passive: they offset passive income freely, and up to $25,000/yr can offset ordinary (W-2) income if you actively participate and your MAGI is under $100k (phasing out to $0 by $150k); unused losses carry forward. On sale, claimed depreciation is recaptured at up to 25%, and gains may owe capital-gains tax (a 1031 exchange can defer both). Figures are a year-1 estimate at your 24.0% rate — not tax advice; consult a CPA.
Condition & rehab AI · 13 photos
This 2020 manufactured home in excellent condition offers central air, new laminate flooring, and a spacious corner lot with lovely landscaping. Ready for a new owner to move in and enjoy the mountain views.
Value-add opportunities
- Resale paint exterior — enhances curb appeal
- Both landscape — improves curb appeal and enhances property value
- Resale install new flooring in kitchen — new flooring improves aesthetics and functionality
- Resale install new hot water heater — newer appliance improves comfort and energy efficiency
Renovation cost estimate screening
Value-add ROI direction
- Resale paint exterior — enhances curb appeal ↑
- Both landscape — improves curb appeal and enhances property value ↑
- Resale install new flooring in kitchen — new flooring improves aesthetics and functionality ↑
- Resale install new hot water heater — newer appliance improves comfort and energy efficiency ↑
ⓘ Cost ranges are severity-bucket heuristics (US national rule-of-thumb). Get contractor quotes + a written scope before underwriting a rehab budget.
Schools (NCES district)
- District
- Grand Valley School District No. 16 In The County Of Garfi
- NCES district ID
- 0804380
- Math proficiency
- 18% ▲ 3.00%
- Reading proficiency
- 23% ▼ -2.00%
- Median HH income
- $59,301
- Composite
- 19.2/100
- National rank
- #8815
- State rank
- #72 of 86 in CO
Livability — Battlement Mesa
- Score
- 59/100
- State rank
- #287
- US rank
- #20600
Category grades
Schools grade is shown separately in the Schools card above.
Census & demographics
- Census place
- Battlement Mesa, CO
- Population (ZIP)
- 7,155
Population outlook (Garfield County) Hauer SSP2
- Today (2025)
- 61,756 people
- By 2030
- 63,255 · +2.4%
- By 2040
- 64,952 · +5.2%
- By 2050
- 64,937 · +5.2%
- By 2075
- 62,413 · +1.1%
- By 2100
- 55,730 · -9.8%
Race, ethnicity, and origin ACS 2023
- Neighborhood character
- Predominantly White (70%)
- Race & ethnicity
- White 70% Hispanic / Latino 24% Two or more races 6% Asian 1%
- Hispanic origin (detail)
- Mexican 21%
- Common ancestry
- Lithuanian 2% Portuguese 2% Serbian 1%
- Foreign-born
- 9% · Canada
- Languages at home
- 81% English-only · Spanish 19%
Political lean MEDSL · Garfield
- 2024 margin
- Toss-up / Even · D 49.8% · R 47.7% · Other 2.5%
- 2008→2024 swing
- +2.1pp toward D · 2008: -0.0pp · 2024: 2.1pp
- All cycles
- 2024: D+2.1 2020: D+2.3 2016: R+7.1 2012: R+4.9 2008: R+0.0
Not yet ingested
- Civics
- —
Market trends
- HPI YoY
- ▲ 12.90%
- Current HPI
- 434.5219
- Rent YoY
- —
- Metro
- —
- State GDP YoY
- ▲ 1.95%
- F500 in state
- 14
Industry mix (Fortune 500 HQ in CO)
| Industry | F500 HQs | Revenue |
|---|---|---|
| Technology Distribution | 1 | $31B |
|
||
| Food / Agriculture | 1 | $18B |
|
||
| Packaging | 1 | $14B |
|
||
| Healthcare | 1 | $13B |
|
||
| Energy | 1 | $10B |
|
||
| Technology | 1 | $4B |
|
||
Price history
-4.2% since first listed3 events — show timeline
- 2026-05-07 Pending — AGMLS
- 2026-04-25 Price Changed $115,000 AGMLS
- 2026-03-23 Listed $120,000 AGMLS
Cash-flow waterfall
monthlySold comps — $/sqft
last 12 mo · ≤1 miLoading sold comps…