 Multi-family
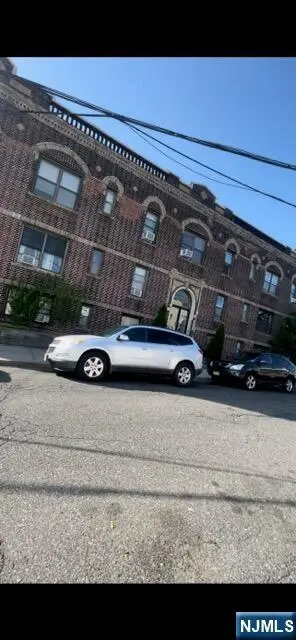
400 Woodcliff Ave · Fairview, NJ
Flood risk 1/10 · Minimal
- FEMA flood zone
- X (unshaded)
- Chance of flooding over 30 yrs
- 0.0%
- Est. flood insurance / yr
- $507 – $1,088
Fire risk 1/10 · Minimal
- Est. fire insurance / yr
- $526 – $976
Heat risk 6/10 · Moderate
- Hot days now (above 99°F)
- 7 days/yr
- Hot days in 30 yrs
- 15 days/yr
Wind risk 6/10 · Moderate
- Chance of severe wind over 30 yrs
- 27.0%
Air-quality risk 4/10 · Minor
- Unhealthy air days now
- 5 days/yr
- Unhealthy air days in 30 yrs
- 6 days/yr
Risk factors via First Street. Map © Google.
Why this score? — see what drove the B- grade
The composite is a weighted blend of 9 inputs, each scored 0–100. Each bar is that input's sub-score; the figure is the points it added to the 100-point composite (weight × sub-score).
- Cash flow +30.0/30.0
- DSCR +10.0/10.0
- 1% rule +9.9/10.0
- ARV discount +7.5/15.0
- Rent growth +3.7/5.0
- Livability +3.7/5.0
- Condition / age +2.5/5.0
- Schools +2.2/10.0
- Appreciation +0.0/10.0
$1,745,000
🖨 Deal sheet (PDF) 📄 Offer letter ✓ Due diligence
Multi-family units
County records classify this as Multi-Family (5+ Unit). Listing-text estimate: 1 unit. estimate disagrees with records
5+ unit building — per-unit beds/baths from public records are typically unavailable; the breakdown below (if shown) is an estimate from the listing text.
Listing remarks MLS
Well Maintained Investment Building with 11 Apts ( Originally 12 ) on WoodCliff Ave ( 10 with 1 Bedroom and 1 with 3 Bedrooms) in the North Part of North Bergen, neighboring the James Braddock Park and Short Bus Ride to NYC. Close to Shopping, Park ( Across the Street ), Schools, Places of Worship, NYC Bus Stop. One Car Detached Garage and 1 Car Parking Space. Corner Lot with Entrance on Fulton. Seller reserves the Right to exercise a 1031 Exchange. Strictly sold As Is.
Key facts
- Investment building
- Woodcliff ave
- Bus ride to nyc
Tags
Neighborhood map
What this means for you Summary
Snapshot
- This is a multifamily listed at $1.75M.
Deal economics
- At list price, monthly cash flow is $9k ($104k/yr) — positive.
- The deal already cash-flows at list — no discount required.
- Meets the 1% rule at list price ($26k rent vs $1.75M).
- Recommended offer: $1.64M (6.0% below list) — sets the bar for market timing.
- Cap rate 12.3% vs local median 2.6% in Fairview — top-decile yield for the area; either an underpriced asset or a hidden risk that comps aren't pricing in. Stress-test before assuming the spread holds.
Location & tenants
- Location reads 74/100 on livability (#174 in NJ, #4,548 nationally) — a middle-class / working-renter tenant base. Strengths: crime A+, employment A+, housing A+; Watch: commute C-, cost of living F.
- North Bergen School District (suburban): math 12% / reading 37% proficiency, ranked #393 of 472 in NJ (top 83%) — low school quality limits family demand, transient renter base, plan for 1-2y turnover.
- Zoned schools: Robert Fulton Elementary School (math 16% / reading 44%, grade F, #721 of 1,303 statewide, top 56%, 880 students, 52% FRL); North Bergen High School (math 13% / reading 36%, grade F, #327 of 399 statewide, top 82%, 2,355 students, 50% FRL) — zoned schools at 51% FRL track the district average.
- Market conditions: Rents rising fast (+5.0%/yr); 210 active listings in the ZIP; solid renter incomes; 5,310 units permitted in Hudson County in 2024 (4,154 in 5+ unit buildings).
- At $26,014/mo this rent would consume 396% of the median local household income ($79k/yr) (locally 3908% of renters already pay >50% of income on rent) — very limited rent-growth headroom before tenants either downsize or default.
Forward outlook
- Local home prices are declining (-3.0%/yr); year-one equity from $12k of loan paydown is wiped out by about $52k of value loss. Plan a longer hold.
- Hudson County population projected at +29% by 2050 — long-run rental-demand tailwind backs the buy-and-hold thesis.
- At projected returns (-3.0% appreciation + 5.0% rent growth), your $489k cash investment doubles in ~6 years — after that, you're playing with house money.
Negotiation context
- It's been on market 66 days — a 6% lower offer ($1.64M) is reasonable based on typical stale-listing flexibility.
- 3 sale attempts since 2y ago with the ask held roughly flat each time — persistent listings suggest the price (not the market) is what's stuck; bring a comps-based counter.
Risks & watch-outs
- Watch-outs: built in 1930 — expect roof / HVAC / electrical / plumbing capex.
- Climate carrying-cost: major wind risk, 27% chance of damaging wind over 30y; extreme-heat days projected 7→15/yr by 2055 (HVAC capex compounding) — expect insurance premiums to compound above CPI over the hold.
Questions for the listing agent
- It's been on market 66 days. Have you received any prior offers? Is the seller open to a 6% concession, seller financing, or rate buy-down credit?
- Built in 1930 — when were the roof, HVAC, electrical panel, plumbing, and water heater last replaced?
- Why hasn't it sold? Are there any deal-killer items the seller is aware of (foundation, flood, title, zoning, code violations)?
- Is there a deadline driving the sale (1031 exchange, divorce, estate, relocation)? That informs how much negotiation room exists.
- Schools are D-rated, which usually means shorter tenancies and higher turnover. Who's the typical renter profile here, and what's been the actual vacancy rate?
- What's the average days-on-market for RENTAL listings here right now (not sales)? A rising rental-DOM trend means longer vacancies and softer asking-rent achievability than the comps imply.
- What's the recent tenant-quality profile in this submarket — average credit score on applications, eviction rate, late-payment / NSF rate, and stable-employment percentage? A property-management company in the area should have these aggregated.
- How much new apartment / multifamily construction is in the pipeline within 1–3 miles? Heavy new supply (>2% of stock underway) typically softens rents 12–24 months out; light construction supports rent growth.
Investment metrics
- 1% rule
- 1.49% ✓
- Cap rate
- 12.27%
- Cash-on-cash
- 21.36%
- DSCR
- 1.95
- GRM
- 5.6
CMA / ARV
- ARV (median comp)
- $860,572
- List price
- $1,745,000
- Delta
- 102.77%
- Verdict
- OVERPRICED
- Comps
- 5 within 1.0 mi
Projected returns pro-forma
-3.0% appreciation · 4.99% rent growth · sell at horizon
- IRR
- 16.1%
- Equity multiple
- 1.66×
- Total profit
- $324,648
- Equity at exit
- $260,185
- IRR
- 26.1%
- Equity multiple
- 3.51×
- Total profit
- $1,224,204
- Equity at exit
- $150,876
Cash invested: $488,600 (down + closing). Projections, not guarantees.
Landlord ↔ Tenant lean methodology
- Overall (STATE)
- 21 Tenant-Leaning
- State New Jersey
- 21 Tenant-Leaning · D+6
- County
- — inherits STATE
- City
- — inherits STATE
ZIP-level market 07047
- Home prices YoY
- -31.5%
- Rents YoY
- 5.0%
- Active inventory
- 210
- Price-to-rent
- 64.0×
Monthly cashflow live
- Estimated rent
- $26,014 high interval (Pro) →
- Mortgage (P&I)
- −$9,151
- Tax from tax record
- −$1,974 /mo · $23,691/yr
- Insurance
- −$727
- HOA
- −$0
- Vacancy / Maint / Mgmt
- −$5,463
- Net cashflow
- $8,699
Break-even live
Sensitivity live
| Price | -10% $9,687 | -5% $9,193 | +0% $8,699 | +5% $8,205 | +10% $7,711 |
|---|---|---|---|---|---|
| Rent | -10% $6,644 | -5% $7,671 | +0% $8,699 | +5% $9,726 | +10% $10,754 |
| Rate | -1.0pp $9,578 | -0.5pp $9,143 | base $8,699 | +0.5pp $8,247 | +1.0pp $7,787 |
11-unit breakdown (identical units grouped — click to expand)
| Units | Beds | Baths | Est. rent |
|---|---|---|---|
| 10× units | 1 | 1 | $22,710 |
| #1 | 1 | 1 | $2,271 |
| #2 | 1 | 1 | $2,271 |
| #3 | 1 | 1 | $2,271 |
| #4 | 1 | 1 | $2,271 |
| #5 | 1 | 1 | $2,271 |
| #6 | 1 | 1 | $2,271 |
| #7 | 1 | 1 | $2,271 |
| #8 | 1 | 1 | $2,271 |
| #9 | 1 | 1 | $2,271 |
| #10 | 1 | 1 | $2,271 |
| 1× unit | 3 | 1 | $3,305 |
| Total (11 units) | $26,014 | ||
UW: 25.0% down · 7.5% · 30yr · 1.5% tax · 5.0% vac · 8.0% maint · 8.0% mgmt
Financing live
Cash to close
- Down payment
- $436,250
- Closing costs
- $52,350
- Reserves months
- —
- Total cash needed
- —
Loan-product check · same deal, 3 products live
Conventional
25% down · 7.5% · 30yr
- Down + closing
- —
- Monthly P&I
- —
- Monthly cashflow
- —
- DSCR
- —
- Eligible?
- —
Personal DTI + credit; lowest rate.
DSCR
20% down · 8.5% · 30yr
- Down + closing
- —
- Monthly P&I
- —
- Monthly cashflow
- —
- DSCR
- —
- Eligible?
- —
No personal income docs; deal must DSCR.
Hard money
10% down · 12.0% · 12mo
- Down + closing
- —
- Monthly P&I
- —
- Monthly cashflow
- —
- DSCR
- —
- Eligible?
- —
Short-term bridge; refi at stabilization.
Listing history 17 events
-
2026-06-21days on market $1,745,000 Active 66 DOM
-
2026-06-18days on market $1,745,000 Active 63 DOM
-
2026-06-17days on market $1,745,000 Active 62 DOM
-
2026-06-16days on market $1,745,000 Active 61 DOM
-
2026-06-15days on market $1,745,000 Active 60 DOM
-
2026-06-13days on market $1,745,000 Active 58 DOM
-
2026-06-09days on market $1,745,000 Active 54 DOM
-
2026-06-08days on market $1,745,000 Active 53 DOM
-
2026-06-07days on market $1,745,000 Active 52 DOM
-
2026-06-04days on market $1,745,000 Active 49 DOM
-
2026-06-03days on market $1,745,000 Active 48 DOM
-
2026-06-02days on market $1,745,000 Active 47 DOM
-
2026-06-01days on market $1,745,000 Active 46 DOM
-
2026-05-31days on market $1,745,000 Active 45 DOM
-
2026-04-16$1,745,000 Active 474-char remark
Show marketing remark (474 chars)
Well Maintained Investment Building with 11 Apts ( Originally 12 ) on WoodCliff Ave ( 10 with 1 Bedroom and 1 with 3 Bedrooms) in the North Part of North Bergen, neighboring the James Braddock Park and Short Bus Ride to NYC. Close to Shopping, Park ( Across the Street ), Schools, Places of Worship, NYC Bus Stop. One Car Detached Garage and 1 Car Parking Space. Corner Lot with Entrance on Fulton. Seller reserves the Right to exercise a 1031 Exchange. Strictly sold As Is.
-
2025-02-21$1,745,000 Active
-
2024-07-15$1,795,000 Active
ⓘ Source: listings_history table (triggers on properties + properties_extension) + one-shot
backfill from property_details.listing_events for pre-trigger history.
Tax reassessment forecast NJ · Partial reset (capped growth)
- Current annual tax
- $23,691 · $1,974/mo
- Projected year-2 tax
- $33,571 · $2,798/mo
- Expected delta
- +$9,880/yr (+$823/mo · 41.7%)
ⓘ Screening estimate from a state-policy table — verify with the county assessor before closing.
Climate risk First Street
- Flood 1/10 Low FEMA zone X (unshaded) · 0% chance over 30 yrs
- Wildfire 1/10 Low
- Heat 6/10 Major 7 d/yr ≥99°F today · 15 d/yr by 30 yrs out
- Wind 6/10 Major 27% chance of damaging wind over 30 yrs
- Air quality 4/10 Moderate 5 unhealthy d/yr today · 6 by 30 yrs out
Nearby sold comps map
Loading sold comps map…
Walkable amenities ~0.75 mi
Loading nearby amenities…
Taxation est. · year 1
- Rental income
- $312,168
- − Mortgage interest
- −$97,747
- − Property taxes
- −$23,691
- − Insurance
- −$8,725
- − Repairs & maintenance
- −$24,973
- − Management
- −$24,973
- − Depreciation
- −$50,764
- Taxable income
- $81,294
- Est. tax owed @ 24.0%
- −$19,511
- After-tax cash flow
- $84,875/yr
For passive investors: Depreciation is non-cash, so a rental often shows a tax loss while cash-flowing — sheltering income. Rental losses are passive: they offset passive income freely, and up to $25,000/yr can offset ordinary (W-2) income if you actively participate and your MAGI is under $100k (phasing out to $0 by $150k); unused losses carry forward. On sale, claimed depreciation is recaptured at up to 25%, and gains may owe capital-gains tax (a 1031 exchange can defer both). Figures are a year-1 estimate at your 24.0% rate — not tax advice; consult a CPA.
Schools (NCES district)
- District
- North Bergen School District
- NCES district ID
- 3411460
- Math proficiency
- 12% ▼ -16.00%
- Reading proficiency
- 37% ▼ -10.00%
- Median HH income
- $54,275
- Composite
- 21.95/100
- National rank
- #8221
- State rank
- #393 of 472 in NJ
Livability — Fairview
- Score
- 74/100
- State rank
- #174
- US rank
- #4548
Category grades
Schools grade is shown separately in the Schools card above.
Census & demographics
- County
- Hudson County · 718,323 people
- City population
- 15,099
- Metro
- New York-Newark-Jersey City, NY-NJ-PA
- Population (ZIP)
- 61,250
- Household income
- $78,911
- Rent vs Own
- Severe rent burden
- 3908.0
Population outlook (Hudson County) Hauer SSP2
- Today (2025)
- 771,834 people
- By 2030
- 818,028 · +6.0%
- By 2040
- 907,866 · +17.6%
- By 2050
- 994,480 · +28.8%
- By 2075
- 1,163,301 · +50.7%
- By 2100
- 1,254,703 · +62.6%
Race, ethnicity, and origin ACS 2023
- Neighborhood character
- Predominantly Hispanic (69%)
- Race & ethnicity
- Hispanic / Latino 69% Two or more races 26% White 20% Asian 7% Black 3% Native American 1%
- Hispanic origin (detail)
- Mexican 2% Puerto Rican 7% Cuban 11% Dominican 12%
- Common ancestry
- Romanian 1% Lithuanian 1%
- Foreign-born
- 50% · Canada, Jamaica, South Korea
- Languages at home
- 27% English-only · Spanish 61% Other Indo-European 4% Arabic 3%
Political lean MEDSL · Hudson
- 2024 margin
- Strong D (+28.1) · D 62.6% · R 34.6% · Other 2.8%
- 2008→2024 swing
- -18.7pp toward R · 2008: 46.7pp · 2024: 28.1pp
- All cycles
- 2024: D+28.1 2020: D+46.2 2016: D+51.8 2012: D+55.7 2008: D+46.7
Not yet ingested
- Civics
- —
Market trends
- HPI YoY
- ▼ -192.36%
- Current HPI
- 419.0283
- Rent YoY
- ▲ 4.99%
- Metro
- New York-Newark-Jersey City, NY-NJ-PA
- State GDP YoY
- ▲ 2.05%
- F500 in state
- 34
Industry mix (Fortune 500 HQ in NJ)
| Industry | F500 HQs | Revenue |
|---|---|---|
| Consumer Goods | 3 | $31B |
|
||
| Pharmaceuticals | 2 | $153B |
|
||
| Technology | 2 | $21B |
|
||
| Insurance | 2 | $20B |
|
||
| Healthcare | 2 | $19B |
|
||
| Financial Services | 1 | $70B |
|
||
Price history
-2.8% since first listed3 events — show timeline
- 2026-04-16 Listed $1,745,000 NJMLS
- 2025-02-21 Listed $1,745,000 NJMLS
- 2024-07-15 Listed $1,795,000 NJMLS
Property tax history
+3.5%/yrLatest (2025): $23,691 · +4.6% YoY. Source: county tax records.
Cash-flow waterfall
monthlySold comps — $/sqft
last 12 mo · ≤1 miLoading sold comps…