9121 Sunrise Lakes Blvd #101 · Sunrise, FL
Flood risk 1/10 · Minimal
- FEMA flood zone
- X (shaded)
- Chance of flooding over 30 yrs
- 0.0%
- Est. flood insurance / yr
- $507 – $1,088
Fire risk 1/10 · Minimal
- Est. fire insurance / yr
- $947 – $1,759
Heat risk No data
- Hot days now (above threshold)
- —
- Hot days in 30 yrs
- —
Wind risk 10/10 · Severe
- Chance of severe wind over 30 yrs
- 99.0%
Air-quality risk 3/10 · Minor
- Unhealthy air days now
- 2 days/yr
- Unhealthy air days in 30 yrs
- 3 days/yr
Risk factors via First Street. Map © Google.
Why this score? — see what drove the C+ grade
The composite is a weighted blend of 9 inputs, each scored 0–100. Each bar is that input's sub-score; the figure is the points it added to the 100-point composite (weight × sub-score).
- Cash flow +23.3/30.0
- 1% rule +10.0/10.0
- DSCR +7.5/10.0
- ARV discount +7.5/15.0
- Livability +4.2/5.0
- Schools +4.1/10.0
- Rent growth +2.7/5.0
- Condition / age +2.5/5.0
- Appreciation +0.0/10.0
$85,500
🖨 Deal sheet 📄 Offer letter ✓ Due diligence
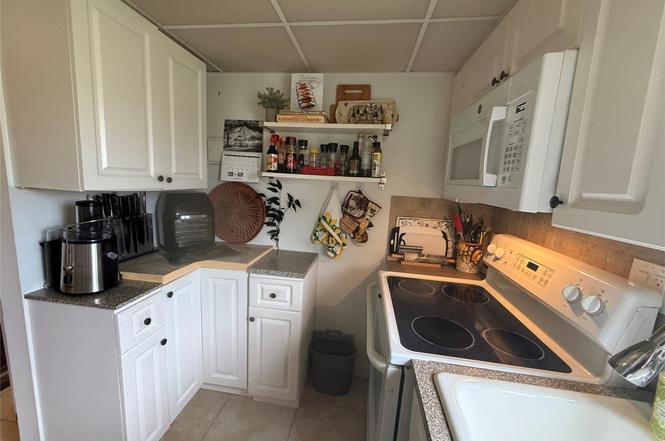
Listing remarks
Well maintained condo 1 bedroom, 1 bath. First floor and corner unit, very bright and clear a lot of windows. Come fully furnish, turnkey, Move in ready condition. Located in a very quiet community of Sunrise Lakes. Maintenance includes internet, cable TV, free golf, tennis, movies shows, bingo, exercise room, inside pool and spa. This is a 55+ community no rental
Key facts
- First floor
- Corner unit
- Fully furnished
Tags
Neighborhood map
What this means for you Summary
Snapshot
- This is a 1-bed/1.0-bath condo listed at $86k.
Deal economics
- At list price, monthly cash flow is $156 ($2k/yr) — positive.
- The deal already cash-flows at list — no discount required.
- Meets the 1% rule at list price ($2k rent vs $86k).
- Recommended offer: $83k (3.0% below list) — sets the bar for market timing.
- Cap rate 8.5% vs local median 4.9% in Sunrise — top-decile yield for the area; either an underpriced asset or a hidden risk that comps aren't pricing in. Stress-test before assuming the spread holds.
Location & tenants
- Location reads 83/100 on livability (#56 in FL, #986 nationally) — a professional / high-income tenant draw. Strengths: commute A+, housing A+, health & safety A+; Watch: employment C-, amenities F.
- Broward (suburban): math 42% / reading 53% proficiency, ranked #46 of 73 in FL (top 63%) — families likely to look elsewhere, expect single-tenant / working-renter base with shorter leases.
- Market conditions: Rents flat; 559 active listings in the ZIP; 37 comparable units currently listed for rent nearby; rentals at typical pace (median 25d on market — plan ~3-4 weeks tenant-placement turnaround); 2,111 units permitted in Broward County in 2024 (1,265 in 5+ unit buildings).
Forward outlook
- Local home prices are declining (-3.0%/yr); year-one equity from $591 of loan paydown is wiped out by about $3k of value loss. Plan a longer hold.
- Broward County population projected at +34% by 2050 — long-run rental-demand tailwind backs the buy-and-hold thesis.
Negotiation context
- It's been on market 39 days — a 3% lower offer ($83k) is reasonable based on typical stale-listing flexibility.
- 3 sale attempts since 2y ago with the ask held roughly flat each time — persistent listings suggest the price (not the market) is what's stuck; bring a comps-based counter.
- Current owner paid $18k; list at $86k implies a 389% gain — meaningful room to come down on a strong offer.
Risks & watch-outs
- Watch-outs: HOA is 36% of rent.
- Climate carrying-cost: severe wind risk, 99% chance of damaging wind over 30y — expect insurance premiums to compound above CPI over the hold.
Questions for the listing agent
- It's been on market 39 days. Have you received any prior offers? Is the seller open to a 3% concession, seller financing, or rate buy-down credit?
- Built in 1978 — when were the roof, HVAC, electrical panel, plumbing, and water heater last replaced?
- What does the HOA fee cover, when was the last increase, and are there any pending special assessments or reserve-fund shortfalls?
- Any open or pending special assessments — roof, HVAC, plumbing, elevator, façade? What's the per-unit balance and payoff schedule, and is the seller paying it off at close or rolling it to the buyer?
- Is there a deadline driving the sale (1031 exchange, divorce, estate, relocation)? That informs how much negotiation room exists.
- What's the average days-on-market for RENTAL listings here right now (not sales)? A rising rental-DOM trend means longer vacancies and softer asking-rent achievability than the comps imply.
- What's the recent tenant-quality profile in this submarket — average credit score on applications, eviction rate, late-payment / NSF rate, and stable-employment percentage? A property-management company in the area should have these aggregated.
- How much new apartment / multifamily construction is in the pipeline within 1–3 miles? Heavy new supply (>2% of stock underway) typically softens rents 12–24 months out; light construction supports rent growth.
Investment metrics
- 1% rule
- 2.06% ✓
- Cap rate
- 8.48%
- Cash-on-cash
- 7.81%
- DSCR
- 1.35
- GRM
- 4.0
CMA / ARV
No comps found within radius.
Projected returns pro-forma
-3.0% appreciation · 0.6% rent growth · sell at horizon
- IRR
- -9.1%
- Equity multiple
- 0.68×
- Total profit
- $-7,657
- Equity at exit
- $12,748
- IRR
- -6.8%
- Equity multiple
- 0.65×
- Total profit
- $-8,401
- Equity at exit
- $7,392
Cash invested: $23,940 (down + closing). Projections, not guarantees.
Landlord ↔ Tenant lean methodology
- Overall (STATE)
- 87 Strongly Landlord-Friendly
- State Florida
- 87 Strongly Landlord-Friendly · R+3
- County
- — inherits STATE
- City
- — inherits STATE
ZIP-level market 33322
- Home prices YoY
- -33.3%
- Rents YoY
- 0.6%
- Active inventory
- 559
- Price-to-rent
- 4.0×
Monthly cashflow live
- Estimated rent
- $1,760 high interval (Pro) →
- Mortgage (P&I)
- −$448
- Tax from tax record
- −$121 /mo · $1,455/yr
- Insurance
- −$36
- HOA
- −$629
- Vacancy / Maint / Mgmt
- −$370
- Net cashflow
- $156
Break-even live
UW: 25.0% down · 7.5% · 30yr · 1.5% tax · 5.0% vac · 8.0% maint · 8.0% mgmt
Financing live
Cash to close
- Down payment
- $21,375
- Closing costs
- $2,565
- Reserves months
- —
- Total cash needed
- —
Loan-product check · same deal, 3 products live
Conventional
25% down · 7.5% · 30yr
- Down + closing
- —
- Monthly P&I
- —
- Monthly cashflow
- —
- DSCR
- —
- Eligible?
- —
Personal DTI + credit; lowest rate.
DSCR
20% down · 8.5% · 30yr
- Down + closing
- —
- Monthly P&I
- —
- Monthly cashflow
- —
- DSCR
- —
- Eligible?
- —
No personal income docs; deal must DSCR.
Hard money
10% down · 12.0% · 12mo
- Down + closing
- —
- Monthly P&I
- —
- Monthly cashflow
- —
- DSCR
- —
- Eligible?
- —
Short-term bridge; refi at stabilization.
Rent comps 37 comps
| Address | Beds | Baths | Sqft | Rent | $/sqft | DOM | Units | Dist |
|---|---|---|---|---|---|---|---|---|
| 8590 Sunrise Lakes Blvd #106 Sunrise, FL | 1.0 | 1.0 | 640 | $1,475 | $2.30 | 24d | 1 | 0.51mi |
| 8595 Sunrise Lakes Blvd #207 Sunrise, FL | 1.0 | 1.0 | 640 | $1,700 | $2.66 | 24d | 1 | 0.52mi |
| 8595 Sunrise Lakes Blvd #307 Sunrise, FL | 1.0 | 1.0 | 640 | $1,400 | $2.19 | 1d | 1 | 0.52mi |
| 8595 Sunrise Lakes Blvd Sunrise, FL | 1.0 | 1.0 | 640 | $1,550 | $2.42 | 21d | 2 | 0.53mi |
| 8465 Sunrise Lakes Blvd #106 Sunrise, FL | 1.0 | 1.0 | 640 | $1,450 | $2.27 | 24d | 1 | 0.62mi |
| 8400 Sunrise Lakes Blvd #106 Sunrise, FL | 1.0 | 1.0 | 640 | $1,400 | $2.19 | 24d | 1 | 0.66mi |
| 8400 Sunrise Lakes Blvd #106 Sunrise, FL | 1.0 | 1.0 | 640 | $1,400 | $2.19 | 8d | 1 | 0.66mi |
| 9720 NW 24th Pl Unit B Sunrise, FL | 1.0 | 1.0 | 700 | $1,750 | $2.50 | 24d | 1 | 0.66mi |
| 8798 NW 38th St Sunrise, FL | 1.0–2.0 | 1.0–2.0 | 893 | $1,826 | $2.04 | 8d | 1 | 0.77mi |
| 8285 Sunrise Lakes Blvd #208 Sunrise, FL | 1.0 | 1.0 | 640 | $1,400 | $2.19 | 24d | 1 | 0.77mi |
| 8285 Sunrise Lakes Blvd #208 Sunrise, FL | 1.0 | 1.0 | 640 | $1,400 | $2.19 | 8d | 1 | 0.77mi |
| 9968 Nob Hill Ln #9968 Sunrise, FL | 1.0 | 1.0 | 744 | $1,800 | $2.42 | 24d | 1 | 0.82mi |
| 9943 Nob Hill Pl #9943 Sunrise, FL | 1.0 | 1.0 | 744 | $1,875 | $2.52 | 11d | 1 | 0.82mi |
| 9823 Nob Hill Ct #9823 Sunrise, FL | 1.0 | 1.0 | 744 | $1,850 | $2.49 | 12d | 1 | 0.82mi |
| 9934 Nob Hill Pl #9934 Sunrise, FL | 1.0 | 1.0 | 744 | $1,790 | $2.41 | 2d | 1 | 0.82mi |
| 9934 Nob Hill Pl #9934 Sunrise, FL | 1.0 | 1.0 | 744 | $1,850 | $2.49 | 24d | 1 | 0.82mi |
| 3935 NW 87th Ave Sunrise, FL | 1.0 | 1.0 | 595 | $1,600 | $2.69 | 24d | 1 | 0.89mi |
| 8135 Sunrise Lakes Blvd Sunrise, FL | 1.0–2.0 | 1.0–2.0 | 745 | $1,500 | $2.01 | 24d | 2 | 0.90mi |
| 3973 NW 87th Ave #3973 Sunrise, FL | 2.0 | 1.0 | 731 | $1,899 | $2.60 | 24d | 1 | 0.90mi |
| 4072 NW 87th Ave Unit 4072 Sunrise, FL | 1.0 | 1.0 | 595 | $1,690 | $2.84 | 17d | 1 | 0.90mi |
| 8775 NW 39th St #8775 Sunrise, FL | 2.0 | 1.0 | 731 | $1,845 | $2.52 | 14d | 1 | 0.90mi |
| 4028 NW 87th Ave #4028 Sunrise, FL | 1.0 | 1.0 | 595 | $1,700 | $2.86 | 24d | 1 | 0.90mi |
| 4071 NW 87th Ave Sunrise, FL | 1.0 | 1.0 | 595 | $1,699 | $2.86 | 24d | 1 | 0.90mi |
| 3968 NW 87th Ave #3968 Sunrise, FL | 1.0 | 1.0 | 595 | $1,625 | $2.73 | 8d | 1 | 0.92mi |
| 3968 NW 87th Ave #3968 Sunrise, FL | 1.0 | 1.0 | 595 | $1,625 | $2.73 | 24d | 1 | 0.92mi |
| 8110 Sunrise Lakes Blvd #307 Sunrise, FL | 1.0 | 1.0 | 640 | $1,500 | $2.34 | 18d | 1 | 0.93mi |
| 8110 Sunrise Lakes Blvd #307 Sunrise, FL | 1.0 | 1.0 | 640 | $1,500 | $2.34 | 2d | 1 | 0.93mi |
| 8100 Sunrise Lakes Blvd Sunrise, FL | 1.0–2.0 | 1.0–2.0 | 745 | $1,380 | $1.85 | 11d | 2 | 0.94mi |
| 4044 NW 87th Ave #4044 Sunrise, FL | 1.0 | 1.0 | 630 | $1,649 | $2.62 | 24d | 1 | 0.94mi |
| 4096 N Pine Island Rd #2102 Sunrise, FL | 1.0 | 1.0 | 595 | $1,625 | $2.73 | 24d | 1 | 0.96mi |
| 8083-8093 W Oakland Park Blvd Sunrise, FL | 1.0–3.0 | 1.0–2.0 | 1054 | $2,620 | $2.48 | 24d | 37 | 1.08mi |
| 8053 W Oakland Park Blvd Unit 1-204 Sunrise, FL | 1.0 | 1.0 | 735 | $2,450 | $3.33 | 24d | 1 | 1.11mi |
| 8053 W Oakland Park Blvd Unit 6-307 Sunrise, FL | 1.0 | 1.0 | 727 | $2,618 | $3.60 | 24d | 1 | 1.11mi |
| 2347 NW 107th Ave Unit B Sunrise, FL | — | 1.0 | 364 | $1,300 | $3.57 | 24d | 1 | 1.26mi |
| 11135 NW 25th Ct Unit 1 Sunrise, FL | — | 1.0 | 350 | $1,399 | $4.00 | 24d | 1 | 1.46mi |
| 11135 NW 25th Ct Unit 1 Sunrise, FL | — | 1.0 | 350 | $1,000 | $2.86 | 5d | 1 | 1.46mi |
| 4001 N University Dr Sunrise, FL | — | 1.0 | 600 | $1,388 | $2.31 | 13d | 1 | 1.49mi |
HOA detail condo
- Monthly dues
- $629 · $7,548/yr
- Likely covers
- internetcablepool
- Assessments
- None detected in remarks — confirm with the listing agent.
Listing history 9 events
-
2026-04-19status Pending
-
2026-01-31$85,500 Active
-
2025-12-31historical
-
2025-04-04$99,000 Active
-
2025-04-04historical
-
2024-11-20price $107,000
-
2024-09-05price $111,000
-
2024-05-23$115,000 Active
-
1996-05-06soldstatus $17,500
ⓘ Source: listings_history table (triggers on properties + properties_extension) + one-shot
backfill from property_details.listing_events for pre-trigger history.
Tax reassessment forecast FL · Resets to sale price
- Current annual tax
- $1,455 · $121/mo
- Projected year-2 tax
- $1,455 · $121/mo
- Expected delta
- $0/yr ($0/mo · 0.0%)
ⓘ Screening estimate from a state-policy table — verify with the county assessor before closing.
Climate risk First Street
- Flood 1/10 Low FEMA zone X (shaded) · 0% chance over 30 yrs
- Wildfire 1/10 Low
- Wind 10/10 Extreme 99% chance of damaging wind over 30 yrs
- Air quality 3/10 Moderate 2 unhealthy d/yr today · 3 by 30 yrs out
Nearby sold comps map
Loading sold comps map…
Walkable amenities ~0.75 mi
Loading nearby amenities…
Taxation est. · year 1
- Rental income
- $21,115
- − Mortgage interest
- −$4,789
- − Property taxes
- −$1,455
- − Insurance
- −$428
- − Repairs & maintenance
- −$1,689
- − Management
- −$1,689
- − HOA
- −$7,548
- − Depreciation
- −$2,487
- Taxable income
- $1,030
- Est. tax owed @ 24.0%
- −$247
- After-tax cash flow
- $1,623/yr
For passive investors: Depreciation is non-cash, so a rental often shows a tax loss while cash-flowing — sheltering income. Rental losses are passive: they offset passive income freely, and up to $25,000/yr can offset ordinary (W-2) income if you actively participate and your MAGI is under $100k (phasing out to $0 by $150k); unused losses carry forward. On sale, claimed depreciation is recaptured at up to 25%, and gains may owe capital-gains tax (a 1031 exchange can defer both). Figures are a year-1 estimate at your 24.0% rate — not tax advice; consult a CPA.
Schools (NCES district)
- District
- Broward
- NCES district ID
- 1200180
- Math proficiency
- 42% ▼ -18.00%
- Reading proficiency
- 53% ▼ -5.00%
- Median HH income
- $52,139
- Composite
- 40.88/100
- National rank
- #3621
- State rank
- #46 of 73 in FL
Livability — Sunrise
- Score
- 83/100
- State rank
- #56
- US rank
- #986
Category grades
Schools grade is shown separately in the Schools card above.
Census & demographics
- Census place
- Sunrise, FL
- County
- Broward County · 1,963,430 people
- City population
- 77,492
- Metro
- Miami-Fort Lauderdale-Pompano Beach, FL
- Population (ZIP)
- 41,128
- Household income
- $71,755
- Rent vs Own
- Severe rent burden
- 931.0
Population outlook (Broward County) Hauer SSP2
- Today (2025)
- 2,207,033 people
- By 2030
- 2,360,704 · +7.0%
- By 2040
- 2,661,208 · +20.6%
- By 2050
- 2,946,698 · +33.5%
- By 2075
- 3,602,273 · +63.2%
- By 2100
- 3,970,984 · +79.9%
Race, ethnicity, and origin ACS 2023
- Neighborhood character
- Highly diverse neighborhood (Simpson 0.72)
- Race & ethnicity
- Hispanic / Latino 35% White 32% Black 24% Two or more races 22% Asian 4%
- Hispanic origin (detail)
- Puerto Rican 5% Cuban 6% Dominican 2% Salvadoran 1%
- Common ancestry
- Hispanic 5% Romanian 2% Scotch-Irish 2%
- Foreign-born
- 41% · Canada, Jamaica, South Korea
- Languages at home
- 58% English-only · Spanish 30% French/Haitian/Cajun 6% Other Indo-European 1%
Political lean MEDSL · Broward
- 2024 margin
- D (+17.0) · D 58.0% · R 41.0%
- 2008→2024 swing
- -17.8pp toward R · 2008: 34.7pp · 2024: 17.0pp
- All cycles
- 2024: D+17.0 2020: D+29.8 2016: D+35.0 2012: D+34.9 2008: D+34.7
Not yet ingested
- Civics
- —
Market trends
- HPI YoY
- ▼ -203.34%
- Current HPI
- 407.5452
- Rent YoY
- ▲ 0.60%
- Metro
- Miami-Fort Lauderdale-Pompano Beach, FL
- State GDP YoY
- ▲ 3.28%
- F500 in state
- 36
Industry mix (Fortune 500 HQ in FL)
| Industry | F500 HQs | Revenue |
|---|---|---|
| Industrial Technology | 2 | $29B |
|
||
| Insurance | 2 | $17B |
|
||
| Retail | 1 | $60B |
|
||
| Technology Distribution | 1 | $58B |
|
||
| Homebuilding | 1 | $35B |
|
||
| Technology Manufacturing | 1 | $35B |
|
||
Price history
+388.6% since first listed9 events — show timeline
- 2026-04-19 Pending — Beaches MLS
- 2026-01-31 Listed $85,500 Beaches MLS
- 2025-12-31 Listing Removed — MARMLS
- 2025-04-04 Listing Removed — MARMLS
- 2025-04-04 Listed $99,000 MARMLS
- 2024-11-20 Price Changed $107,000 MARMLS
- 2024-09-05 Price Changed $111,000 MARMLS
- 2024-05-23 Listed $115,000 MARMLS
- 1996-05-06 Sold (Public Records) $17,500 Public Records
Property tax history
+9.8%/yrLatest (2025): $1,455 · +1.1% YoY. Source: county tax records.
Cash-flow waterfall
monthlySold comps — $/sqft
last 12 mo · ≤1 miLoading sold comps…