 Triplex
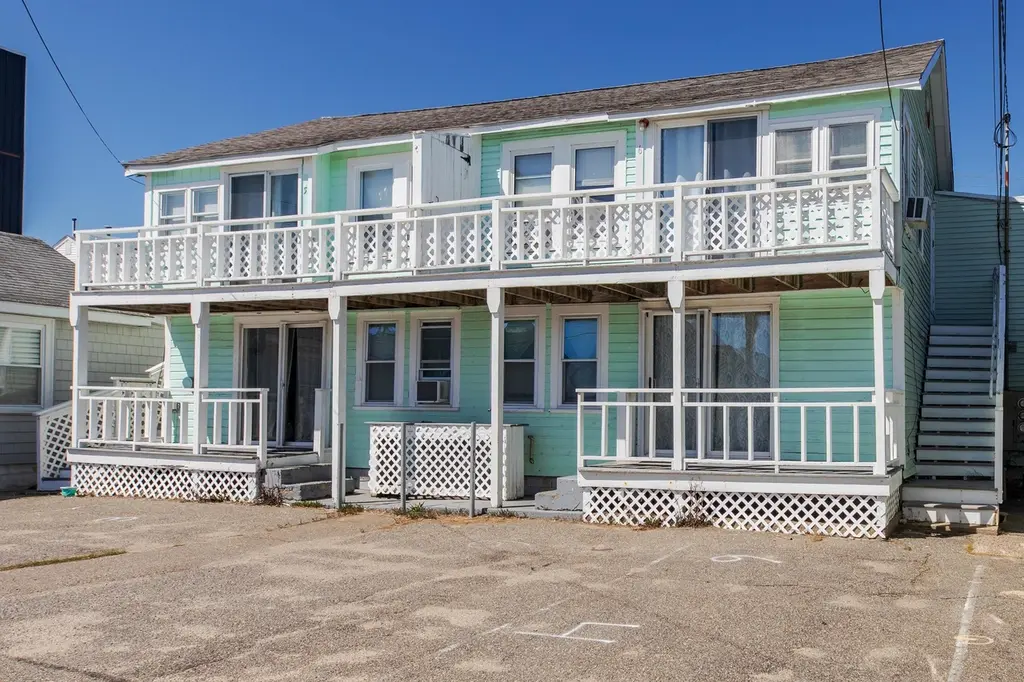
12 Manchester St · Hampton Beach, NH
Flood risk 9/10 · Severe
- FEMA flood zone
- AE
- Chance of flooding over 30 yrs
- 0.99%
- Est. flood insurance / yr
- $1,737 – $8,500
Fire risk 3/10 · Minor
- Est. fire insurance / yr
- $507 – $941
Heat risk 5/10 · Moderate
- Hot days now (above 92°F)
- 7 days/yr
- Hot days in 30 yrs
- 17 days/yr
Wind risk 8/10 · Major
- Chance of severe wind over 30 yrs
- 80.0%
Air-quality risk 2/10 · Minimal
- Unhealthy air days now
- 2 days/yr
- Unhealthy air days in 30 yrs
- 2 days/yr
Risk factors via First Street. Map © Google.
Why this score? — see what drove the D+ grade
The composite is a weighted blend of 9 inputs, each scored 0–100. Each bar is that input's sub-score; the figure is the points it added to the 100-point composite (weight × sub-score).
- Cash flow +14.5/30.0
- ARV discount +7.5/15.0
- Schools +5.1/10.0
- DSCR +4.4/10.0
- 1% rule +4.0/10.0
- Rent growth +3.6/5.0
- Livability +3.5/5.0
- Condition / age +2.5/5.0
- Appreciation +0.0/10.0
$899,000
🖨 Deal sheet (PDF) 📄 Offer letter ✓ Due diligence
Multi-family units
County records classify this as Multi-Family (2-4 Unit). Listing-text estimate: 3 units. confirmed
Listing remarks MLS
BEST DEAL ON BEACH!! 2 FAMILY CONVERTED TO 2 YR ROUND CONDOS, NO CONDO FEE, OFFERED AT 20K LESS TO BUY WHOLE BLDG, WALK TO BEACH, WHAT A DEAL!! HURRY!! OPEN HOUSE 8/3 2-4PM
Key facts
- 6,969 sq ft lot
- Built 1920
- Listed 52 days
Property features AI
Finance
- Other: Furnishings included
Exterior
- Parking: Driveway with brick/pavers and paved surfaces
- Utilities: Public water; Public sewer; Circuit breaker electrical service; Cable internet available; Internet - Cable
- Home design: Multi-family property; Converted structure; Built in 1920
- Construction: Wood frame construction; Shingle roof
- Exterior features: Level lot; Public road frontage
Interior
- Bedrooms: Four 2-bedroom units
- Flooring: Vinyl flooring
- Bathrooms: Four full bathrooms
- Heating & cooling: Electric heating; No central cooling
- Interior features: Conversion / Multi-family building; Crawl space basement; Seasonal
Neighborhood map
What this means for you Summary
Snapshot
- This is a 3 × 3-bed/?-bath units multifamily listed at $899k.
Deal economics
- At list price, monthly cash flow is $-226 ($-3k/yr) — negative. Per door: $-75/mo.
- To cash-flow at today's rent, offer at most $866k (3.6% below list).
- To meet the 1% rule (rent ≥ 1% of price), the offer needs to be $812k (9.7% below list).
- Recommended offer: $812k (9.7% below list) — sets the bar for 1% rule.
- Cap rate 6.6% vs local median 1.3% in Hampton Beach — top-decile yield for the area; either an underpriced asset or a hidden risk that comps aren't pricing in. Stress-test before assuming the spread holds.
Location & tenants
- Location reads 70/100 on livability (#48 in NH) — a middle-class / working-renter tenant base. Strengths: crime A+, health & safety A+, employment B+; Watch: amenities F, commute D-, cost of living F.
- Hampton School District (suburban): math 49% / reading 66% proficiency, ranked #19 of 98 in NH (top 19%) — acceptable for families but not a draw, mixed tenant base, ~2y average lease; only 15% free/reduced lunch — higher-income household profile.
- Zoned schools: Adeline C. Marston School (math 59% / reading 66%, grade B, #31 of 263 statewide, top 12%, 311 students, 15% FRL); Hampton Academy (math 41% / reading 66%, grade C+, #16 of 96 statewide, top 16%, 333 students, 16% FRL); Winnacunnet High School (math 43% / reading 63%, grade C-, #28 of 90 statewide, top 30%, 1,063 students, 17% FRL) — zoned schools at 16% FRL track the district average.
- Market conditions: Rents rising fast (+4.3%/yr); 117 active listings in the ZIP; solid renter incomes; 1,276 units permitted in Rockingham County in 2024 (593 in 5+ unit buildings).
- At $8,118/mo this rent would consume 102% of the median local household income ($95k/yr) (locally 544% of renters already pay >50% of income on rent) — very limited rent-growth headroom before tenants either downsize or default.
Forward outlook
- Local home prices are declining (-3.0%/yr); year-one equity from $6k of loan paydown is wiped out by about $27k of value loss. Plan a longer hold.
Negotiation context
- It's been on market 52 days — a 3% lower offer ($872k) is reasonable based on typical stale-listing flexibility.
- 2 sale attempts since 23y ago with the ask held roughly flat each time — persistent listings suggest the price (not the market) is what's stuck; bring a comps-based counter.
- Current owner paid $150k; list at $899k implies a 499% gain — meaningful room to come down on a strong offer.
Risks & watch-outs
- Watch-outs: flood insurance adds $427/mo; built in 1920 — expect roof / HVAC / electrical / plumbing capex.
- Climate carrying-cost: in FEMA flood zone AE (mandatory federal flood insurance); severe wind risk, 80% chance of damaging wind over 30y; extreme-heat days projected 7→17/yr by 2055 (HVAC capex compounding) — expect insurance premiums to compound above CPI over the hold.
Questions for the listing agent
- What do current leases actually rent for vs. the listed asking? Can we see a recent rent roll and the last 12 months of T-12 income?
- It's been on market 52 days. Have you received any prior offers? Is the seller open to a 10% concession, seller financing, or rate buy-down credit?
- Can we see the unit-by-unit rent roll, current vacancy, and any below-market leases? What's the average tenancy length?
- What capital expenditures (roof, boiler, parking lot, exteriors) have been made in the last 5 years, and what's planned in the next 2?
- Built in 1920 — when were the roof, HVAC, electrical panel, plumbing, and water heater last replaced?
- What's the actual annual flood-insurance premium (NFIP or private), and is the property in a SFHA with mandatory coverage?
- Is there a deadline driving the sale (1031 exchange, divorce, estate, relocation)? That informs how much negotiation room exists.
- Schools are D-rated, which usually means shorter tenancies and higher turnover. Who's the typical renter profile here, and what's been the actual vacancy rate?
- The area grade is low — what's the realistic commute time and amenity access for the typical tenant pool here? Any planned neighborhood developments (good or bad) we should know about?
- What's the average days-on-market for RENTAL listings here right now (not sales)? A rising rental-DOM trend means longer vacancies and softer asking-rent achievability than the comps imply.
- What's the recent tenant-quality profile in this submarket — average credit score on applications, eviction rate, late-payment / NSF rate, and stable-employment percentage? A property-management company in the area should have these aggregated.
- How much new apartment / multifamily construction is in the pipeline within 1–3 miles? Heavy new supply (>2% of stock underway) typically softens rents 12–24 months out; light construction supports rent growth.
Investment metrics
- 1% rule
- 0.90% ✗
- Cap rate
- 6.56%
- Cash-on-cash
- 0.96%
- DSCR
- 1.04
- GRM
- 9.2
CMA / ARV
No comps found within radius.
Show comp detail 1 sale within ~0.75 mi
| Address | Dist | Beds/Ba | Sqft | Sold | Price | $/sf | Match |
|---|---|---|---|---|---|---|---|
| 107 -109 Ashworth Ave | 0.05mi | 8/4.0 (-1) | 2,622 | 24mo | $705,000 | $269 | 60 |
Match score weights: distance 35% · size 25% · config 20% · recency 20%. Top-matched comps best support the ARV.
Projected returns pro-forma
-3.0% appreciation · 4.35% rent growth · sell at horizon
- IRR
- -16.4%
- Equity multiple
- 0.41×
- Total profit
- $-148,518
- Equity at exit
- $134,044
- IRR
- -5.7%
- Equity multiple
- 0.61×
- Total profit
- $-99,173
- Equity at exit
- $77,729
Cash invested: $251,720 (down + closing). Projections, not guarantees.
Landlord ↔ Tenant lean methodology
- Overall (STATE)
- 56 Moderately Landlord-Leaning
- State New Hampshire
- 56 Moderately Landlord-Leaning · D+1
- County
- — inherits STATE
- City
- — inherits STATE
ZIP-level market 03842
- Rents YoY
- 4.3%
- Active inventory
- 117
- Price-to-rent
- 27.7×
Monthly cashflow live
- Estimated rent
- $8,118 high interval (Pro) →
- Mortgage (P&I)
- −$4,714
- Tax est. 1.5%
- −$1,124 /mo · $13,485/yr
- Insurance
- −$375
- Flood insurance flood zone
- −$427 /mo · $5,118/yr
- HOA
- −$0
- Vacancy / Maint / Mgmt
- −$1,705
- Net cashflow
- $-226
Break-even live
Sensitivity live
| Price | -10% $395 | -5% $85 | +0% $-226 | +5% $-537 | +10% $-847 |
|---|---|---|---|---|---|
| Rent | -10% $-867 | -5% $-547 | +0% $-226 | +5% $95 | +10% $415 |
| Rate | -1.0pp $227 | -0.5pp $3 | base $-226 | +0.5pp $-459 | +1.0pp $-696 |
3-unit breakdown (identical units grouped — click to expand)
| Units | Beds | Baths | Est. rent |
|---|---|---|---|
| 3× units | 3 | — | $8,118 |
| #1 | 3 | — | $2,706 |
| #2 | 3 | — | $2,706 |
| #3 | 3 | — | $2,706 |
| Total (3 units) | $8,118 | ||
UW: 25.0% down · 7.5% · 30yr · 1.5% tax · 5.0% vac · 8.0% maint · 8.0% mgmt
Financing live
Cash to close
- Down payment
- $224,750
- Closing costs
- $26,970
- Reserves months
- —
- Total cash needed
- —
Loan-product check · same deal, 3 products live
Conventional
25% down · 7.5% · 30yr
- Down + closing
- —
- Monthly P&I
- —
- Monthly cashflow
- —
- DSCR
- —
- Eligible?
- —
Personal DTI + credit; lowest rate.
DSCR
20% down · 8.5% · 30yr
- Down + closing
- —
- Monthly P&I
- —
- Monthly cashflow
- —
- DSCR
- —
- Eligible?
- —
No personal income docs; deal must DSCR.
Hard money
10% down · 12.0% · 12mo
- Down + closing
- —
- Monthly P&I
- —
- Monthly cashflow
- —
- DSCR
- —
- Eligible?
- —
Short-term bridge; refi at stabilization.
Listing history 18 events
-
2026-06-21days on market $899,000 Active 52 DOM
-
2026-06-18days on market $899,000 Active 49 DOM
-
2026-06-17days on market $899,000 Active 48 DOM
-
2026-06-16days on market $899,000 Active 47 DOM
-
2026-06-15days on market $899,000 Active 46 DOM
-
2026-06-13days on market $899,000 Active 44 DOM
-
2026-06-09days on market $899,000 Active 40 DOM
-
2026-06-08days on market $899,000 Active 39 DOM
-
2026-06-07days on market $899,000 Active 38 DOM
-
2026-06-04days on market $899,000 Active 35 DOM
-
2026-06-03days on market $899,000 Active 34 DOM
-
2026-06-02days on market $899,000 Active 33 DOM
-
2026-06-01days on market $899,000 Active 32 DOM
-
2026-05-31days on market $899,000 Active 31 DOM
-
2026-04-30$899,000 Active
-
2003-09-17soldstatus $150,000 172-char remark
Show marketing remark (172 chars)
BEST DEAL ON BEACH!! 2 FAMILY CONVERTED TO 2 YR ROUND CONDOS, NO CONDO FEE, OFFERED AT 20K LESS TO BUY WHOLE BLDG, WALK TO BEACH, WHAT A DEAL!! HURRY!! OPEN HOUSE 8/3 2-4PM
-
2003-08-07historical 172-char remark
Show marketing remark (172 chars)
BEST DEAL ON BEACH!! 2 FAMILY CONVERTED TO 2 YR ROUND CONDOS, NO CONDO FEE, OFFERED AT 20K LESS TO BUY WHOLE BLDG, WALK TO BEACH, WHAT A DEAL!! HURRY!! OPEN HOUSE 8/3 2-4PM
-
2003-07-10$178,900 172-char remark
Show marketing remark (172 chars)
BEST DEAL ON BEACH!! 2 FAMILY CONVERTED TO 2 YR ROUND CONDOS, NO CONDO FEE, OFFERED AT 20K LESS TO BUY WHOLE BLDG, WALK TO BEACH, WHAT A DEAL!! HURRY!! OPEN HOUSE 8/3 2-4PM
ⓘ Source: listings_history table (triggers on properties + properties_extension) + one-shot
backfill from property_details.listing_events for pre-trigger history.
Climate risk First Street
- Flood 9/10 Extreme FEMA zone AE · 99% chance over 30 yrs
- Wildfire 3/10 Moderate
- Heat 5/10 Major 7 d/yr ≥92°F today · 17 d/yr by 30 yrs out
- Wind 8/10 Severe 80% chance of damaging wind over 30 yrs
- Air quality 2/10 Low 2 unhealthy d/yr today · 2 by 30 yrs out
Nearby sold comps map
Loading sold comps map…
Walkable amenities ~0.75 mi
Loading nearby amenities…
Taxation est. · year 1
- Rental income
- $97,416
- − Mortgage interest
- −$50,358
- − Property taxes
- −$13,485
- − Insurance
- −$9,614
- − Repairs & maintenance
- −$7,793
- − Management
- −$7,793
- − Depreciation
- −$26,153
- Taxable loss
- −$17,780
- Est. tax savings @ 24.0%
- +$4,267
- After-tax cash flow
- $1,554/yr
For passive investors: Depreciation is non-cash, so a rental often shows a tax loss while cash-flowing — sheltering income. Rental losses are passive: they offset passive income freely, and up to $25,000/yr can offset ordinary (W-2) income if you actively participate and your MAGI is under $100k (phasing out to $0 by $150k); unused losses carry forward. On sale, claimed depreciation is recaptured at up to 25%, and gains may owe capital-gains tax (a 1031 exchange can defer both). Figures are a year-1 estimate at your 24.0% rate — not tax advice; consult a CPA.
Schools (NCES district)
- District
- Hampton School District
- NCES district ID
- 3303510
- Math proficiency
- 49% ▼ -22.00%
- Reading proficiency
- 66% ▼ -9.00%
- Median HH income
- $71,924
- Composite
- 51.03/100
- National rank
- #1774
- State rank
- #19 of 98 in NH
Livability — Hampton Beach
- Score
- 70/100
- State rank
- #48
- US rank
- #8000
Category grades
Schools grade is shown separately in the Schools card above.
Census & demographics
- Census place
- Hampton Beach, NH
- County
- Rockingham County · 137,526 people
- Metro
- Boston-Cambridge-Newton, MA-NH
- Population (ZIP)
- 16,324
- Household income
- $95,422
- Rent vs Own
- Severe rent burden
- 544.0
Population outlook (Rockingham County) Hauer SSP2
- Today (2025)
- 316,118 people
- By 2030
- 320,929 · +1.5%
- By 2040
- 323,358 · +2.3%
- By 2050
- 314,977 · -0.4%
- By 2075
- 297,686 · -5.8%
- By 2100
- 256,363 · -18.9%
Race, ethnicity, and origin ACS 2023
- Neighborhood character
- Predominantly White (95%)
- Race & ethnicity
- White 95% Two or more races 2% Hispanic / Latino 1% Asian 1%
- Common ancestry
- Lithuanian 10% Romanian 6% Slovak 4%
- Foreign-born
- 3% · Canada
- Languages at home
- 97% English-only · Spanish 1%
Political lean MEDSL · Rockingham
- 2024 margin
- Toss-up / Even · D 48.3% · R 50.8%
- 2008→2024 swing
- -3.5pp toward R · 2008: 1.1pp · 2024: -2.4pp
- All cycles
- 2024: R+2.4 2020: D+2.1 2016: R+5.8 2012: R+4.5 2008: D+1.1
Not yet ingested
- Civics
- —
Market trends
- HPI YoY
- ▼ -219.75%
- Current HPI
- 339.3943
- Rent YoY
- ▲ 4.35%
- Metro
- Boston-Cambridge-Newton, MA-NH
- State GDP YoY
- —
- F500 in state
- 0
Price history
+402.5% since first listed4 events — show timeline
- 2026-04-30 Listed $899,000 PrimeMLS
- 2003-09-17 Sold (MLS) $150,000 PrimeMLS
- 2003-08-07 Delisted — PrimeMLS
- 2003-07-10 Listed $178,900 PrimeMLS
Cash-flow waterfall
monthlySold comps — $/sqft
last 12 mo · ≤1 miLoading sold comps…