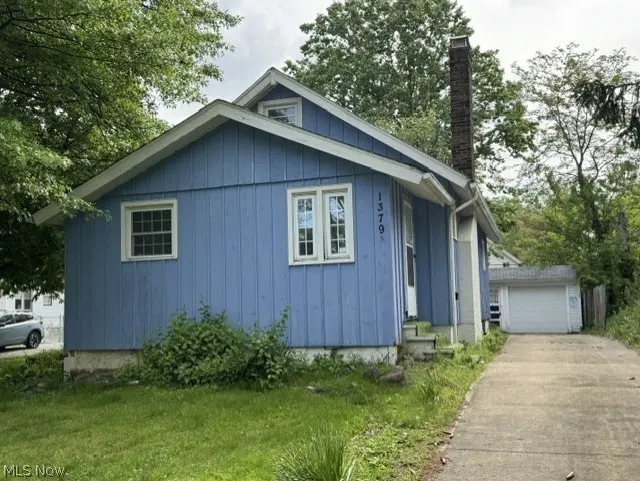
1379 E 219th St · Euclid, OH
Flood risk 8/10 · Major
- FEMA flood zone
- X (unshaded)
- Chance of flooding over 30 yrs
- 0.99%
- Est. flood insurance / yr
- $473 – $860
Fire risk 1/10 · Minimal
- Est. fire insurance / yr
- $713 – $1,323
Heat risk 3/10 · Minor
- Hot days now (above 94°F)
- 7 days/yr
- Hot days in 30 yrs
- 16 days/yr
Wind risk 1/10 · Minimal
- Chance of severe wind over 30 yrs
- —
Air-quality risk 3/10 · Minor
- Unhealthy air days now
- 3 days/yr
- Unhealthy air days in 30 yrs
- 4 days/yr
Risk factors via First Street. Map © Google.
Why this score? — see what drove the B+ grade
The composite is a weighted blend of 9 inputs, each scored 0–100. Each bar is that input's sub-score; the figure is the points it added to the 100-point composite (weight × sub-score).
- Cash flow +30.0/30.0
- ARV discount +15.0/15.0
- 1% rule +10.0/10.0
- DSCR +10.0/10.0
- Livability +3.9/5.0
- Rent growth +2.5/5.0
- Condition / age +2.5/5.0
- Schools +1.7/10.0
- Appreciation +0.0/10.0
$74,900
🖨 Deal sheet (PDF) 📄 Offer letter ✓ Due diligence
Listing remarks
Check out this investment opportunity in this Euclid ranch home. This home features two bedrooms, a formal living room and formal dining room. This home also features a large enclosed rear porch for additional entertainment space. This home does need repairs but offers so much potential for a savvy buyer. The seller makes no representations or warranties about the condition of this home and it is to be sold in as is condition.
Key facts
- Formal dining room
- Enclosed rear porch
- Formal living room
Tags
Property features AI
Exterior
- Parking: Detached garage (1 car)
- Utilities: Public water; Public sewer
- Home design: Single-story home; Block foundation
- Construction: Wood siding; Asphalt/fiberglass roof; Built per public records
- Exterior features: Lot dimensions approximately 40 x 131; Faces west
Interior
- Bedrooms: Two main-level bedrooms
- Bathrooms: One full bathroom (main level)
- Heating & cooling: Forced-air gas heating
- Interior features: Unfinished basement; One fireplace
Neighborhood map
What this means for you Summary
Snapshot
- This is a 2-bed/1.0-bath single-family listed at $75k.
Deal economics
- At list price, monthly cash flow is $384 ($5k/yr) — positive.
- The deal already cash-flows at list — no discount required.
- Meets the 1% rule at list price ($1k rent vs $75k).
- Recommended offer: $74k (1.5% below list) — sets the bar for market timing.
- Cap rate 13.3% vs local median 6.8% in Euclid — top-decile yield for the area; either an underpriced asset or a hidden risk that comps aren't pricing in. Stress-test before assuming the spread holds.
Location & tenants
- Location reads 77/100 on livability (#204 in OH, #3,149 nationally) — a middle-class / working-renter tenant base. Strengths: cost of living A+, housing A+, crime B+; Watch: schools C-, commute F, employment D-.
- Euclid City (suburban): math 14% / reading 28% proficiency, ranked #625 of 656 in OH (top 95%) — low school quality limits family demand, transient renter base, plan for 1-2y turnover; 70% free/reduced lunch — lower-income household profile, screen leases tightly.
- Market conditions: 33 active listings in the ZIP; 26 comparable units currently listed for rent nearby; rentals at typical pace (median 25d on market — plan ~3-4 weeks tenant-placement turnaround); lower-income renter base — watch delinquency; 1,441 units permitted in Cuyahoga County in 2024 (700 in 5+ unit buildings).
- This rent runs 34% of the median local income ($43k/yr) — at the standard rent-burdened threshold; future hikes will face affordability resistance.
Forward outlook
- Local home prices are declining (-3.0%/yr); year-one equity from $518 of loan paydown is wiped out by about $2k of value loss. Plan a longer hold.
- Cuyahoga County population projected to shrink 8% by 2050 — rents likely to lag national; underwrite the cash flow, not the appreciation.
- At projected returns (-3.0% appreciation + 3.0% rent growth), your $21k cash investment doubles in ~6 years — after that, you're playing with house money.
Negotiation context
- It's been on market 28 days — a 2% lower offer ($74k) is reasonable based on typical stale-listing flexibility.
Risks & watch-outs
- Watch-outs: flood insurance adds $56/mo; built in 1938 — expect roof / HVAC / electrical / plumbing capex.
- Climate carrying-cost: severe flood risk — expect insurance premiums to compound above CPI over the hold.
Questions for the listing agent
- Built in 1938 — when were the roof, HVAC, electrical panel, plumbing, and water heater last replaced?
- What's the actual annual flood-insurance premium (NFIP or private), and is the property in a SFHA with mandatory coverage?
- Is there a deadline driving the sale (1031 exchange, divorce, estate, relocation)? That informs how much negotiation room exists.
- What's the average days-on-market for RENTAL listings here right now (not sales)? A rising rental-DOM trend means longer vacancies and softer asking-rent achievability than the comps imply.
- What's the recent tenant-quality profile in this submarket — average credit score on applications, eviction rate, late-payment / NSF rate, and stable-employment percentage? A property-management company in the area should have these aggregated.
- How much new for-sale + rental construction is in the pipeline within 1–3 miles? Heavy new supply typically softens prices + rents 12–24 months out; constrained supply supports both.
Investment metrics
- 1% rule
- 1.63% ✓
- Cap rate
- 13.34%
- Cash-on-cash
- 25.17%
- DSCR
- 2.12
- GRM
- 5.1
CMA / ARV
- ARV (on-the-fly)
- $141,034
- Comps found
- 5
Show comp detail 5 sales within ~0.75 mi
| Address | Dist | Beds/Ba | Sqft | Sold | Price | $/sf | Match |
|---|---|---|---|---|---|---|---|
| 1375 E 219th St | 0.01mi | 2/1.0 | 898 (-4%) | 18mo | $100,000 | $111 | 78 |
| 22409 Coulter Ave | 0.17mi | 2/1.0 | 924 (-1%) | 20mo | $84,000 | $91 | 74 |
| 1530 E 219th St | 0.21mi | 2/1.0 | 840 (-10%) | 13mo | $138,000 | $164 | 62 |
| 22581 Chardon Rd | 0.62mi | 2/1.0 | 928 (-1%) | 19mo | $140,000 | $151 | 55 |
| 1975 E 226th St | 0.70mi | 2/1.0 | 900 (-4%) | 11mo | $176,000 | $196 | 52 |
Match score weights: distance 35% · size 25% · config 20% · recency 20%. Top-matched comps best support the ARV.
Projected returns pro-forma
-3.0% appreciation · 3.0% rent growth · sell at horizon
- IRR
- 14.7%
- Equity multiple
- 1.59×
- Total profit
- $12,401
- Equity at exit
- $11,168
- IRR
- 23.5%
- Equity multiple
- 3.03×
- Total profit
- $42,550
- Equity at exit
- $6,476
Cash invested: $20,972 (down + closing). Projections, not guarantees.
Landlord ↔ Tenant lean methodology
- Overall (STATE)
- 73 Landlord-Friendly
- State Ohio
- 73 Landlord-Friendly · R+6
- County
- — inherits STATE
- City
- — inherits STATE
ZIP-level market 44117
- Home prices YoY
- -9.8%
- Active inventory
- 33
- Price-to-rent
- 5.1×
Monthly cashflow live
- Estimated rent
- $1,219 high interval (Pro) →
- Mortgage (P&I)
- −$393
- Tax from tax record
- −$99 /mo · $1,188/yr
- Insurance
- −$31
- Flood insurance flood zone
- −$56 /mo · $666/yr
- HOA
- −$0
- Vacancy / Maint / Mgmt
- −$256
- Net cashflow
- $384
Break-even live
Sensitivity live
| Price | -10% $427 | -5% $406 | +0% $384 | +5% $363 | +10% $342 |
|---|---|---|---|---|---|
| Rent | -10% $288 | -5% $336 | +0% $384 | +5% $433 | +10% $481 |
| Rate | -1.0pp $422 | -0.5pp $403 | base $384 | +0.5pp $365 | +1.0pp $345 |
UW: 25.0% down · 7.5% · 30yr · 1.5% tax · 5.0% vac · 8.0% maint · 8.0% mgmt
Financing live
Cash to close
- Down payment
- $18,725
- Closing costs
- $2,247
- Reserves months
- —
- Total cash needed
- —
Loan-product check · same deal, 3 products live
Conventional
25% down · 7.5% · 30yr
- Down + closing
- —
- Monthly P&I
- —
- Monthly cashflow
- —
- DSCR
- —
- Eligible?
- —
Personal DTI + credit; lowest rate.
DSCR
20% down · 8.5% · 30yr
- Down + closing
- —
- Monthly P&I
- —
- Monthly cashflow
- —
- DSCR
- —
- Eligible?
- —
No personal income docs; deal must DSCR.
Hard money
10% down · 12.0% · 12mo
- Down + closing
- —
- Monthly P&I
- —
- Monthly cashflow
- —
- DSCR
- —
- Eligible?
- —
Short-term bridge; refi at stabilization.
Rent comps 26 comps
| Address | Beds | Baths | Sqft | Rent | $/sqft | DOM | Units | Dist |
|---|---|---|---|---|---|---|---|---|
| 22250 Euclid Ave Euclid, OH | 1.0 | 1.0 | 695 | $995 | $1.43 | 24d | 2 | 0.33mi |
| 22140 Euclid Ave Euclid, OH | 1.0 | 1.0 | 675 | $929 | $1.38 | 44d | 3 | 0.33mi |
| 22550 Euclid Ave Unit 212 Euclid, OH | 1.0 | 1.0 | 548 | $1,000 | $1.82 | 44d | 1 | 0.35mi |
| 22550 Euclid Ave Unit 207 Euclid, OH | 2.0 | 1.0 | 888 | $1,279 | $1.44 | 44d | 1 | 0.35mi |
| 21253 Chardon Rd Unit 203 Euclid, OH | 1.0 | 1.0 | 800 | $995 | $1.24 | 24d | 1 | 0.50mi |
| 4 Gateway Dr Euclid, OH | 2.0 | 1.0–2.0 | 650 | $1,150 | $1.77 | 8d | 5 | 0.72mi |
| 871 E 212th St Cleveland, OH | 3.0 | 1.5 | 1092 | $1,399 | $1.28 | 44d | 1 | 0.74mi |
| 24130 Euclid Ave Euclid, OH | 2.0 | 1.0 | 725 | $1,200 | $1.66 | 17d | 2 | 0.78mi |
| 927 E 216th St Unit 1 Euclid, OH | 2.0 | 1.0 | 850 | $1,147 | $1.35 | 5d | 1 | 0.79mi |
| 20664 Miller Ave Unit Down Unit Euclid, OH | 3.0 | 2.0 | 1100 | $1,200 | $1.09 | 44d | 1 | 0.93mi |
| 961 E 224th St Euclid, OH | 3.0 | 1.0 | 1034 | $1,300 | $1.26 | 17d | 1 | 0.95mi |
| 24630 Euclid Ave Euclid, OH | 2.0 | 1.0 | 750 | $1,100 | $1.47 | 11d | 1 | 0.99mi |
| 20051 Green Oak Dr Euclid, OH | 3.0 | 1.5 | 1092 | $1,550 | $1.42 | 15d | 1 | 1.03mi |
| 22501 Arms Ave Euclid, OH | 3.0 | 1.0 | 1044 | $1,350 | $1.29 | 24d | 1 | 1.11mi |
| 21301 Arbor Ave Euclid, OH | 3.0 | 1.0 | 1050 | $1,450 | $1.38 | 20d | 1 | 1.12mi |
| 19750 Euclid Ave Euclid, OH | 1.0–3.0 | 1.0–1.5 | 840 | $1,172 | $1.40 | 17d | 3 | 1.12mi |
| 19430 Monterey Ave Cleveland, OH | 3.0 | 1.5 | 898 | $1,236 | $1.38 | 22d | 1 | 1.28mi |
| 20990 Morris Ave Euclid, OH | 3.0 | 1.0 | 778 | $1,355 | $1.74 | 44d | 1 | 1.31mi |
| 455 E 200th St Cleveland, OH | 2.0 | 1.0 | 950 | $1,150 | $1.21 | 24d | 1 | 1.34mi |
| 20500 Morris Ave Euclid, OH | 3.0 | 1.0 | 1104 | $1,399 | $1.27 | 44d | 1 | 1.36mi |
| 404 E 200th St Cleveland, OH | 2.0 | 1.0 | 884 | $1,095 | $1.24 | 44d | 1 | 1.44mi |
| 1541 E 191st St Euclid, OH | 2.0 | 1.0–1.5 | 624 | $925 | $1.48 | 44d | 1 | 1.45mi |
| 1554 E 256th St Euclid, OH | 2.0 | 2.0 | 1062 | $1,250 | $1.18 | 24d | 1 | 1.45mi |
| 1550 E 256th St Euclid, OH | 3.0 | 1.0 | 1054 | $1,700 | $1.61 | 2d | 1 | 1.46mi |
| 19205 Pasnow Ave Euclid, OH | 3.0 | 1.0 | 698 | $1,575 | $2.26 | 2d | 1 | 1.46mi |
| 824 E 236th St Euclid, OH | 3.0 | 2.0 | 1100 | $1,720 | $1.56 | 2d | 1 | 1.49mi |
Listing history 14 events
-
2026-06-18days on market $74,900 Active 28 DOM
-
2026-06-17days on market $74,900 Active 27 DOM
-
2026-06-16days on market $74,900 Active 26 DOM
-
2026-06-15days on market $74,900 Active 25 DOM
-
2026-06-13days on market $74,900 Active 23 DOM
-
2026-06-09days on market $74,900 Active 19 DOM
-
2026-06-08days on market $74,900 Active 18 DOM
-
2026-06-07days on market $74,900 Active 17 DOM
-
2026-06-05days on market $74,900 Active 14 DOM
-
2026-06-03days on market $74,900 Active 13 DOM
-
2026-06-02days on market $74,900 Active 12 DOM
-
2026-06-01days on market $74,900 Active 11 DOM
-
2026-05-31days on market $74,900 Active 10 DOM
-
2026-05-20$74,900 Active
ⓘ Source: listings_history table (triggers on properties + properties_extension) + one-shot
backfill from property_details.listing_events for pre-trigger history.
Tax reassessment forecast OH · Partial reset (capped growth)
- Current annual tax
- $1,188 · $99/mo
- Projected year-2 tax
- $1,188 · $99/mo
- Expected delta
- $0/yr ($0/mo · 0.0%)
ⓘ Screening estimate from a state-policy table — verify with the county assessor before closing.
Climate risk First Street
- Flood 8/10 Severe FEMA zone X (unshaded) · 99% chance over 30 yrs
- Wildfire 1/10 Low
- Heat 3/10 Moderate 7 d/yr ≥94°F today · 16 d/yr by 30 yrs out
- Wind 1/10 Low
- Air quality 3/10 Moderate 3 unhealthy d/yr today · 4 by 30 yrs out
Nearby sold comps map
Loading sold comps map…
Walkable amenities ~0.75 mi
Loading nearby amenities…
Taxation est. · year 1
- Rental income
- $14,627
- − Mortgage interest
- −$4,196
- − Property taxes
- −$1,188
- − Insurance
- −$1,041
- − Repairs & maintenance
- −$1,170
- − Management
- −$1,170
- − Depreciation
- −$2,179
- Taxable income
- $3,683
- Est. tax owed @ 24.0%
- −$884
- After-tax cash flow
- $3,729/yr
For passive investors: Depreciation is non-cash, so a rental often shows a tax loss while cash-flowing — sheltering income. Rental losses are passive: they offset passive income freely, and up to $25,000/yr can offset ordinary (W-2) income if you actively participate and your MAGI is under $100k (phasing out to $0 by $150k); unused losses carry forward. On sale, claimed depreciation is recaptured at up to 25%, and gains may owe capital-gains tax (a 1031 exchange can defer both). Figures are a year-1 estimate at your 24.0% rate — not tax advice; consult a CPA.
Schools (NCES district)
- District
- Euclid City
- NCES district ID
- 3904395
- Math proficiency
- 14% ▼ -19.00%
- Reading proficiency
- 28% ▼ -14.00%
- Median HH income
- $36,385
- Composite
- 17.39/100
- National rank
- #9067
- State rank
- #625 of 656 in OH
Livability — Euclid
- Score
- 77/100
- State rank
- #204
- US rank
- #3149
Category grades
Schools grade is shown separately in the Schools card above.
Census & demographics
- Census place
- Euclid, OH
- County
- Cuyahoga County · 1,090,369 people
- City population
- 41,855
- Metro
- Cleveland-Elyria, OH
- Population (ZIP)
- 9,172
- Household income
- $43,013
- Rent vs Own
- Severe rent burden
- 970.0
Population outlook (Cuyahoga County) Hauer SSP2
- Today (2025)
- 1,244,621 people
- By 2030
- 1,230,093 · -1.2%
- By 2040
- 1,189,108 · -4.5%
- By 2050
- 1,145,706 · -7.9%
- By 2075
- 1,076,557 · -13.5%
- By 2100
- 978,987 · -21.3%
Race, ethnicity, and origin ACS 2023
- Neighborhood character
- Predominantly Black (71%)
- Race & ethnicity
- Black 71% White 22% Two or more races 4% Hispanic / Latino 3%
- Common ancestry
- Lithuanian 2% Romanian 1% Serbian 1%
- Foreign-born
- 2%
- Languages at home
- 96% English-only · Spanish 2% French/Haitian/Cajun 1% Tagalog/Filipino 1%
Political lean MEDSL · Cuyahoga
- 2024 margin
- Solid D (+31.5) · D 65.4% · R 33.9%
- 2008→2024 swing
- -7.4pp toward R · 2008: 38.9pp · 2024: 31.5pp
- All cycles
- 2024: D+31.5 2020: D+34.1 2016: D+35.0 2012: D+38.7 2008: D+38.9
Not yet ingested
- Civics
- —
Market trends
- HPI YoY
- ▼ -23.42%
- Current HPI
- 214.6784
- Rent YoY
- —
- Metro
- Cleveland-Elyria, OH
- State GDP YoY
- ▲ 1.98%
- F500 in state
- 48
Industry mix (Fortune 500 HQ in OH)
| Industry | F500 HQs | Revenue |
|---|---|---|
| Insurance | 3 | $145B |
|
||
| Industrial Machinery | 3 | $49B |
|
||
| Financial Services | 3 | $24B |
|
||
| Consumer Goods | 2 | $93B |
|
||
| Aerospace / Defense | 2 | $47B |
|
||
| Utilities | 2 | $33B |
|
||
Price history
1 event — show timeline
- 2026-05-20 Listed $74,900 MLSNOW
Property tax history
+5.9%/yrLatest (2025): $1,188 · -9.8% YoY. Source: county tax records.
Cash-flow waterfall
monthlySold comps — $/sqft
last 12 mo · ≤1 miLoading sold comps…