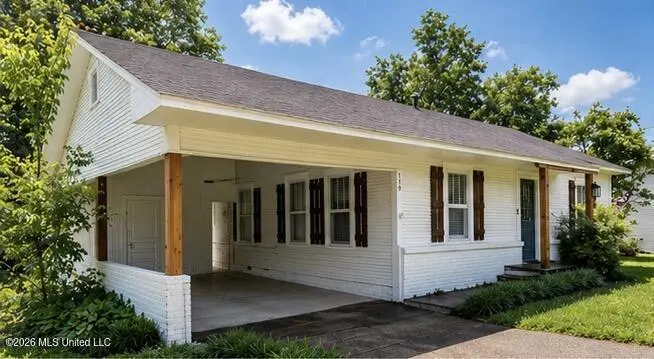
119 S Mcsweyn Pl · Bruce, MS
Flood risk 1/10 · Minimal
- FEMA flood zone
- X (unshaded)
- Chance of flooding over 30 yrs
- 0.0%
- Est. flood insurance / yr
- $507 – $1,088
Fire risk 4/10 · Minor
- Est. fire insurance / yr
- $1,241 – $2,305
Heat risk 7/10 · Major
- Hot days now (above 109°F)
- 7 days/yr
- Hot days in 30 yrs
- 21 days/yr
Wind risk 6/10 · Moderate
- Chance of severe wind over 30 yrs
- 27.0%
Air-quality risk 2/10 · Minimal
- Unhealthy air days now
- 0 days/yr
- Unhealthy air days in 30 yrs
- 1 days/yr
Risk factors via First Street. Map © Google.
Why this score? — see what drove the C+ grade
The composite is a weighted blend of 9 inputs, each scored 0–100. Each bar is that input's sub-score; the figure is the points it added to the 100-point composite (weight × sub-score).
- Cash flow +26.0/30.0
- DSCR +8.7/10.0
- ARV discount +7.5/15.0
- Appreciation +6.2/10.0
- 1% rule +5.8/10.0
- Livability +3.2/5.0
- Rent growth +2.5/5.0
- Condition / age +2.5/5.0
- Schools +2.3/10.0
$109,500
🖨 Deal sheet (PDF) 📄 Offer letter ✓ Due diligence
Listing remarks
Charming 1927 home featuring updated flooring and a refreshed kitchen, blending classic character with modern touches. Offers spacious rooms and is located in a quiet, established neighborhood. Property is being sold as-is, with lender-required repairs only. Seller is motivated and ready to make a deal. Must see—don't miss this opportunity!
Key facts
- 0.4 acre lot
- Parking
- Built 1927
Property features AI
Exterior
- Parking: Carport (1 space)
- Utilities: Public water; Public sewer; Electricity connected
- Home design: Single family residence (house); One story; Move-in ready
- Construction: Wood siding; Raised foundation; Architectural shingle roof; Built (year per public records)
- Exterior features: Barn(s)
Interior
- Kitchen: Electric range
- Bedrooms: One-level layout
- Bathrooms: 1 full bathroom
- Heating & cooling: Central heating; Ceiling fan(s)
- Interior features: Electric range; Ceiling fan(s)
Neighborhood map
What this means for you Summary
Snapshot
- This is a 3-bed/1.0-bath single-family listed at $110k.
Deal economics
- At list price, monthly cash flow is $272 ($3k/yr) — positive.
- The deal already cash-flows at list — no discount required.
- Meets the 1% rule at list price ($1k rent vs $110k).
- Recommended offer: $108k (1.5% below list) — sets the bar for market timing.
Location & tenants
- Location reads 63/100 on livability (#147 in MS) — a middle-class / working-renter tenant base. Strengths: cost of living A+, housing A+; Watch: schools D+, health & safety D+, amenities F.
- Calhoun County School District (rural): math 28% / reading 29% proficiency, ranked #75 of 130 in MS (top 58%) — low school quality limits family demand, transient renter base, plan for 1-2y turnover; 69% free/reduced lunch — lower-income household profile, screen leases tightly.
- Market conditions: 25 active listings in the ZIP; 10 units permitted in Calhoun County in 2024 (0 in 5+ unit buildings).
Forward outlook
- In year one you build about $3k of equity ($757 loan paydown + $3k appreciation (2.4% local appreciation)).
- Calhoun County population projected at -19% by 2050 — secular population decline; favor cash flow + early exit over multi-decade hold.
- At projected returns (2.4% appreciation + 3.0% rent growth), your $31k cash investment doubles in ~5 years — after that, you're playing with house money.
- By year 10, paydown + projected appreciation supports a ~$33k cash-out refi (75% LTV) — recoverable capital for the next deal without selling this one.
Negotiation context
- It's been on market 25 days — a 2% lower offer ($108k) is reasonable based on typical stale-listing flexibility.
- 6 sale attempts; this cycle's ask has dropped $16k (12%) from the opening price — seller is motivated, your offer sets the floor, not the list.
Risks & watch-outs
- Watch-outs: built in 1927 — expect roof / HVAC / electrical / plumbing capex.
- Climate carrying-cost: major wind risk, 27% chance of damaging wind over 30y; extreme-heat days projected 7→21/yr by 2055 (HVAC capex compounding) — expect insurance premiums to compound above CPI over the hold.
Questions for the listing agent
- Built in 1927 — when were the roof, HVAC, electrical panel, plumbing, and water heater last replaced?
- Is there a deadline driving the sale (1031 exchange, divorce, estate, relocation)? That informs how much negotiation room exists.
- Schools are D-rated, which usually means shorter tenancies and higher turnover. Who's the typical renter profile here, and what's been the actual vacancy rate?
- What's the average days-on-market for RENTAL listings here right now (not sales)? A rising rental-DOM trend means longer vacancies and softer asking-rent achievability than the comps imply.
- What's the recent tenant-quality profile in this submarket — average credit score on applications, eviction rate, late-payment / NSF rate, and stable-employment percentage? A property-management company in the area should have these aggregated.
- How much new for-sale + rental construction is in the pipeline within 1–3 miles? Heavy new supply typically softens prices + rents 12–24 months out; constrained supply supports both.
Investment metrics
- 1% rule
- 1.08% ✓
- Cap rate
- 9.28%
- Cash-on-cash
- 10.66%
- DSCR
- 1.47
- GRM
- 7.7
CMA / ARV
No comps found within radius.
Projected returns pro-forma
2.37% appreciation · 3.0% rent growth · sell at horizon
- IRR
- 15.9%
- Equity multiple
- 1.88×
- Total profit
- $26,925
- Equity at exit
- $45,428
- IRR
- 18.0%
- Equity multiple
- 3.48×
- Total profit
- $76,065
- Equity at exit
- $67,182
Cash invested: $30,660 (down + closing). Projections, not guarantees.
Landlord ↔ Tenant lean methodology
- Overall (STATE)
- 90 Strongly Landlord-Friendly
- State Mississippi
- 90 Strongly Landlord-Friendly · R+11
- County
- — inherits STATE
- City
- — inherits STATE
ZIP-level market 38915
- Home prices YoY
- 1.7%
- Active inventory
- 25
- Price-to-rent
- 7.7×
Monthly cashflow live
- Estimated rent
- $1,187 medium interval (Pro) →
- Mortgage (P&I)
- −$574
- Tax from tax record
- −$45 /mo · $541/yr
- Insurance
- −$46
- HOA
- −$0
- Vacancy / Maint / Mgmt
- −$249
- Net cashflow
- $272
Break-even live
Sensitivity live
| Price | -10% $334 | -5% $303 | +0% $272 | +5% $241 | +10% $210 |
|---|---|---|---|---|---|
| Rent | -10% $179 | -5% $226 | +0% $272 | +5% $319 | +10% $366 |
| Rate | -1.0pp $328 | -0.5pp $300 | base $272 | +0.5pp $244 | +1.0pp $215 |
UW: 25.0% down · 7.5% · 30yr · 1.5% tax · 5.0% vac · 8.0% maint · 8.0% mgmt
Financing live
Cash to close
- Down payment
- $27,375
- Closing costs
- $3,285
- Reserves months
- —
- Total cash needed
- —
Loan-product check · same deal, 3 products live
Conventional
25% down · 7.5% · 30yr
- Down + closing
- —
- Monthly P&I
- —
- Monthly cashflow
- —
- DSCR
- —
- Eligible?
- —
Personal DTI + credit; lowest rate.
DSCR
20% down · 8.5% · 30yr
- Down + closing
- —
- Monthly P&I
- —
- Monthly cashflow
- —
- DSCR
- —
- Eligible?
- —
No personal income docs; deal must DSCR.
Hard money
10% down · 12.0% · 12mo
- Down + closing
- —
- Monthly P&I
- —
- Monthly cashflow
- —
- DSCR
- —
- Eligible?
- —
Short-term bridge; refi at stabilization.
Listing history 17 events
-
2026-06-09days on market $109,500 Active 25 DOM
-
2026-06-08days on market $109,500 Active 24 DOM
-
2026-06-07pricestatusdays on market $109,500 Active 23 DOM
-
2026-05-12price $115,000 348-char remark
-
2026-04-30$125,000 Active 348-char remark
-
2026-03-26price $115,000
-
2026-03-16price $129,500
-
2026-02-26price $139,900
-
2026-02-14$145,000 Active
-
2026-02-07historical $1,100
-
2026-01-06$1,100
-
2025-12-29historical $1,100
-
2025-11-27price $1,100
-
2025-10-21$1,250
-
2025-06-23historical $1,350
-
2025-05-22$1,350
-
1999-10-14soldstatus
ⓘ Source: listings_history table (triggers on properties + properties_extension) + one-shot
backfill from property_details.listing_events for pre-trigger history.
Tax reassessment forecast MS · Resets to sale price
- Current annual tax
- $541 · $45/mo
- Projected year-2 tax
- $865 · $72/mo
- Expected delta
- +$324/yr (+$27/mo · 59.8%)
ⓘ Screening estimate from a state-policy table — verify with the county assessor before closing.
Climate risk First Street
- Flood 1/10 Low FEMA zone X (unshaded) · 0% chance over 30 yrs
- Wildfire 4/10 Moderate
- Heat 7/10 Severe 7 d/yr ≥109°F today · 21 d/yr by 30 yrs out
- Wind 6/10 Major 27% chance of damaging wind over 30 yrs
- Air quality 2/10 Low 0 unhealthy d/yr today · 1 by 30 yrs out
Nearby sold comps map
Loading sold comps map…
Walkable amenities ~0.75 mi
Loading nearby amenities…
Taxation est. · year 1
- Rental income
- $14,239
- − Mortgage interest
- −$6,134
- − Property taxes
- −$541
- − Insurance
- −$548
- − Repairs & maintenance
- −$1,139
- − Management
- −$1,139
- − Depreciation
- −$3,185
- Taxable income
- $1,553
- Est. tax owed @ 24.0%
- −$373
- After-tax cash flow
- $2,897/yr
For passive investors: Depreciation is non-cash, so a rental often shows a tax loss while cash-flowing — sheltering income. Rental losses are passive: they offset passive income freely, and up to $25,000/yr can offset ordinary (W-2) income if you actively participate and your MAGI is under $100k (phasing out to $0 by $150k); unused losses carry forward. On sale, claimed depreciation is recaptured at up to 25%, and gains may owe capital-gains tax (a 1031 exchange can defer both). Figures are a year-1 estimate at your 24.0% rate — not tax advice; consult a CPA.
Schools (NCES district)
- District
- Calhoun County School District
- NCES district ID
- 2800870
- Math proficiency
- 28% ▼ -12.00%
- Reading proficiency
- 29% ▼ -9.00%
- Median HH income
- $30,951
- Composite
- 23.14/100
- National rank
- #7952
- State rank
- #75 of 130 in MS
Livability — Bruce
- Score
- 63/100
- State rank
- #147
- US rank
- #15075
Category grades
Schools grade is shown separately in the Schools card above.
Census & demographics
- Census place
- Bruce, MS
- Population (ZIP)
- 3,186
Population outlook (Calhoun County) Hauer SSP2
- Today (2025)
- 14,108 people
- By 2030
- 13,650 · -3.2%
- By 2040
- 12,586 · -10.8%
- By 2050
- 11,417 · -19.1%
- By 2075
- 8,381 · -40.6%
- By 2100
- 5,478 · -61.2%
Race, ethnicity, and origin ACS 2023
- Neighborhood character
- Predominantly White (68%)
- Race & ethnicity
- White 68% Black 29% Two or more races 3%
- Common ancestry
- Italian 1%
Political lean MEDSL · Calhoun
- 2024 margin
- Solid R (+48.0) · D 25.6% · R 73.6%
- 2008→2024 swing
- -20.3pp toward R · 2008: -27.7pp · 2024: -48.0pp
- All cycles
- 2024: R+48.0 2020: R+41.3 2016: R+39.1 2012: R+27.3 2008: R+27.7
Not yet ingested
- Civics
- —
Market trends
- HPI YoY
- ▲ 2.37%
- Current HPI
- 143.4197
- Rent YoY
- —
- Metro
- —
- State GDP YoY
- —
- F500 in state
- 0
Price history
+8011.1% since first listed18 events — show timeline
- 2026-06-06 Relisted — MLSU
- 2026-06-06 Price Changed $109,500 MLSU
- 2026-05-22 Pending — MLSU
- 2026-05-22 Listing Removed — MLSU
- 2026-05-12 Price Changed $115,000 MLSU
- 2026-04-30 Listed $125,000 MLSU
- 2026-03-26 Price Changed $115,000 NCMBR
- 2026-03-16 Price Changed $129,500 NCMBR
- 2026-02-26 Price Changed $139,900 NCMBR
- 2026-02-14 Listed $145,000 NCMBR
- 2026-02-07 Rental Removed $1,100 Avail
- 2026-01-06 Listed for Rent $1,100 Avail
- 2025-12-29 Rental Removed $1,100 Avail
- 2025-11-27 Price Changed $1,100 Avail
- 2025-10-21 Listed for Rent $1,250 Avail
- 2025-06-23 Rental Removed $1,350 Avail
- 2025-05-22 Listed for Rent $1,350 Avail
- 1999-10-14 Sold (Public Records) — Public Records
Property tax history
+7.0%/yrLatest (2025): $541 · +3.5% YoY. Source: county tax records.
Cash-flow waterfall
monthlySold comps — $/sqft
last 12 mo · ≤1 miLoading sold comps…