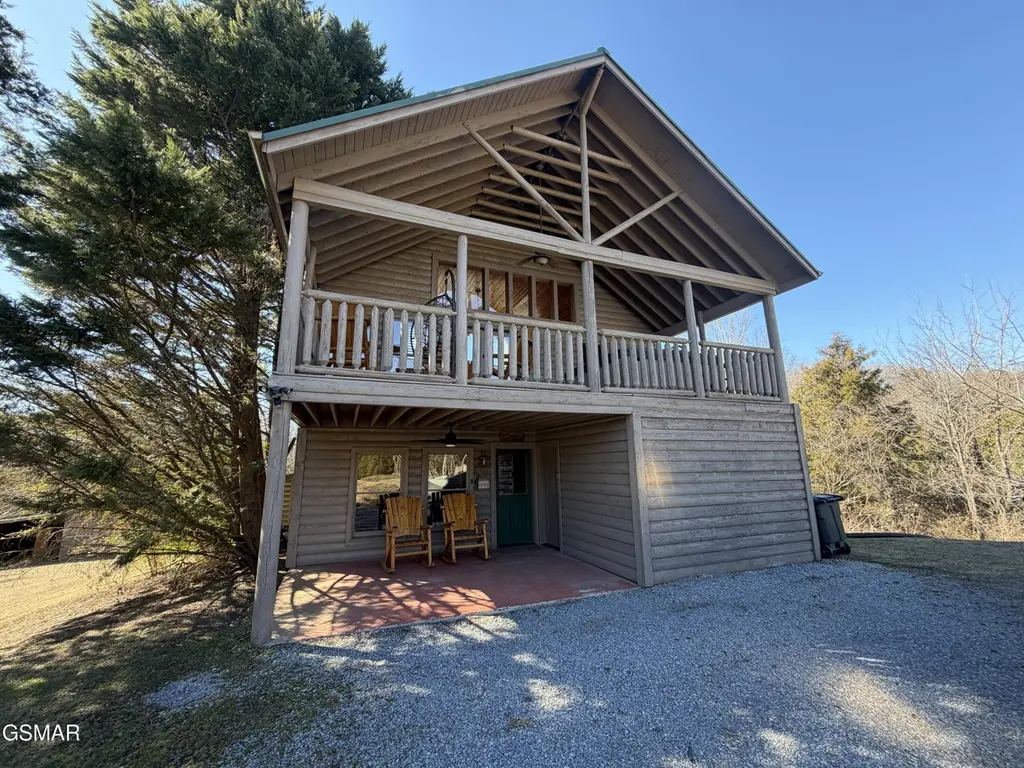
1030 E Madison Drive Dr · Sevierville, TN
Flood risk 1/10 · Minimal
- FEMA flood zone
- X (unshaded)
- Chance of flooding over 30 yrs
- 0.0%
- Est. flood insurance / yr
- $473 – $860
Fire risk 4/10 · Minor
- Est. fire insurance / yr
- $949 – $1,763
Heat risk 5/10 · Moderate
- Hot days now (above 103°F)
- 7 days/yr
- Hot days in 30 yrs
- 20 days/yr
Wind risk 2/10 · Minimal
- Chance of severe wind over 30 yrs
- —
Air-quality risk 3/10 · Minor
- Unhealthy air days now
- 2 days/yr
- Unhealthy air days in 30 yrs
- 2 days/yr
Risk factors via First Street. Map © Google.
Why this score? — see what drove the D- grade
The composite is a weighted blend of 9 inputs, each scored 0–100. Each bar is that input's sub-score; the figure is the points it added to the 100-point composite (weight × sub-score).
- ARV discount +15.0/15.0
- Appreciation +10.0/10.0
- Livability +2.9/5.0
- Schools +2.5/10.0
- Condition / age +2.5/5.0
- Cash flow +2.4/30.0
- Rent growth +1.9/5.0
- 1% rule +0.0/10.0
- DSCR +0.0/10.0
$419,000
🖨 Deal sheet (PDF) 📄 Offer letter ✓ Due diligence
Listing remarks MLS
OWNER/AGENT FLAT LOT AROUND CABIN, NEW LAST, YEAR HVAC, WATER HEATER, FLOORING IN LIVING ROOM AND DINING ROOM, COMBO WASHER/DRYER. BACK HVAC 4 YEARS OLD, WELL PUMP 3 YEARS OLD. 4 BED 2 BATH 1.77 ACRE LOT, COUNTRY SETTING
Key facts
- New hvac
- Flat lot
- Combo washer dryer
Tags
Neighborhood map
What this means for you Summary
Snapshot
- This is a 4-bed/1.0-bath single-family listed at $419k.
Deal economics
- At list price, monthly cash flow is $-1k ($-18k/yr) — negative.
- To cash-flow at today's rent, offer at most $206k (50.9% below list).
- To meet the 1% rule (rent ≥ 1% of price), the offer needs to be $180k (57.1% below list).
- Recommended offer: $180k (57.1% below list) — sets the bar for 1% rule.
- Cap rate 2.1% vs local median 1.6% in Sevierville — meaningfully above typical; check what's discounted (condition, days-on-market, listing class) to confirm the premium yield is real.
Location & tenants
- Location reads 57/100 on livability (#323 in TN) — a working-class tenant base; expect higher turnover. Strengths: cost of living A+, housing A-; Watch: employment C-, crime F, amenities F.
- Sevier County (rural): math 31% / reading 28% proficiency, ranked #62 of 139 in TN (top 45%) — low school quality limits family demand, transient renter base, plan for 1-2y turnover.
- Zoned schools: New Center Elementary (math 32% / reading 28%, grade F, #415 of 952 statewide, top 44%, 855 students, 0% FRL); Seymour Junior High (math 40% / reading 30%, grade F, #65 of 333 statewide, top 20%, 766 students, 0% FRL); Sevier County High School (math 20% / reading 38%, grade F, #92 of 332 statewide, top 28%, 1,248 students, 0% FRL) — zoned schools average 0% FRL vs 52% district-wide (52 pts lower); this property's tenant base skews higher-income than the district average.
- Market conditions: Rents soft (-2.6%/yr); 1142 active listings in the ZIP; 1,594 units permitted in Sevier County in 2024 (456 in 5+ unit buildings).
- This rent runs 37% of the median local income ($58k/yr) — at the standard rent-burdened threshold; future hikes will face affordability resistance.
Forward outlook
- In year one you build about $45k of equity ($3k loan paydown + $42k appreciation (10.0% local appreciation)).
- Sevier County population projected at +22% by 2050 — long-run rental-demand tailwind backs the buy-and-hold thesis.
- By year 2, paydown + projected appreciation supports a ~$72k cash-out refi (75% LTV) — recoverable capital for the next deal without selling this one.
Negotiation context
- It's been on market 122 days — a 12% lower offer ($369k) is reasonable based on typical stale-listing flexibility.
- 4 sale attempts since 21y ago; this cycle's ask has dropped $80k (16%) from the opening price — seller is motivated, your offer sets the floor, not the list.
- Current owner paid $245k; list at $419k implies a 71% gain — meaningful room to come down on a strong offer.
Risks & watch-outs
- Climate carrying-cost: extreme-heat days projected 7→20/yr by 2055 (HVAC capex compounding) — expect insurance premiums to compound above CPI over the hold.
Questions for the listing agent
- What do current leases actually rent for vs. the listed asking? Can we see a recent rent roll and the last 12 months of T-12 income?
- It's been on market 122 days. Have you received any prior offers? Is the seller open to a 57% concession, seller financing, or rate buy-down credit?
- Why hasn't it sold? Are there any deal-killer items the seller is aware of (foundation, flood, title, zoning, code violations)?
- Is there a deadline driving the sale (1031 exchange, divorce, estate, relocation)? That informs how much negotiation room exists.
- Schools are F-rated, which usually means shorter tenancies and higher turnover. Who's the typical renter profile here, and what's been the actual vacancy rate?
- Crime grade is F in this area — have there been break-ins, vandalism, or insurance claims at this property in the last 3 years? What carrier currently insures it and at what premium?
- The area grade is low — what's the realistic commute time and amenity access for the typical tenant pool here? Any planned neighborhood developments (good or bad) we should know about?
- What's the average days-on-market for RENTAL listings here right now (not sales)? A rising rental-DOM trend means longer vacancies and softer asking-rent achievability than the comps imply.
- What's the recent tenant-quality profile in this submarket — average credit score on applications, eviction rate, late-payment / NSF rate, and stable-employment percentage? A property-management company in the area should have these aggregated.
- How much new for-sale + rental construction is in the pipeline within 1–3 miles? Heavy new supply typically softens prices + rents 12–24 months out; constrained supply supports both.
Investment metrics
- 1% rule
- 0.43% ✗
- Cap rate
- 2.07%
- Cash-on-cash
- -15.09%
- DSCR
- 0.33
- GRM
- 19.4
CMA / ARV
- ARV (median comp)
- $567,713
- List price
- $419,000
- Delta
- -26.20%
- Verdict
- UNDERPRICED
- Comps
- 20 within 1.0 mi
Projected returns pro-forma
10.0% appreciation · 0.0% rent growth · sell at horizon
- IRR
- 13.3%
- Equity multiple
- 2.10×
- Total profit
- $129,006
- Equity at exit
- $377,468
- IRR
- 13.2%
- Equity multiple
- 4.79×
- Total profit
- $444,401
- Equity at exit
- $814,025
Cash invested: $117,320 (down + closing). Projections, not guarantees.
Landlord ↔ Tenant lean methodology
- Overall (STATE)
- 87 Strongly Landlord-Friendly
- State Tennessee
- 87 Strongly Landlord-Friendly · R+13
- County
- — inherits STATE
- City
- — inherits STATE
ZIP-level market 37876
- Home prices YoY
- 2.4%
- Rents YoY
- -2.6%
- Active inventory
- 1142
- Price-to-rent
- 19.4×
Monthly cashflow live
- Estimated rent
- $1,798 medium interval (Pro) →
- Mortgage (P&I)
- −$2,197
- Tax est. 1.5%
- −$524 /mo · $6,285/yr
- Insurance
- −$175
- HOA
- −$0
- Vacancy / Maint / Mgmt
- −$378
- Net cashflow
- $-1,475
Break-even live
Sensitivity live
| Price | -10% $-1,186 | -5% $-1,330 | +0% $-1,475 | +5% $-1,620 | +10% $-1,765 |
|---|---|---|---|---|---|
| Rent | -10% $-1,617 | -5% $-1,546 | +0% $-1,475 | +5% $-1,404 | +10% $-1,333 |
| Rate | -1.0pp $-1,264 | -0.5pp $-1,369 | base $-1,475 | +0.5pp $-1,584 | +1.0pp $-1,694 |
UW: 25.0% down · 7.5% · 30yr · 1.5% tax · 5.0% vac · 8.0% maint · 8.0% mgmt
Financing live
Cash to close
- Down payment
- $104,750
- Closing costs
- $12,570
- Reserves months
- —
- Total cash needed
- —
Loan-product check · same deal, 3 products live
Conventional
25% down · 7.5% · 30yr
- Down + closing
- —
- Monthly P&I
- —
- Monthly cashflow
- —
- DSCR
- —
- Eligible?
- —
Personal DTI + credit; lowest rate.
DSCR
20% down · 8.5% · 30yr
- Down + closing
- —
- Monthly P&I
- —
- Monthly cashflow
- —
- DSCR
- —
- Eligible?
- —
No personal income docs; deal must DSCR.
Hard money
10% down · 12.0% · 12mo
- Down + closing
- —
- Monthly P&I
- —
- Monthly cashflow
- —
- DSCR
- —
- Eligible?
- —
Short-term bridge; refi at stabilization.
Listing history 28 events
-
2026-06-22days on market $419,000 Active 122 DOM
-
2026-06-19days on market $419,000 Active 120 DOM
-
2026-06-18days on market $419,000 Active 119 DOM
-
2026-06-17days on market $419,000 Active 118 DOM
-
2026-06-16days on market $419,000 Active 117 DOM
-
2026-06-15days on market $419,000 Active 116 DOM
-
2026-06-14days on market $419,000 Active 114 DOM
-
2026-06-13days on market $419,000 Active 113 DOM
-
2026-06-10days on market $419,000 Active 111 DOM
-
2026-06-09days on market $419,000 Active 110 DOM
-
2026-06-08days on market $419,000 Active 109 DOM
-
2026-06-07days on market $419,000 Active 108 DOM
-
2026-06-02days on market $419,000 Active 103 DOM
-
2026-06-01days on market $419,000 Active 102 DOM
-
2026-05-31days on market $419,000 Active 101 DOM
-
2026-05-30days on market $419,000 Active 100 DOM
-
2026-05-09price $419,000 222-char remark
Show marketing remark (222 chars)
OWNER/AGENT FLAT LOT AROUND CABIN, NEW LAST, YEAR HVAC, WATER HEATER, FLOORING IN LIVING ROOM AND DINING ROOM, COMBO WASHER/DRYER. BACK HVAC 4 YEARS OLD, WELL PUMP 3 YEARS OLD. 4 BED 2 BATH 1.77 ACRE LOT, COUNTRY SETTING
-
2026-05-01price $439,000 222-char remark
Show marketing remark (222 chars)
OWNER/AGENT FLAT LOT AROUND CABIN, NEW LAST, YEAR HVAC, WATER HEATER, FLOORING IN LIVING ROOM AND DINING ROOM, COMBO WASHER/DRYER. BACK HVAC 4 YEARS OLD, WELL PUMP 3 YEARS OLD. 4 BED 2 BATH 1.77 ACRE LOT, COUNTRY SETTING
-
2026-04-09price $455,000 222-char remark
Show marketing remark (222 chars)
OWNER/AGENT FLAT LOT AROUND CABIN, NEW LAST, YEAR HVAC, WATER HEATER, FLOORING IN LIVING ROOM AND DINING ROOM, COMBO WASHER/DRYER. BACK HVAC 4 YEARS OLD, WELL PUMP 3 YEARS OLD. 4 BED 2 BATH 1.77 ACRE LOT, COUNTRY SETTING
-
2026-03-18price $469,000 222-char remark
Show marketing remark (222 chars)
OWNER/AGENT FLAT LOT AROUND CABIN, NEW LAST, YEAR HVAC, WATER HEATER, FLOORING IN LIVING ROOM AND DINING ROOM, COMBO WASHER/DRYER. BACK HVAC 4 YEARS OLD, WELL PUMP 3 YEARS OLD. 4 BED 2 BATH 1.77 ACRE LOT, COUNTRY SETTING
-
2026-02-19$499,000 Active 222-char remark
Show marketing remark (222 chars)
OWNER/AGENT FLAT LOT AROUND CABIN, NEW LAST, YEAR HVAC, WATER HEATER, FLOORING IN LIVING ROOM AND DINING ROOM, COMBO WASHER/DRYER. BACK HVAC 4 YEARS OLD, WELL PUMP 3 YEARS OLD. 4 BED 2 BATH 1.77 ACRE LOT, COUNTRY SETTING
-
2025-11-06soldstatus $245,000
-
2009-09-14$239,950
-
2007-02-22$249,900
-
2005-07-26$329,000
-
2003-02-05soldstatus $39,000
-
1999-09-17soldstatus $75,500
-
1995-05-24soldstatus $62,000
ⓘ Source: listings_history table (triggers on properties + properties_extension) + one-shot
backfill from property_details.listing_events for pre-trigger history.
Climate risk First Street
- Flood 1/10 Low FEMA zone X (unshaded) · 0% chance over 30 yrs
- Wildfire 4/10 Moderate
- Heat 5/10 Major 7 d/yr ≥103°F today · 20 d/yr by 30 yrs out
- Wind 2/10 Low
- Air quality 3/10 Moderate 2 unhealthy d/yr today · 2 by 30 yrs out
Nearby sold comps map
Loading sold comps map…
Walkable amenities ~0.75 mi
Loading nearby amenities…
Taxation est. · year 1
- Rental income
- $21,577
- − Mortgage interest
- −$23,471
- − Property taxes
- −$6,285
- − Insurance
- −$2,095
- − Repairs & maintenance
- −$1,726
- − Management
- −$1,726
- − Depreciation
- −$12,189
- Taxable loss
- −$25,915
- Est. tax savings @ 24.0%
- +$6,220
- After-tax cash flow
- $-11,482/yr
For passive investors: Depreciation is non-cash, so a rental often shows a tax loss while cash-flowing — sheltering income. Rental losses are passive: they offset passive income freely, and up to $25,000/yr can offset ordinary (W-2) income if you actively participate and your MAGI is under $100k (phasing out to $0 by $150k); unused losses carry forward. On sale, claimed depreciation is recaptured at up to 25%, and gains may owe capital-gains tax (a 1031 exchange can defer both). Figures are a year-1 estimate at your 24.0% rate — not tax advice; consult a CPA.
Schools (NCES district)
- District
- Sevier County
- NCES district ID
- 4703780
- Math proficiency
- 31% ▼ -6.00%
- Reading proficiency
- 28% ▼ -4.00%
- Median HH income
- $42,730
- Composite
- 25.12/100
- National rank
- #7527
- State rank
- #62 of 139 in TN
Livability — Sevierville
- Score
- 57/100
- State rank
- #323
- US rank
- #21663
Category grades
Schools grade is shown separately in the Schools card above.
Census & demographics
- County
- Sevier County · 80,402 people
- Metro
- Sevierville, TN
- Population (ZIP)
- 33,561
- Household income
- $58,277
- Rent vs Own
- Severe rent burden
- 611.0
Population outlook (Sevier County) Hauer SSP2
- Today (2025)
- 107,903 people
- By 2030
- 113,633 · +5.3%
- By 2040
- 123,969 · +14.9%
- By 2050
- 132,123 · +22.4%
- By 2075
- 148,524 · +37.6%
- By 2100
- 153,436 · +42.2%
Race, ethnicity, and origin ACS 2023
- Neighborhood character
- Predominantly White (89%)
- Race & ethnicity
- White 89% Hispanic / Latino 5% Two or more races 5% Black 1%
- Common ancestry
- Slovak 5% Serbian 4% Romanian 2%
- Foreign-born
- 3% · Canada
- Languages at home
- 95% English-only · Spanish 3% Russian/Polish/Slavic 1%
Political lean MEDSL · Sevier
- 2024 margin
- Solid R (+61.1) · D 18.9% · R 80.1% · Other 1.0%
- 2008→2024 swing
- -13.1pp toward R · 2008: -48.1pp · 2024: -61.1pp
- All cycles
- 2024: R+61.1 2020: R+57.6 2016: R+61.7 2012: R+54.8 2008: R+48.1
Not yet ingested
- Civics
- —
Market trends
- HPI YoY
- ▲ 11.06%
- Current HPI
- 477.19
- Rent YoY
- ▼ -2.57%
- Metro
- Sevierville, TN
- State GDP YoY
- ▲ 2.78%
- F500 in state
- 22
Industry mix (Fortune 500 HQ in TN)
| Industry | F500 HQs | Revenue |
|---|---|---|
| Healthcare | 3 | $91B |
|
||
| Retail | 3 | $72B |
|
||
| Transportation / Logistics | 1 | $88B |
|
||
| Paper / Packaging | 1 | $19B |
|
||
| Insurance | 1 | $13B |
|
||
| Energy | 1 | $12B |
|
||
Price history
+575.8% since first listed12 events — show timeline
- 2026-05-09 Price Changed $419,000 GSMAR
- 2026-05-01 Price Changed $439,000 GSMAR
- 2026-04-09 Price Changed $455,000 GSMAR
- 2026-03-18 Price Changed $469,000 GSMAR
- 2026-02-19 Listed $499,000 GSMAR
- 2025-11-06 Sold (Public Records) $245,000 Public Records
- 2009-09-14 Listed $239,950 Knoxville MLS
- 2007-02-22 Listed $249,900 Knoxville MLS
- 2005-07-26 Listed $329,000 Knoxville MLS
- 2003-02-05 Sold (Public Records) $39,000 Public Records
- 1999-09-17 Sold (Public Records) $75,500 Public Records
- 1995-05-24 Sold (Public Records) $62,000 Public Records
Property tax history
+5.9%/yrLatest (2025): $649 · +0.0% YoY. Source: county tax records.
Cash-flow waterfall
monthlySold comps — $/sqft
last 12 mo · ≤1 miLoading sold comps…