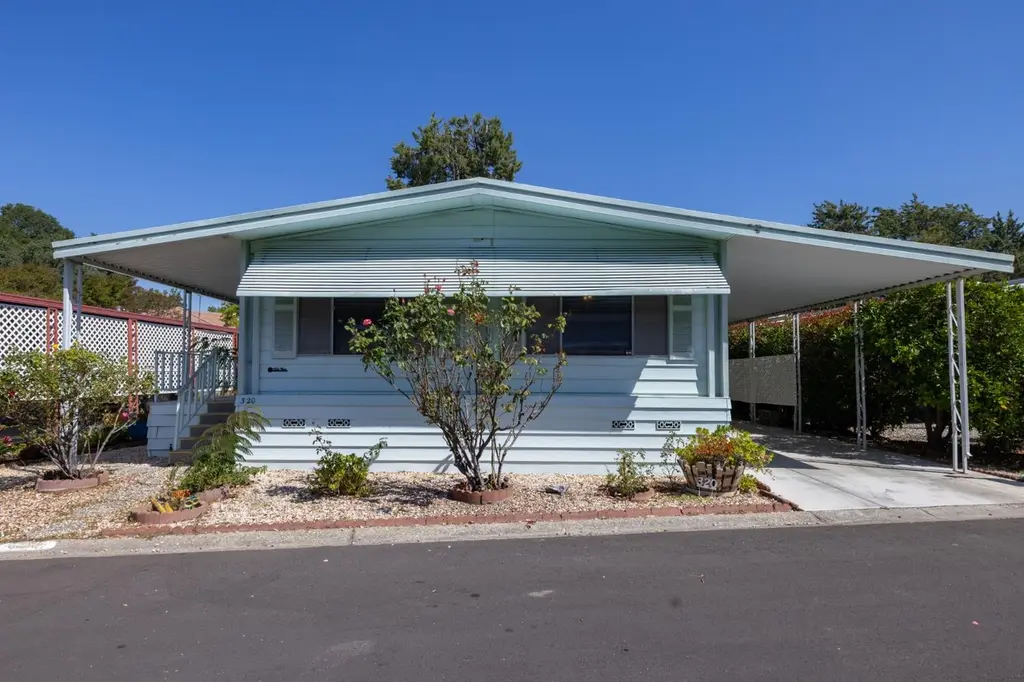
320 Bluebird Ln #320 · Folsom, CA
Flood risk 7/10 · Major
- FEMA flood zone
- X (unshaded)
- Chance of flooding over 30 yrs
- 0.75%
- Est. flood insurance / yr
- $507 – $1,088
Fire risk 2/10 · Minimal
- Est. fire insurance / yr
- $659 – $1,223
Heat risk 7/10 · Major
- Hot days now (above 103°F)
- 7 days/yr
- Hot days in 30 yrs
- 16 days/yr
Wind risk 1/10 · Minimal
- Chance of severe wind over 30 yrs
- —
Air-quality risk 10/10 · Severe
- Unhealthy air days now
- 30 days/yr
- Unhealthy air days in 30 yrs
- 38 days/yr
Risk factors via First Street. Map © Google.
Why this score? — see what drove the B+ grade
The composite is a weighted blend of 9 inputs, each scored 0–100. Each bar is that input's sub-score; the figure is the points it added to the 100-point composite (weight × sub-score).
- Cash flow +30.0/30.0
- ARV discount +12.9/15.0
- 1% rule +10.0/10.0
- DSCR +10.0/10.0
- Condition / age +3.8/5.0
- Livability +3.6/5.0
- Rent growth +2.9/5.0
- Schools +2.4/10.0
- Appreciation +0.0/10.0
$170,000
🖨 Deal sheet 📄 Offer letter ✓ Due diligence
Listing remarks
PRICE REDUCTION!!!GREAT BUY! MOVE IN READY. .. HOME IS VACANT READY FOR A BUYER. . BEAUTIFUL WOOD FLOORING! KITCHEN HAS BEEN REMODELED! LOTS OF STORAGE SPACE IN KITCHEN AND DINING ROOM. .. VERY OPEN AND SPACIOUS!!AN ENTERTAINERS DELIGHT!! VERY POPULAR FLOOR PLAN. .SPACIOUS BEDROOMS. .REMOTE CONTROLLED CEILING FANS IN EVERY ROOM . .. GREAT NEIGHBORS. .. LOTS OF ACTIVITIES WITHIN THE PARK. .. NOT FAR FROM OLD TOWN HISTORIC FOLSOM. .MUST SEE TO APPRECIATE!!!
Key facts
- 2 parking spots
- Built 1977
- Listed 24 days
Property features AI
Finance
- Financial info: Land lease: No (note: a land lease amount field was present but land lease indicated as No)
- HOA & community: No homeowners association; Located in a 55+ / senior community; Community of approximately 300 units
Exterior
- Parking: Attached covered parking; Guest parking available
- Utilities: Individual electric meter; Individual gas meter; Natural gas connected; 220V in kitchen; 220V in laundry; Public water; Public sewer
- Home design: Manufactured in park - double wide; Updated / remodeled; Built in 1977
- Construction: Metal roof; Aluminum/metal skirt; Manufactured home (Golden West)
- Exterior features: Carport awning; Porch awning; Front yard with landscaping and auto sprinkler front & rear; Shed(s)
Interior
- Kitchen: Pantry cabinet and pantry closet; Stone countertops; Free standing gas range; Free standing refrigerator; Double oven; Microwave; Dishwasher; Disposal; Ice maker / plumbed for ice maker
- Bedrooms: 2 bedrooms (includes master bedroom)
- Flooring: Carpet; Tile; Wood
- Bathrooms: 1 full bathroom; 1 partial bathroom; Tub with shower over; Shower stall(s)
- Heating & cooling: Central heating (gas); Central air; Ceiling fans
- Interior features: Open beam ceiling; Accessible full bath; Screened room / screened patio; Covered deck; Porch steps; Carpeted porch area; Storage area / shed(s)
- Laundry & utility: Washer and dryer included; Laundry closet / inside laundry room; Gas hook-up for dryer; Gas water heater; Insulated water heater
Neighborhood map
What this means for you Summary
Snapshot
- This is a 2-bed/1.5-bath manufactured listed at $170k. Condition is rated good.
Deal economics
- At list price, monthly cash flow is $778 ($9k/yr) — positive.
- The deal already cash-flows at list — no discount required.
- Meets the 1% rule at list price ($3k rent vs $170k).
- Recommended offer: $167k (1.5% below list) — sets the bar for market timing.
- Cap rate 12.3% vs local median 2.5% in Folsom — top-decile yield for the area; either an underpriced asset or a hidden risk that comps aren't pricing in. Stress-test before assuming the spread holds.
Location & tenants
- Location reads 72/100 on livability (#190 in CA) — a middle-class / working-renter tenant base. Strengths: employment A+, housing A+, schools A; Watch: amenities D, commute F, cost of living F.
- Folsom-Cordova Unified (urban): math 25% / reading 25% proficiency, ranked #365 of 517 in CA (top 71%) — low school quality limits family demand, transient renter base, plan for 1-2y turnover.
- Market conditions: Rents rising (+1.7%/yr); 422 active listings in the ZIP; 5 comparable units currently listed for rent nearby; rentals leasing fast (median 8d on market — plan ~1-2 weeks tenant-placement turnaround); 40% of comp listings sitting > 30 days — soft ceiling on asking rent; high-income renter base; 6,825 units permitted in Sacramento County in 2024 (1,752 in 5+ unit buildings).
Forward outlook
- Local home prices are declining (-3.0%/yr); year-one equity from $1k of loan paydown is wiped out by about $5k of value loss. Plan a longer hold.
- Sacramento County population projected at +17% by 2050 — long-run rental-demand tailwind backs the buy-and-hold thesis.
- At projected returns (-3.0% appreciation + 1.7% rent growth), your $48k cash investment doubles in ~7 years — after that, you're playing with house money.
Negotiation context
- It's been on market 24 days — a 2% lower offer ($167k) is reasonable based on typical stale-listing flexibility.
Risks & watch-outs
- Watch-outs: flood insurance adds $66/mo.
- Climate carrying-cost: major flood risk; extreme-heat days projected 7→16/yr by 2055 (HVAC capex compounding) — expect insurance premiums to compound above CPI over the hold.
Questions for the listing agent
- Built in 1977 — when were the roof, HVAC, electrical panel, plumbing, and water heater last replaced?
- What's the actual annual flood-insurance premium (NFIP or private), and is the property in a SFHA with mandatory coverage?
- Is there a deadline driving the sale (1031 exchange, divorce, estate, relocation)? That informs how much negotiation room exists.
- Schools are A-rated — typically a magnet for longer-tenancy family renters. What's the average tenant stay here, and is there a school-zone premium baked into asking?
- What's the average days-on-market for RENTAL listings here right now (not sales)? A rising rental-DOM trend means longer vacancies and softer asking-rent achievability than the comps imply.
- What's the recent tenant-quality profile in this submarket — average credit score on applications, eviction rate, late-payment / NSF rate, and stable-employment percentage? A property-management company in the area should have these aggregated.
- How much new for-sale + rental construction is in the pipeline within 1–3 miles? Heavy new supply typically softens prices + rents 12–24 months out; constrained supply supports both.
Investment metrics
- 1% rule
- 1.50% ✓
- Cap rate
- 12.26%
- Cash-on-cash
- 21.29%
- DSCR
- 1.95
- GRM
- 5.5
CMA / ARV
- ARV (on-the-fly)
- $192,960
- Comps found
- 12
Show comp detail 12 sales within ~0.75 mi
| Address | Dist | Beds/Ba | Sqft | Sold | Price | $/sf | Match |
|---|---|---|---|---|---|---|---|
| 342 Danielle Way | 0.16mi | 2/2.0 | 1,440 (0%) | 5mo | $155,000 | $108 | 86 |
| 95 Shadowbrook Ct | 0.47mi | 2/2.0 | 1,440 (0%) | 4mo | $170,000 | $118 | 73 |
| 320 Stonebrook Dr | 0.51mi | 2/2.0 | 1,440 (0%) | 5mo | $165,950 | $115 | 70 |
| 257 Bluebird Ln | 0.15mi | 2/2.0 | 1,620 (+12%) | 0mo | $189,000 | $117 | 70 |
| 587 Southwood | 0.33mi | 2/2.0 | 1,536 (+7%) | 3mo | $330,000 | $215 | 69 |
| 330 Stonebrook Dr | 0.51mi | 2/2.0 | 1,440 (0%) | 7mo | $206,450 | $143 | 68 |
| 230 Northlake Dr | 0.57mi | 2/1.5 | 1,440 (0%) | 7mo | $299,500 | $208 | 68 |
| 347 Danielle Way | 0.17mi | 2/2.0 | 1,248 (-13%) | 2mo | $138,000 | $111 | 66 |
| 340 Stonebrook Dr | 0.52mi | 2/2.0 | 1,536 (+7%) | 6mo | $170,000 | $111 | 57 |
| 276 Meadowrock Way | 0.62mi | 2/2.0 | 1,344 (-7%) | 1mo | $180,000 | $134 | 57 |
| 155 Leafwood Way | 0.44mi | 2/2.0 | 1,248 (-13%) | 1mo | $185,000 | $148 | 54 |
| 240 Stonebrook Dr | 0.45mi | 2/2.0 | 1,640 (+14%) | 2mo | $299,950 | $183 | 52 |
Match score weights: distance 35% · size 25% · config 20% · recency 20%. Top-matched comps best support the ARV.
Projected returns pro-forma
-3.0% appreciation · 1.72% rent growth · sell at horizon
- IRR
- 10.2%
- Equity multiple
- 1.40×
- Total profit
- $18,843
- Equity at exit
- $25,348
- IRR
- 18.2%
- Equity multiple
- 2.42×
- Total profit
- $67,550
- Equity at exit
- $14,698
Cash invested: $47,600 (down + closing). Projections, not guarantees.
Landlord ↔ Tenant lean methodology
- Overall (STATE)
- 18 Strongly Tenant-Friendly
- State California
- 18 Strongly Tenant-Friendly · D+13
- County
- — inherits STATE
- City
- — inherits STATE
ZIP-level market 95630
- Rents YoY
- 1.7%
- Active inventory
- 422
- Price-to-rent
- 5.5×
Monthly cashflow live
- Estimated rent
- $2,556 high interval (Pro) →
- Mortgage (P&I)
- −$891
- Tax est. 1.5%
- −$212 /mo · $2,550/yr
- Insurance
- −$71
- Flood insurance flood zone
- −$66 /mo · $798/yr
- HOA
- −$0
- Vacancy / Maint / Mgmt
- −$537
- Net cashflow
- $778
Break-even live
UW: 25.0% down · 7.5% · 30yr · 1.5% tax · 5.0% vac · 8.0% maint · 8.0% mgmt
Financing live
Cash to close
- Down payment
- $42,500
- Closing costs
- $5,100
- Reserves months
- —
- Total cash needed
- —
Loan-product check · same deal, 3 products live
Conventional
25% down · 7.5% · 30yr
- Down + closing
- —
- Monthly P&I
- —
- Monthly cashflow
- —
- DSCR
- —
- Eligible?
- —
Personal DTI + credit; lowest rate.
DSCR
20% down · 8.5% · 30yr
- Down + closing
- —
- Monthly P&I
- —
- Monthly cashflow
- —
- DSCR
- —
- Eligible?
- —
No personal income docs; deal must DSCR.
Hard money
10% down · 12.0% · 12mo
- Down + closing
- —
- Monthly P&I
- —
- Monthly cashflow
- —
- DSCR
- —
- Eligible?
- —
Short-term bridge; refi at stabilization.
Rent comps 5 comps
| Address | Beds | Baths | Sqft | Rent | $/sqft | DOM | Units | Dist |
|---|---|---|---|---|---|---|---|---|
| 340 Caples Dr Folsom, CA | 3.0 | 2.5 | 1423 | $2,795 | $1.96 | 7d | 1 | 0.97mi |
| 288 Marsalla Dr Folsom, CA | 3.0 | 2.0 | 1130 | $2,495 | $2.21 | 43d | 1 | 1.04mi |
| 109 N Grant Ln Folsom, CA | 2.0 | 2.0 | 1413 | $2,595 | $1.84 | 43d | 1 | 1.07mi |
| 1600 Canyon Terrace Ln Folsom, CA | 1.0–3.0 | 1.0–2.0 | 955 | $2,348 | $2.46 | 1d | 18 | 1.14mi |
| 1000 Folsom Ranch Dr Folsom, CA | 1.0–2.0 | 1.0–2.0 | 830 | $2,399 | $2.89 | 1d | 18 | 1.32mi |
Listing history 17 events
-
2026-06-18days on market $170,000 Active 24 DOM
-
2026-06-18remarks 459-char remark
-
2026-06-18price $170,000 Active 23 DOM
-
2026-06-17days on market $180,000 Active 23 DOM
-
2026-06-16days on market $180,000 Active 22 DOM
-
2026-06-15days on market $180,000 Active 21 DOM
-
2026-06-13days on market $180,000 Active 19 DOM
-
2026-06-13days on market $180,000 Active 18 DOM
-
2026-06-09days on market $180,000 Active 15 DOM
-
2026-06-08days on market $180,000 Active 14 DOM
-
2026-06-07days on market $180,000 Active 13 DOM
-
2026-06-05days on market $180,000 Active 10 DOM
-
2026-06-03days on market $180,000 Active 9 DOM
-
2026-06-02days on market $180,000 Active 8 DOM
-
2026-06-02remarks 441-char remark
-
2026-06-01days on market $180,000 Active 7 DOM
-
2026-05-31days on market $180,000 Active 6 DOM
ⓘ Source: listings_history table (triggers on properties + properties_extension) + one-shot
backfill from property_details.listing_events for pre-trigger history.
Climate risk First Street
- Flood 7/10 Severe FEMA zone X (unshaded) · 75% chance over 30 yrs
- Wildfire 2/10 Low
- Heat 7/10 Severe 7 d/yr ≥103°F today · 16 d/yr by 30 yrs out
- Wind 1/10 Low
- Air quality 10/10 Extreme 30 unhealthy d/yr today · 38 by 30 yrs out
Nearby sold comps map
Loading sold comps map…
Walkable amenities ~0.75 mi
Loading nearby amenities…
Taxation est. · year 1
- Rental income
- $30,675
- − Mortgage interest
- −$9,523
- − Property taxes
- −$2,550
- − Insurance
- −$1,648
- − Repairs & maintenance
- −$2,454
- − Management
- −$2,454
- − Depreciation
- −$4,945
- Taxable income
- $7,102
- Est. tax owed @ 24.0%
- −$1,704
- After-tax cash flow
- $7,634/yr
For passive investors: Depreciation is non-cash, so a rental often shows a tax loss while cash-flowing — sheltering income. Rental losses are passive: they offset passive income freely, and up to $25,000/yr can offset ordinary (W-2) income if you actively participate and your MAGI is under $100k (phasing out to $0 by $150k); unused losses carry forward. On sale, claimed depreciation is recaptured at up to 25%, and gains may owe capital-gains tax (a 1031 exchange can defer both). Figures are a year-1 estimate at your 24.0% rate — not tax advice; consult a CPA.
Condition & rehab AI · 30 photos
This move-in ready manufactured home features good condition throughout, with a focus on well-maintained exterior and interior. Updates to the exterior siding and kitchen appliances would significantly enhance its resale and rental value.
Value-add opportunities
- Resale Paint exterior siding — Enhances curb appeal and value
- Both Replace carpet with hardwood flooring — Improves aesthetics and increases value
- Resale Replace kitchen appliances — Modernizes kitchen and adds value
Renovation cost estimate screening
Value-add ROI direction
- Resale Paint exterior siding — Enhances curb appeal and value ↑
- Both Replace carpet with hardwood flooring — Improves aesthetics and increases value ↑
- Resale Replace kitchen appliances — Modernizes kitchen and adds value ↑
ⓘ Cost ranges are severity-bucket heuristics (US national rule-of-thumb). Get contractor quotes + a written scope before underwriting a rehab budget.
Schools (NCES district)
- District
- Folsom-Cordova Unified
- NCES district ID
- 0613890
- Math proficiency
- 25% ▼ -27.00%
- Reading proficiency
- 25% ▼ -38.00%
- Median HH income
- $75,408
- Composite
- 24.49/100
- National rank
- #7656
- State rank
- #365 of 517 in CA
Livability — Folsom
- Score
- 72/100
- State rank
- #190
- US rank
- #6125
Category grades
Schools grade is shown separately in the Schools card above.
Census & demographics
- Census place
- Folsom, CA
- County
- Sacramento County · 1,539,646 people
- City population
- 79,484
- Metro
- Sacramento-Roseville-Folsom, CA
- Population (ZIP)
- 79,484
- Household income
- $139,642
- Rent vs Own
- Severe rent burden
- 1651.0
Population outlook (Sacramento County) Hauer SSP2
- Today (2025)
- 1,660,763 people
- By 2030
- 1,732,990 · +4.3%
- By 2040
- 1,855,755 · +11.7%
- By 2050
- 1,941,335 · +16.9%
- By 2075
- 2,046,162 · +23.2%
- By 2100
- 1,961,444 · +18.1%
Race, ethnicity, and origin ACS 2023
- Neighborhood character
- Diverse neighborhood (Simpson 0.61)
- Race & ethnicity
- White 58% Asian 20% Hispanic / Latino 13% Two or more races 11% Black 3%
- Hispanic origin (detail)
- Mexican 9% Puerto Rican 1%
- Common ancestry
- Italian 4% Slovak 2% Portuguese 2%
- Foreign-born
- 20% · Canada, China, Vietnam
- Languages at home
- 75% English-only · Other Indo-European 7% Spanish 5% Other Asian/Pacific 5%
Political lean MEDSL · Sacramento
- 2024 margin
- D (+19.7) · D 58.1% · R 38.4% · Other 3.5%
- 2008→2024 swing
- +0.7pp no change · 2008: 19.0pp · 2024: 19.7pp
- All cycles
- 2024: D+19.7 2020: D+25.3 2016: D+23.7 2012: D+16.3 2008: D+19.0
Not yet ingested
- Civics
- —
Market trends
- HPI YoY
- ▼ -240.39%
- Current HPI
- 286.0579
- Rent YoY
- ▲ 1.72%
- Metro
- Sacramento-Roseville-Folsom, CA
- State GDP YoY
- ▲ 3.21%
- F500 in state
- 116
Industry mix (Fortune 500 HQ in CA)
| Industry | F500 HQs | Revenue |
|---|---|---|
| Technology | 27 | $1,492B |
|
||
| Financial Services | 3 | $174B |
|
||
| Retail | 3 | $44B |
|
||
| Insurance | 3 | $26B |
|
||
| Media / Entertainment | 2 | $115B |
|
||
| Pharmaceuticals / Biotech | 2 | $62B |
|
||
Cash-flow waterfall
monthlySold comps — $/sqft
last 12 mo · ≤1 miLoading sold comps…