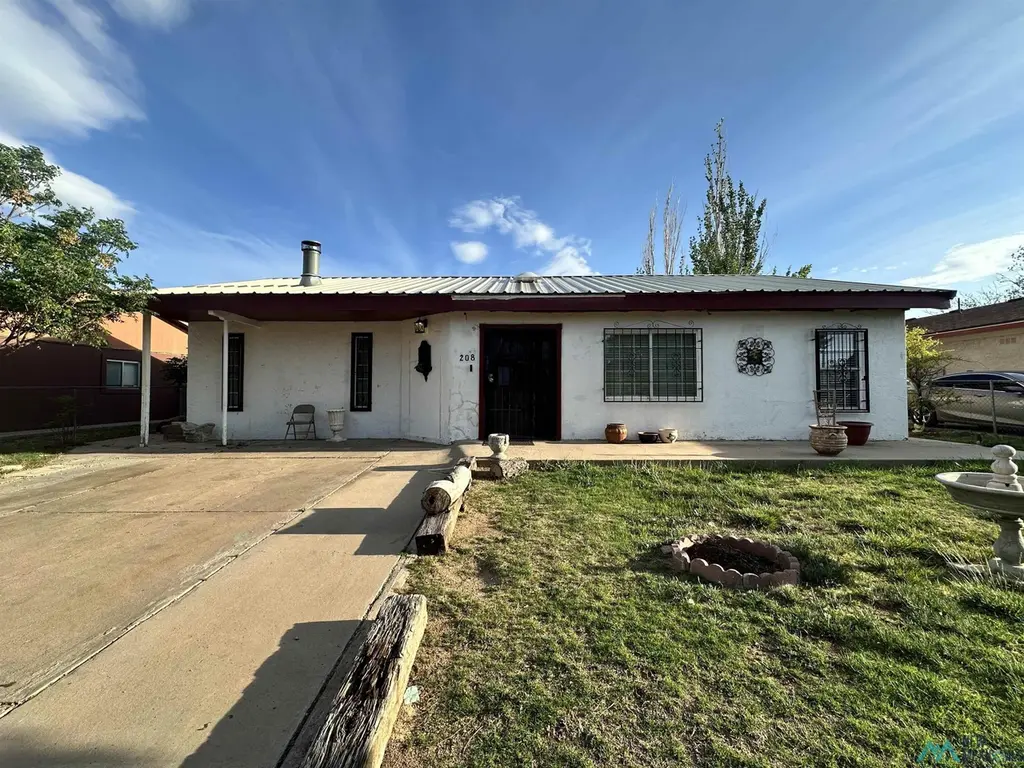
208 E Poe St · Roswell, NM
Flood risk 1/10 · Minimal
- FEMA flood zone
- X (unshaded)
- Chance of flooding over 30 yrs
- 0.0%
- Est. flood insurance / yr
- $507 – $1,088
Fire risk 6/10 · Moderate
- Est. fire insurance / yr
- $706 – $1,312
Heat risk 5/10 · Moderate
- Hot days now (above 99°F)
- 7 days/yr
- Hot days in 30 yrs
- 19 days/yr
Wind risk 2/10 · Minimal
- Chance of severe wind over 30 yrs
- —
Air-quality risk 1/10 · Minimal
- Unhealthy air days now
- 0 days/yr
- Unhealthy air days in 30 yrs
- 0 days/yr
Risk factors via First Street. Map © Google.
Why this score? — see what drove the D grade
The composite is a weighted blend of 9 inputs, each scored 0–100. Each bar is that input's sub-score; the figure is the points it added to the 100-point composite (weight × sub-score).
- Cash flow +15.7/30.0
- ARV discount +7.5/15.0
- DSCR +4.8/10.0
- Livability +3.8/5.0
- 1% rule +3.1/10.0
- Schools +2.6/10.0
- Rent growth +2.5/5.0
- Condition / age +2.5/5.0
- Appreciation +0.0/10.0
$211,500
🖨 Deal sheet (PDF) 📄 Offer letter ✓ Due diligence
Listing remarks
Welcome to 208 S Poe in Roswell, NM—a charming Southwest-style home full of character and opportunity. This 3 bedroom 1.5 bath home offers a functional layout with comfortable living spaces, a beautiful fireplace in the family room, and unique touches like decorative window accents and security grilles that add both style and peace of mind. The spacious driveway and covered parking provide plenty of room for vehicles, while the front yard offers space to personalize or enhance your outdoor living area. Adding incredible value is the detached 540 square foot studio apartment—ideal for rental income, guests, or a private workspace. With its own separate setup, it provides flexibil
Key facts
- Covered parking
- Security grilles
- Front yard
Tags
Property features AI
Exterior
- Parking: No garage
- Home design: Single family residence; One story
- Construction: Stucco construction
- Exterior features: Metal roof; Guest house on the property; Shed(s) on the property; Sidewalks
Interior
- Kitchen: Free-standing range
- Flooring: Laminate flooring; Tile flooring
- Bathrooms: 2 full bathrooms; 1 half bathroom
- Heating & cooling: Central air conditioning; Forced air heating
- Interior features: Free-standing range; One fireplace located in the family room
Neighborhood map
What this means for you Summary
Snapshot
- This is a 3-bed/1.0-bath single-family listed at $212k.
Deal economics
- At list price, monthly cash flow is $91 ($1k/yr) — positive.
- The deal already cash-flows at list — no discount required.
- To meet the 1% rule (rent ≥ 1% of price), the offer needs to be $171k (18.9% below list).
- Recommended offer: $171k (18.9% below list) — sets the bar for 1% rule.
Location & tenants
- Location reads 75/100 on livability (#8 in NM, #4,339 nationally) — a middle-class / working-renter tenant base. Strengths: commute A+, cost of living A+, housing A+; Watch: employment D, crime F, amenities F.
- Roswell Independent Schools (town): math 11% / reading 52% proficiency, ranked #16 of 29 in NM (top 55%) — families likely to look elsewhere, expect single-tenant / working-renter base with shorter leases; 75% free/reduced lunch — lower-income household profile, screen leases tightly.
- Zoned schools: Monterrey Elementary (math 8% / reading 56%, grade F, #49 of 68 statewide, top 72%, 409 students, 100% FRL); Mountain View Middle (math 8% / reading 43%, grade F, #17 of 27 statewide, top 62%, 520 students, 100% FRL); Roswell High (math 11% / reading 30%, grade F, #97 of 110 statewide, top 88%, 1,438 students, 0% FRL).
- Market conditions: 181 active listings in the ZIP; 4 comparable units currently listed for rent nearby; rentals lingering (median 46d on market — plan ~5-8 weeks vacancy on turnover, expect pricing pressure); 100% of comp listings sitting > 30 days — soft ceiling on asking rent; lower-income renter base — watch delinquency; 88 units permitted in Chaves County in 2024 (0 in 5+ unit buildings).
- At $1,715/mo this rent would consume 49% of the median local household income ($42k/yr) (locally 995% of renters already pay >50% of income on rent) — very limited rent-growth headroom before tenants either downsize or default.
Forward outlook
- Local home prices are declining (-3.0%/yr); year-one equity from $1k of loan paydown is wiped out by about $6k of value loss. Plan a longer hold.
Negotiation context
- It's been on market 65 days — a 6% lower offer ($199k) is reasonable based on typical stale-listing flexibility.
Risks & watch-outs
- Climate carrying-cost: major wildfire risk; extreme-heat days projected 7→19/yr by 2055 (HVAC capex compounding) — expect insurance premiums to compound above CPI over the hold.
Questions for the listing agent
- It's been on market 65 days. Have you received any prior offers? Is the seller open to a 19% concession, seller financing, or rate buy-down credit?
- Built in 1961 — when were the roof, HVAC, electrical panel, plumbing, and water heater last replaced?
- Why hasn't it sold? Are there any deal-killer items the seller is aware of (foundation, flood, title, zoning, code violations)?
- Is there a deadline driving the sale (1031 exchange, divorce, estate, relocation)? That informs how much negotiation room exists.
- Schools are F-rated, which usually means shorter tenancies and higher turnover. Who's the typical renter profile here, and what's been the actual vacancy rate?
- Crime grade is F in this area — have there been break-ins, vandalism, or insurance claims at this property in the last 3 years? What carrier currently insures it and at what premium?
- The area grade is low — what's the realistic commute time and amenity access for the typical tenant pool here? Any planned neighborhood developments (good or bad) we should know about?
- What's the average days-on-market for RENTAL listings here right now (not sales)? A rising rental-DOM trend means longer vacancies and softer asking-rent achievability than the comps imply.
- What's the recent tenant-quality profile in this submarket — average credit score on applications, eviction rate, late-payment / NSF rate, and stable-employment percentage? A property-management company in the area should have these aggregated.
- How much new for-sale + rental construction is in the pipeline within 1–3 miles? Heavy new supply typically softens prices + rents 12–24 months out; constrained supply supports both.
Investment metrics
- 1% rule
- 0.81% ✗
- Cap rate
- 6.81%
- Cash-on-cash
- 1.85%
- DSCR
- 1.08
- GRM
- 10.3
CMA / ARV
No comps found within radius.
Projected returns pro-forma
-3.0% appreciation · 3.0% rent growth · sell at horizon
- IRR
- -13.4%
- Equity multiple
- 0.52×
- Total profit
- $-28,545
- Equity at exit
- $31,535
- IRR
- -4.6%
- Equity multiple
- 0.70×
- Total profit
- $-17,748
- Equity at exit
- $18,287
Cash invested: $59,220 (down + closing). Projections, not guarantees.
Landlord ↔ Tenant lean methodology
- Overall (STATE)
- 55 Moderately Landlord-Leaning
- State New Mexico
- 55 Moderately Landlord-Leaning · D+3
- County
- — inherits STATE
- City
- — inherits STATE
ZIP-level market 88203
- Home prices YoY
- -34.1%
- Active inventory
- 181
- Price-to-rent
- 10.3×
Monthly cashflow live
- Estimated rent
- $1,715 medium interval (Pro) →
- Mortgage (P&I)
- −$1,109
- Tax from tax record
- −$66 /mo · $790/yr
- Insurance
- −$88
- HOA
- −$0
- Vacancy / Maint / Mgmt
- −$360
- Net cashflow
- $91
Break-even live
Sensitivity live
| Price | -10% $211 | -5% $151 | +0% $91 | +5% $32 | +10% $-28 |
|---|---|---|---|---|---|
| Rent | -10% $-44 | -5% $24 | +0% $91 | +5% $159 | +10% $227 |
| Rate | -1.0pp $198 | -0.5pp $145 | base $91 | +0.5pp $37 | +1.0pp $-19 |
UW: 25.0% down · 7.5% · 30yr · 1.5% tax · 5.0% vac · 8.0% maint · 8.0% mgmt
Financing live
Cash to close
- Down payment
- $52,875
- Closing costs
- $6,345
- Reserves months
- —
- Total cash needed
- —
Loan-product check · same deal, 3 products live
Conventional
25% down · 7.5% · 30yr
- Down + closing
- —
- Monthly P&I
- —
- Monthly cashflow
- —
- DSCR
- —
- Eligible?
- —
Personal DTI + credit; lowest rate.
DSCR
20% down · 8.5% · 30yr
- Down + closing
- —
- Monthly P&I
- —
- Monthly cashflow
- —
- DSCR
- —
- Eligible?
- —
No personal income docs; deal must DSCR.
Hard money
10% down · 12.0% · 12mo
- Down + closing
- —
- Monthly P&I
- —
- Monthly cashflow
- —
- DSCR
- —
- Eligible?
- —
Short-term bridge; refi at stabilization.
Rent comps 4 comps
| Address | Beds | Baths | Sqft | Rent | $/sqft | DOM | Units | Dist |
|---|---|---|---|---|---|---|---|---|
| 1915 S Pennsylvania Ave Roswell, NM | 4.0 | 2.0 | 1757 | $1,800 | $1.02 | 45d | 1 | 0.34mi |
| 2703 S Onyx Dr Roswell, NM | 3.0 | 2.0 | 1400 | $1,900 | $1.36 | 45d | 1 | 0.47mi |
| 2614 Palomar Pl Roswell, NM | 3.0 | 2.0 | 1278 | $1,400 | $1.10 | 45d | 1 | 0.89mi |
| 1049 W Poe St Roswell, NM | 2.0 | 1.5 | 1413 | $1,200 | $0.85 | 45d | 1 | 1.11mi |
Listing history 19 events
-
2026-06-22days on market $211,500 Active 65 DOM
-
2026-06-21days on market $211,500 Active 64 DOM
-
2026-06-19days on market $211,500 Active 62 DOM
-
2026-06-18days on market $211,500 Active 61 DOM
-
2026-06-17days on market $211,500 Active 60 DOM
-
2026-06-16days on market $211,500 Active 59 DOM
-
2026-06-15days on market $211,500 Active 58 DOM
-
2026-06-14days on market $211,500 Active 56 DOM
-
2026-06-12pricedays on market $211,500 Active 55 DOM
-
2026-06-09days on market $235,000 Active 52 DOM
-
2026-06-08days on market $235,000 Active 51 DOM
-
2026-06-07days on market $235,000 Active 50 DOM
-
2026-06-05days on market $235,000 Active 47 DOM
-
2026-06-03days on market $235,000 Active 46 DOM
-
2026-06-02days on market $235,000 Active 45 DOM
-
2026-06-01days on market $235,000 Active 44 DOM
-
2026-05-31days on market $235,000 Active 43 DOM
-
2026-05-30days on market $235,000 Active 42 DOM
-
2026-04-18$235,000 Active 1039-char remark
ⓘ Source: listings_history table (triggers on properties + properties_extension) + one-shot
backfill from property_details.listing_events for pre-trigger history.
Tax reassessment forecast NM · Resets to sale price
- Current annual tax
- $790 · $66/mo
- Projected year-2 tax
- $1,692 · $141/mo
- Expected delta
- +$902/yr (+$75/mo · 114.3%)
ⓘ Screening estimate from a state-policy table — verify with the county assessor before closing.
Climate risk First Street
- Flood 1/10 Low FEMA zone X (unshaded) · 0% chance over 30 yrs
- Wildfire 6/10 Major
- Heat 5/10 Major 7 d/yr ≥99°F today · 19 d/yr by 30 yrs out
- Wind 2/10 Low
- Air quality 1/10 Low 0 unhealthy d/yr today · 0 by 30 yrs out
Nearby sold comps map
Loading sold comps map…
Walkable amenities ~0.75 mi
Loading nearby amenities…
Taxation est. · year 1
- Rental income
- $20,574
- − Mortgage interest
- −$11,847
- − Property taxes
- −$790
- − Insurance
- −$1,058
- − Repairs & maintenance
- −$1,646
- − Management
- −$1,646
- − Depreciation
- −$6,153
- Taxable loss
- −$2,565
- Est. tax savings @ 24.0%
- +$615
- After-tax cash flow
- $1,713/yr
For passive investors: Depreciation is non-cash, so a rental often shows a tax loss while cash-flowing — sheltering income. Rental losses are passive: they offset passive income freely, and up to $25,000/yr can offset ordinary (W-2) income if you actively participate and your MAGI is under $100k (phasing out to $0 by $150k); unused losses carry forward. On sale, claimed depreciation is recaptured at up to 25%, and gains may owe capital-gains tax (a 1031 exchange can defer both). Figures are a year-1 estimate at your 24.0% rate — not tax advice; consult a CPA.
Schools (NCES district)
- District
- Roswell Independent Schools
- NCES district ID
- 3502250
- Math proficiency
- 11% ▼ -9.00%
- Reading proficiency
- 52% ▲ 23.00%
- Median HH income
- $38,848
- Composite
- 26.21/100
- National rank
- #7262
- State rank
- #16 of 29 in NM
Livability — Roswell
- Score
- 75/100
- State rank
- #8
- US rank
- #4339
Category grades
Schools grade is shown separately in the Schools card above.
Census & demographics
- Census place
- Roswell, NM
- County
- Chaves County · 56,277 people
- City population
- 56,277
- Metro
- Roswell, NM
- Population (ZIP)
- 28,753
- Household income
- $42,207
- Rent vs Own
- Severe rent burden
- 995.0
Population outlook (Chaves County) Hauer SSP2
- Today (2025)
- 66,122 people
- By 2030
- 66,351 · +0.3%
- By 2040
- 66,818 · +1.1%
- By 2050
- 66,928 · +1.2%
- By 2075
- 65,474 · -1.0%
- By 2100
- 58,943 · -10.9%
Race, ethnicity, and origin ACS 2023
- Neighborhood character
- Predominantly Hispanic (65%)
- Race & ethnicity
- Hispanic / Latino 65% White 31% Two or more races 22% Black 2% Native American 1%
- Hispanic origin (detail)
- Mexican 58%
- Common ancestry
- Slovak 1% Serbian 1% Lithuanian 1%
- Foreign-born
- 12% · Canada
- Languages at home
- 62% English-only · Spanish 38%
Political lean MEDSL · Chaves
- 2024 margin
- Solid R (+44.8) · D 26.8% · R 71.6% · Other 1.6%
- 2008→2024 swing
- -20.2pp toward R · 2008: -24.7pp · 2024: -44.8pp
- All cycles
- 2024: R+44.8 2020: R+41.3 2016: R+36.4 2012: R+32.4 2008: R+24.7
Not yet ingested
- Civics
- —
Market trends
- HPI YoY
- ▼ -78.30%
- Current HPI
- 151.1401
- Rent YoY
- —
- Metro
- Roswell, NM
- State GDP YoY
- —
- F500 in state
- 0
Price history
-10.0% since first listed2 events — show timeline
- 2026-06-09 Price Changed $211,500 NMMLS
- 2026-04-18 Listed $235,000 NMMLS
Property tax history
+3.1%/yrLatest (2025): $790 · -0.9% YoY. Source: county tax records.
Cash-flow waterfall
monthlySold comps — $/sqft
last 12 mo · ≤1 miLoading sold comps…