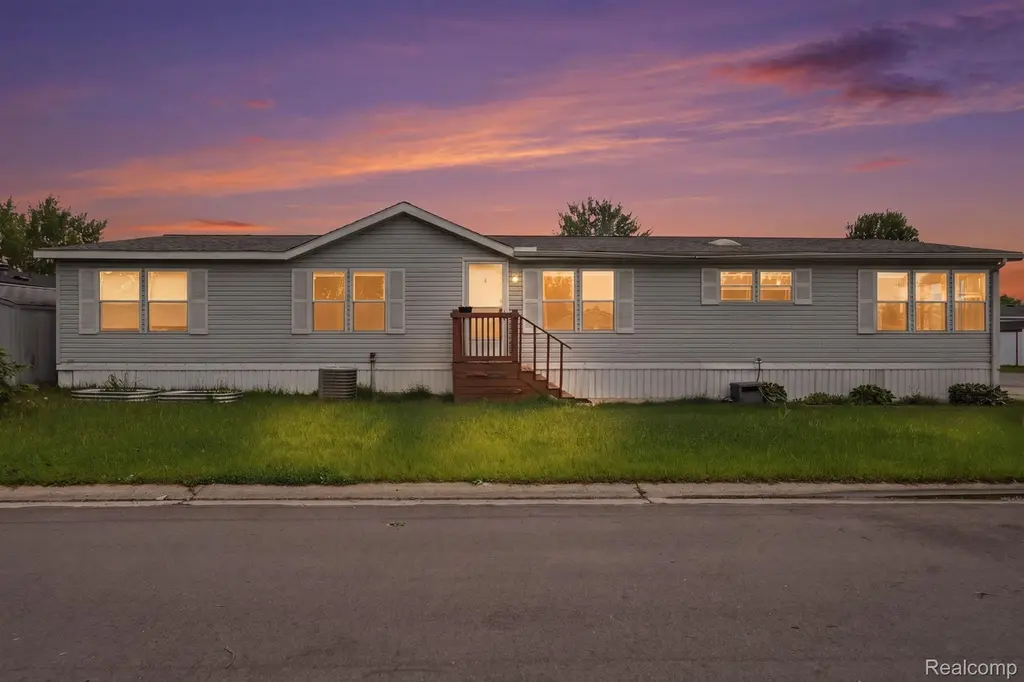
29585 Cambridge Ct · New Haven, MI
Flood risk No data
- FEMA flood zone
- —
- Chance of flooding over 30 yrs
- —
- Est. flood insurance / yr
- —
Fire risk No data
- Est. fire insurance / yr
- —
Heat risk No data
- Hot days now (above threshold)
- —
- Hot days in 30 yrs
- —
Wind risk No data
- Chance of severe wind over 30 yrs
- —
Air-quality risk No data
- Unhealthy air days now
- —
- Unhealthy air days in 30 yrs
- —
Risk factors via First Street. Map © Google.
Why this score? — see what drove the B grade
The composite is a weighted blend of 9 inputs, each scored 0–100. Each bar is that input's sub-score; the figure is the points it added to the 100-point composite (weight × sub-score).
- Cash flow +30.0/30.0
- 1% rule +10.0/10.0
- DSCR +10.0/10.0
- ARV discount +7.5/15.0
- Condition / age +3.8/5.0
- Schools +3.6/10.0
- Livability +2.9/5.0
- Rent growth +2.5/5.0
- Appreciation +0.0/10.0
$45,000
🖨 Deal sheet (PDF) 📄 Offer letter ✓ Due diligence
Listing remarks MLS
TURN-KEY & MOVE-IN READY! Immaculate 4-bedroom, 2-bath home showcasing true pride of ownership throughout. This spacious and inviting home offers an open floor plan, abundant natural light, oversized living areas, and generously sized bedrooms ideal for both relaxing and entertaining. The spacious kitchen provides plenty of cabinetry and functionality, while the thoughtfully designed layout offers comfort and convenience for everyday living. Meticulously maintained inside and out with immediate occupancy available. Clean, updated, and offering exceptional value in Chesterfield - this one will not last long! Schedule your private showing today!
Key facts
- 2,500 sq ft lot
- Built 1994
- Listed 29 days
Property features AI
Finance
- Other: Pets allowed with breed restrictions
Exterior
- Parking: Driveway only (no garage)
- Utilities: Public water; Public sewer
- Home design: Single-family residence; One level; Ground-level entry with steps
- Construction: Vinyl siding; Slab foundation; Built with traditional residential construction
- Exterior features: Paved road access; Lot dimensions approximately 50 x 50
Interior
- Bathrooms: Two full bathrooms
- Heating & cooling: Forced air heating (natural gas); No cooling
- Interior features: Seven total rooms
Neighborhood map
What this means for you Summary
Snapshot
- This is a 3-bed/2.0-bath single-family listed at $45k. Condition is rated good.
Deal economics
- At list price, monthly cash flow is $1k ($13k/yr) — positive.
- The deal already cash-flows at list — no discount required.
- Meets the 1% rule at list price ($2k rent vs $45k).
- Recommended offer: $44k (1.5% below list) — sets the bar for market timing.
- Cap rate 34.7% vs local median 4.1% in New Haven — top-decile yield for the area; either an underpriced asset or a hidden risk that comps aren't pricing in. Stress-test before assuming the spread holds.
Location & tenants
- Location reads 57/100 on livability (#650 in MI) — a working-class tenant base; expect higher turnover. Strengths: cost of living A+, housing A+, crime B; Watch: employment D, amenities F, commute F.
- L'Anse Creuse Public Schools (suburban): math 31% / reading 51% proficiency, ranked #184 of 540 in MI (top 34%) — families likely to look elsewhere, expect single-tenant / working-renter base with shorter leases.
- Market conditions: 142 active listings in the ZIP; 15 comparable units currently listed for rent nearby; rentals at typical pace (median 19d on market — plan ~3-4 weeks tenant-placement turnaround); 1,321 units permitted in Macomb County in 2024 (86 in 5+ unit buildings).
Forward outlook
- Local home prices are declining (-3.0%/yr); year-one equity from $311 of loan paydown is wiped out by about $1k of value loss. Plan a longer hold.
- Macomb County population projected at +9% by 2050 — modest demand growth; plan on rents tracking national, not racing it.
- At projected returns (-3.0% appreciation + 3.0% rent growth), your $13k cash investment doubles in ~2 years — after that, you're playing with house money.
Negotiation context
- It's been on market 30 days — a 2% lower offer ($44k) is reasonable based on typical stale-listing flexibility.
- 2 sale attempts; this cycle's ask has dropped $5k (10%) from the opening price — seller is motivated, your offer sets the floor, not the list.
Questions for the listing agent
- Is there a deadline driving the sale (1031 exchange, divorce, estate, relocation)? That informs how much negotiation room exists.
- What's the average days-on-market for RENTAL listings here right now (not sales)? A rising rental-DOM trend means longer vacancies and softer asking-rent achievability than the comps imply.
- What's the recent tenant-quality profile in this submarket — average credit score on applications, eviction rate, late-payment / NSF rate, and stable-employment percentage? A property-management company in the area should have these aggregated.
- How much new for-sale + rental construction is in the pipeline within 1–3 miles? Heavy new supply typically softens prices + rents 12–24 months out; constrained supply supports both.
Investment metrics
- 1% rule
- 3.87% ✓
- Cap rate
- 34.66%
- Cash-on-cash
- 101.31%
- DSCR
- 5.51
- GRM
- 2.2
CMA / ARV
- ARV (on-the-fly)
- $351,440
- Comps found
- 12
Show comp detail 12 sales within ~0.75 mi
| Address | Dist | Beds/Ba | Sqft | Sold | Price | $/sf | Match |
|---|---|---|---|---|---|---|---|
| 29397 Jennifer Dr | 0.36mi | 3/3.0 | 1,906 (+4%) | 3mo | $385,000 | $202 | 70 |
| 52823 Muirfield Dr | 0.38mi | 4/3.0 (+1) | 1,849 (+0%) | 7mo | $390,000 | $211 | 66 |
| 52159 Landsdowne Circle Ct | 0.36mi | 3/2.0 | 1,680 (-9%) | 7mo | $45,900 | $27 | 63 |
| 52854 Schafers Run Ct | 0.26mi | 3/2.5 | 2,069 (+12%) | 9mo | $430,000 | $208 | 58 |
| 50388 Corey Ave | 0.46mi | 3/2.5 | 1,699 (-8%) | 8mo | $324,900 | $191 | 57 |
| 30060 Hickey Rd | 0.63mi | 3/2.0 | 1,981 (+8%) | 1mo | $569,900 | $288 | 57 |
| 30455 Caroline Emily Rd | 0.49mi | 3/2.5 | 1,692 (-8%) | 7mo | $315,000 | $186 | 56 |
| 52263 Landsdowne Cir | 0.40mi | 4/2.0 (+1) | 1,680 (-9%) | 9mo | $45,000 | $27 | 54 |
| 30030 Hickey Rd | 0.62mi | 3/2.0 | 1,981 (+8%) | 8mo | $585,000 | $295 | 52 |
| 50371 Corey Ave Ave | 0.46mi | 4/3.5 (+1) | 2,017 (+10%) | 0mo | $299,990 | $149 | 52 |
| 50462 Theodore Ln | 0.50mi | 3/3.5 | 2,017 (+10%) | 4mo | $304,900 | $151 | 51 |
| 30510 Caroline Emily Dr Dr | 0.60mi | 3/2.5 | 1,649 (-10%) | 4mo | $295,000 | $179 | 50 |
Match score weights: distance 35% · size 25% · config 20% · recency 20%. Top-matched comps best support the ARV.
Projected returns pro-forma
-3.0% appreciation · 3.0% rent growth · sell at horizon
- IRR
- —
- Equity multiple
- 5.80×
- Total profit
- $60,485
- Equity at exit
- $6,710
- IRR
- —
- Equity multiple
- 12.11×
- Total profit
- $140,016
- Equity at exit
- $3,891
Cash invested: $12,600 (down + closing). Projections, not guarantees.
Landlord ↔ Tenant lean methodology
- Overall (STATE)
- 62 Landlord-Friendly
- State Michigan
- 62 Landlord-Friendly · EVEN
- County
- — inherits STATE
- City
- — inherits STATE
ZIP-level market 48051
- Home prices YoY
- -31.8%
- Active inventory
- 142
- Price-to-rent
- 2.2×
Monthly cashflow live
- Estimated rent
- $1,740 high interval (Pro) →
- Mortgage (P&I)
- −$236
- Tax est. 1.5%
- −$56 /mo · $675/yr
- Insurance
- −$19
- HOA
- −$0
- Vacancy / Maint / Mgmt
- −$365
- Net cashflow
- $1,064
Break-even live
Sensitivity live
| Price | -10% $1,095 | -5% $1,079 | +0% $1,064 | +5% $1,048 | +10% $1,033 |
|---|---|---|---|---|---|
| Rent | -10% $926 | -5% $995 | +0% $1,064 | +5% $1,132 | +10% $1,201 |
| Rate | -1.0pp $1,086 | -0.5pp $1,075 | base $1,064 | +0.5pp $1,052 | +1.0pp $1,040 |
UW: 25.0% down · 7.5% · 30yr · 1.5% tax · 5.0% vac · 8.0% maint · 8.0% mgmt
Financing live
Cash to close
- Down payment
- $11,250
- Closing costs
- $1,350
- Reserves months
- —
- Total cash needed
- —
Loan-product check · same deal, 3 products live
Conventional
25% down · 7.5% · 30yr
- Down + closing
- —
- Monthly P&I
- —
- Monthly cashflow
- —
- DSCR
- —
- Eligible?
- —
Personal DTI + credit; lowest rate.
DSCR
20% down · 8.5% · 30yr
- Down + closing
- —
- Monthly P&I
- —
- Monthly cashflow
- —
- DSCR
- —
- Eligible?
- —
No personal income docs; deal must DSCR.
Hard money
10% down · 12.0% · 12mo
- Down + closing
- —
- Monthly P&I
- —
- Monthly cashflow
- —
- DSCR
- —
- Eligible?
- —
Short-term bridge; refi at stabilization.
Rent comps 15 comps
| Address | Beds | Baths | Sqft | Rent | $/sqft | DOM | Units | Dist |
|---|---|---|---|---|---|---|---|---|
| 29652 Cambridge Ct Unit 253 New Baltimore, MI | 4.0 | 2.0 | 1680 | $1,729 | $1.03 | 0d | 1 | 0.05mi |
| 29638 Danbury Ct Unit 240 New Baltimore, MI | 4.0 | 2.0 | 1568 | $1,749 | $1.12 | 44d | 1 | 0.09mi |
| 29811 W Essex Ct Unit 114 New Baltimore, MI | 3.0 | 2.0 | 1456 | $1,729 | $1.19 | 44d | 1 | 0.15mi |
| 29909 Flushing Dr Unit 71 New Baltimore, MI | 3.0 | 2.0 | 1440 | $1,669 | $1.16 | 17d | 1 | 0.26mi |
| 52167 Williamsburg Ln Unit 355 New Baltimore, MI | 4.0 | 2.0 | 1680 | $1,739 | $1.04 | 44d | 1 | 0.34mi |
| 29805 Jamestown Dr Unit 435 New Baltimore, MI | 3.0 | 2.0 | 1344 | $1,739 | $1.29 | 0d | 1 | 0.37mi |
| 51602 Stern Ln New Baltimore, MI | 2.0 | 2.0 | 1562 | $1,775 | $1.14 | 17d | 1 | 0.82mi |
| 28346 Adler Park Dr S #246 Chesterfield, MI | 2.0 | 2.0 | 1332 | $1,750 | $1.31 | 44d | 1 | 0.83mi |
| 51590 Stern Ln New Baltimore, MI | 2.0 | 2.0 | 1562 | $1,535 | $0.98 | 3d | 1 | 0.83mi |
| 51596 Stern Ln New Baltimore, MI | 2.0 | 2.0 | 1550 | $1,790 | $1.15 | 19d | 1 | 0.83mi |
| 51590 Stern Ln New Baltimore, MI | 2.0 | 2.0 | 1562 | $1,535 | $0.98 | 0d | 1 | 0.83mi |
| 28218 S Pointe Ln New Baltimore, MI | 2.0 | 2.0 | 1427 | $1,850 | $1.30 | 6d | 1 | 0.89mi |
| 28218 S Pointe Ln New Baltimore, MI | 2.0 | 2.0 | 1425 | $2,100 | $1.47 | 25d | 1 | 0.89mi |
| 28220 Delano Dr New Baltimore, MI | 3.0 | 2.5 | 1600 | $1,895 | $1.18 | 25d | 1 | 1.03mi |
| 28260 Delano Dr New Baltimore, MI | 3.0 | 2.5 | 1600 | $1,850 | $1.16 | 44d | 1 | 1.04mi |
Listing history 18 events
-
2026-06-21days on market $45,000 Active 30 DOM
-
2026-06-19price $45,000 Active 27 DOM
-
2026-06-18days on market $50,000 Active 27 DOM
-
2026-06-17days on market $50,000 Active 26 DOM
-
2026-06-16days on market $50,000 Active 25 DOM
-
2026-06-15days on market $50,000 Active 24 DOM
-
2026-06-13days on market $50,000 Active 22 DOM
-
2026-06-13days on market $50,000 Active 21 DOM
-
2026-06-09days on market $50,000 Active 18 DOM
-
2026-06-08days on market $50,000 Active 17 DOM
-
2026-06-07days on market $50,000 Active 16 DOM
-
2026-06-04days on market $50,000 Active 13 DOM
-
2026-06-03days on market $50,000 Active 12 DOM
-
2026-06-02days on market $50,000 Active 11 DOM
-
2026-06-01days on market $50,000 Active 10 DOM
-
2026-05-31days on market $50,000 Active 9 DOM
-
2026-05-22$50,000 Active 659-char remark
Show marketing remark (659 chars)
TURN-KEY & MOVE-IN READY! Immaculate 4-bedroom, 2-bath home showcasing true pride of ownership throughout. This spacious and inviting home offers an open floor plan, abundant natural light, oversized living areas, and generously sized bedrooms ideal for both relaxing and entertaining. The spacious kitchen provides plenty of cabinetry and functionality, while the thoughtfully designed layout offers comfort and convenience for everyday living. Meticulously maintained inside and out with immediate occupancy available. Clean, updated, and offering exceptional value in Chesterfield - this one will not last long! Schedule your private showing today!
-
2026-05-22$50,000 Active
Show marketing remark (659 chars)
TURN-KEY & MOVE-IN READY! Immaculate 4-bedroom, 2-bath home showcasing true pride of ownership throughout. This spacious and inviting home offers an open floor plan, abundant natural light, oversized living areas, and generously sized bedrooms ideal for both relaxing and entertaining. The spacious kitchen provides plenty of cabinetry and functionality, while the thoughtfully designed layout offers comfort and convenience for everyday living. Meticulously maintained inside and out with immediate occupancy available. Clean, updated, and offering exceptional value in Chesterfield - this one will not last long! Schedule your private showing today!
ⓘ Source: listings_history table (triggers on properties + properties_extension) + one-shot
backfill from property_details.listing_events for pre-trigger history.
Nearby sold comps map
Loading sold comps map…
Walkable amenities ~0.75 mi
Loading nearby amenities…
Taxation est. · year 1
- Rental income
- $20,882
- − Mortgage interest
- −$2,521
- − Property taxes
- −$675
- − Insurance
- −$225
- − Repairs & maintenance
- −$1,671
- − Management
- −$1,671
- − Depreciation
- −$1,309
- Taxable income
- $12,811
- Est. tax owed @ 24.0%
- −$3,075
- After-tax cash flow
- $9,690/yr
For passive investors: Depreciation is non-cash, so a rental often shows a tax loss while cash-flowing — sheltering income. Rental losses are passive: they offset passive income freely, and up to $25,000/yr can offset ordinary (W-2) income if you actively participate and your MAGI is under $100k (phasing out to $0 by $150k); unused losses carry forward. On sale, claimed depreciation is recaptured at up to 25%, and gains may owe capital-gains tax (a 1031 exchange can defer both). Figures are a year-1 estimate at your 24.0% rate — not tax advice; consult a CPA.
Condition & rehab AI · 25 photos
This move-in ready home offers a spacious and inviting floor plan with modern updates and excellent curb appeal.
Value-add opportunities
- Resale paint exterior — enhances curb appeal
- Both update flooring — improves aesthetics and value
- Both install smart home features — attracts tech-savvy buyers
Renovation cost estimate screening
Value-add ROI direction
- Resale paint exterior — enhances curb appeal ↑
- Both update flooring — improves aesthetics and value ↑
- Both install smart home features — attracts tech-savvy buyers ↑
ⓘ Cost ranges are severity-bucket heuristics (US national rule-of-thumb). Get contractor quotes + a written scope before underwriting a rehab budget.
Schools (NCES district)
- District
- L'Anse Creuse Public Schools
- NCES district ID
- 2621870
- Math proficiency
- 31% ▼ -8.00%
- Reading proficiency
- 51% ▼ -2.00%
- Median HH income
- $57,757
- Composite
- 35.99/100
- National rank
- #4790
- State rank
- #184 of 540 in MI
Livability — New Haven
- Score
- 57/100
- State rank
- #650
- US rank
- #22110
Category grades
Schools grade is shown separately in the Schools card above.
Census & demographics
- City population
- 11,065
- Population (ZIP)
- 17,716
Population outlook (Macomb County) Hauer SSP2
- Today (2025)
- 925,296 people
- By 2030
- 948,226 · +2.5%
- By 2040
- 983,961 · +6.3%
- By 2050
- 1,010,200 · +9.2%
- By 2075
- 1,076,222 · +16.3%
- By 2100
- 1,077,065 · +16.4%
Race, ethnicity, and origin ACS 2023
- Neighborhood character
- Predominantly White (79%)
- Race & ethnicity
- White 79% Black 8% Two or more races 7% Hispanic / Latino 5%
- Common ancestry
- Romanian 18% Lithuanian 5% Slovak 1%
- Foreign-born
- 4% · Canada
- Languages at home
- 94% English-only · Spanish 4% Other Indo-European 1%
Political lean MEDSL · Macomb
- 2024 margin
- R (+13.7) · D 42.2% · R 55.9% · Other 1.9%
- 2008→2024 swing
- -22.3pp toward R · 2008: 8.6pp · 2024: -13.7pp
- All cycles
- 2024: R+13.7 2020: R+8.1 2016: R+11.6 2012: D+4.0 2008: D+8.6
Not yet ingested
- Civics
- —
Market trends
- HPI YoY
- ▼ -98.06%
- Current HPI
- 210.6017
- Rent YoY
- —
- Metro
- —
- State GDP YoY
- ▲ 1.37%
- F500 in state
- 28
Industry mix (Fortune 500 HQ in MI)
| Industry | F500 HQs | Revenue |
|---|---|---|
| Automotive Parts | 3 | $48B |
|
||
| Automotive | 2 | $372B |
|
||
| Chemicals | 1 | $45B |
|
||
| Automotive Retail | 1 | $29B |
|
||
| Healthcare / Medical Devices | 1 | $23B |
|
||
| Automotive Technology | 1 | $20B |
|
||
Price history
+0.0% since first listed2 events — show timeline
- 2026-05-22 Listed $50,000 REALCOMP
- 2026-05-22 Listed $50,000 MiRealSource-MiMLS
Cash-flow waterfall
monthlySold comps — $/sqft
last 12 mo · ≤1 miLoading sold comps…