 🌊 Lakefront
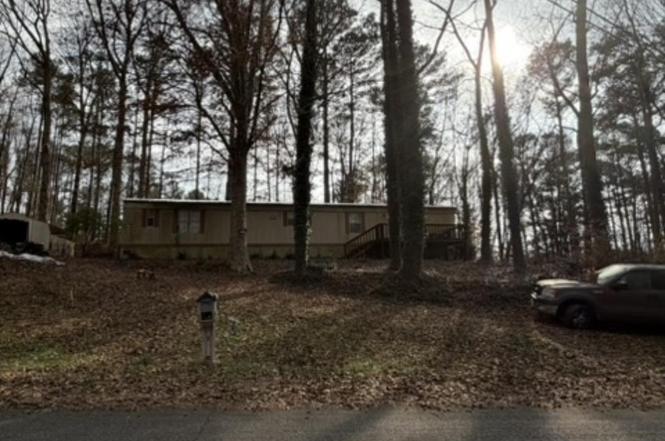
1069 Midway Estates Rd · Alexander City, AL
Flood risk 1/10 · Minimal
- FEMA flood zone
- X (unshaded)
- Chance of flooding over 30 yrs
- 0.0%
- Est. flood insurance / yr
- $507 – $1,088
Fire risk 5/10 · Moderate
- Est. fire insurance / yr
- $916 – $1,700
Heat risk 6/10 · Moderate
- Hot days now (above 107°F)
- 7 days/yr
- Hot days in 30 yrs
- 19 days/yr
Wind risk 6/10 · Moderate
- Chance of severe wind over 30 yrs
- 58.0%
Air-quality risk 1/10 · Minimal
- Unhealthy air days now
- 0 days/yr
- Unhealthy air days in 30 yrs
- 0 days/yr
Risk factors via First Street. Map © Google.
Why this score? — see what drove the B- grade
The composite is a weighted blend of 9 inputs, each scored 0–100. Each bar is that input's sub-score; the figure is the points it added to the 100-point composite (weight × sub-score).
- Cash flow +30.0/30.0
- 1% rule +10.0/10.0
- DSCR +10.0/10.0
- ARV discount +7.5/15.0
- Livability +2.8/5.0
- Rent growth +2.5/5.0
- Condition / age +2.5/5.0
- Schools +2.3/10.0
- Appreciation +0.0/10.0
$29,900
🖨 Deal sheet 📄 Offer letter ✓ Due diligence
Listing remarks
Attention investors and DIY enthusiasts! Multiple exit strategies: finish this remodel then either flip, rent or move in! Home being sold as is. Cash only.
Key facts
- 2.45 acre lot
- Built 1991
- Listed 47 days
Property features AI
Finance
- Other: Tax district: County
- Financial info: Down payment assistance available
- HOA & community: No subdivision or HOA listed
Exterior
- Parking: Off-street parking
- Security: No security features listed
- Utilities: Public water; Electric water heater; Internet availability unknown
- Home design: Existing structure; Single-story living areas (rooms listed at level 1)
- Construction: Siding (other) exterior; Pillars/support foundation
- Exterior features: Mountain view; No pool; No patio; No decks; Not on waterfront; Property sits on approximately 2.45 acres
Interior
- Kitchen: No kitchen appliance details provided
- Bedrooms: Two bedrooms on main level
- Flooring: Hardwood
- Bathrooms: Two full bathrooms (shared bath noted)
- Heating & cooling: Central heating; Central cooling
- Interior features: Hardwood floors; Ceilings: Other (see remarks); No additional interior features listed
- Laundry & utility: No laundry or utility appliance details provided
Neighborhood map
What this means for you Summary
Snapshot
- This is a 2-bed/2.0-bath manufactured listed at $30k.
Deal economics
- At list price, monthly cash flow is $516 ($6k/yr) — positive.
- The deal already cash-flows at list — no discount required.
- Meets the 1% rule at list price ($897 rent vs $30k).
- Recommended offer: $29k (3.0% below list) — sets the bar for market timing.
- Cap rate 27.0% vs local median 0.6% in Alexander City — top-decile yield for the area; either an underpriced asset or a hidden risk that comps aren't pricing in. Stress-test before assuming the spread holds.
Location & tenants
- Location reads 55/100 on livability (#426 in AL) — a working-class tenant base; expect higher turnover. Strengths: cost of living A+, housing A; Watch: crime F, amenities F, commute F.
- Alexander City (town): math 18% / reading 39% proficiency, ranked #77 of 129 in AL (top 60%) — low school quality limits family demand, transient renter base, plan for 1-2y turnover.
- Zoned schools: Jim Pearson Elementary School (772 students, 46% FRL); Benjamin Russell High School (math 17% / reading 22%, grade F, #169 of 305 statewide, top 59%, 812 students, 38% FRL).
- Market conditions: 74 active listings in the ZIP; 218 units permitted in Tallapoosa County in 2024 (0 in 5+ unit buildings).
Forward outlook
- Local home prices are declining (-3.0%/yr); year-one equity from $207 of loan paydown is wiped out by about $897 of value loss. Plan a longer hold.
- Tallapoosa County population projected at -22% by 2050 — secular population decline; favor cash flow + early exit over multi-decade hold.
- At projected returns (-3.0% appreciation + 3.0% rent growth), your $8k cash investment doubles in ~2 years — after that, you're playing with house money.
Negotiation context
- It's been on market 47 days — a 3% lower offer ($29k) is reasonable based on typical stale-listing flexibility.
Risks & watch-outs
- Climate carrying-cost: major wind risk, 58% chance of damaging wind over 30y; moderate wildfire risk; extreme-heat days projected 7→19/yr by 2055 (HVAC capex compounding) — expect insurance premiums to compound above CPI over the hold.
Questions for the listing agent
- It's been on market 47 days. Have you received any prior offers? Is the seller open to a 3% concession, seller financing, or rate buy-down credit?
- Is there a deadline driving the sale (1031 exchange, divorce, estate, relocation)? That informs how much negotiation room exists.
- Schools are F-rated, which usually means shorter tenancies and higher turnover. Who's the typical renter profile here, and what's been the actual vacancy rate?
- Crime grade is F in this area — have there been break-ins, vandalism, or insurance claims at this property in the last 3 years? What carrier currently insures it and at what premium?
- This sits on a lake — are riparian / water-frontage rights deeded with the parcel? Any dock permits, shoreline easements, or HOA water-use restrictions?
- What's the documented flood / surge / shoreline-erosion history here (FEMA AND non-FEMA — e.g., storm surge, creek backup, septic-field saturation)?
- Any water-quality or seasonal algae-bloom issues that affect tenant satisfaction or short-term-rental demand?
- What's the average days-on-market for RENTAL listings here right now (not sales)? A rising rental-DOM trend means longer vacancies and softer asking-rent achievability than the comps imply.
- What's the recent tenant-quality profile in this submarket — average credit score on applications, eviction rate, late-payment / NSF rate, and stable-employment percentage? A property-management company in the area should have these aggregated.
- How much new for-sale + rental construction is in the pipeline within 1–3 miles? Heavy new supply typically softens prices + rents 12–24 months out; constrained supply supports both.
Investment metrics
- 1% rule
- 3.00% ✓
- Cap rate
- 27.02%
- Cash-on-cash
- 74.01%
- DSCR
- 4.29
- GRM
- 2.8
CMA / ARV
No comps found within radius.
Projected returns pro-forma
-3.0% appreciation · 3.0% rent growth · sell at horizon
- IRR
- 73.8%
- Equity multiple
- 4.35×
- Total profit
- $28,045
- Equity at exit
- $4,458
- IRR
- 77.6%
- Equity multiple
- 8.98×
- Total profit
- $66,785
- Equity at exit
- $2,585
Cash invested: $8,372 (down + closing). Projections, not guarantees.
Landlord ↔ Tenant lean methodology
- Overall (STATE)
- 90 Strongly Landlord-Friendly
- State Alabama
- 90 Strongly Landlord-Friendly · R+15
- County
- — inherits STATE
- City
- — inherits STATE
ZIP-level market 36861
- Home prices YoY
- -15.1%
- Active inventory
- 74
- Price-to-rent
- 2.8×
Monthly cashflow live
- Estimated rent
- $897 medium interval (Pro) →
- Mortgage (P&I)
- −$157
- Tax from tax record
- −$23 /mo · $274/yr
- Insurance
- −$12
- HOA
- −$0
- Vacancy / Maint / Mgmt
- −$188
- Net cashflow
- $516
Break-even live
UW: 25.0% down · 7.5% · 30yr · 1.5% tax · 5.0% vac · 8.0% maint · 8.0% mgmt
Financing live
Cash to close
- Down payment
- $7,475
- Closing costs
- $897
- Reserves months
- —
- Total cash needed
- —
Loan-product check · same deal, 3 products live
Conventional
25% down · 7.5% · 30yr
- Down + closing
- —
- Monthly P&I
- —
- Monthly cashflow
- —
- DSCR
- —
- Eligible?
- —
Personal DTI + credit; lowest rate.
DSCR
20% down · 8.5% · 30yr
- Down + closing
- —
- Monthly P&I
- —
- Monthly cashflow
- —
- DSCR
- —
- Eligible?
- —
No personal income docs; deal must DSCR.
Hard money
10% down · 12.0% · 12mo
- Down + closing
- —
- Monthly P&I
- —
- Monthly cashflow
- —
- DSCR
- —
- Eligible?
- —
Short-term bridge; refi at stabilization.
Listing history 6 events
-
2026-04-20status Pending
-
2026-04-10price $29,900
-
2026-03-25price $39,900
-
2026-03-10price $49,900
-
2026-03-06price $59,900
-
2026-03-04$69,900 Active
ⓘ Source: listings_history table (triggers on properties + properties_extension) + one-shot
backfill from property_details.listing_events for pre-trigger history.
Tax reassessment forecast AL · Resets to sale price
- Current annual tax
- $274 · $23/mo
- Projected year-2 tax
- $274 · $23/mo
- Expected delta
- $0/yr ($0/mo · 0.0%)
ⓘ Screening estimate from a state-policy table — verify with the county assessor before closing.
Climate risk First Street
- Flood 1/10 Low FEMA zone X (unshaded) · 0% chance over 30 yrs
- Wildfire 5/10 Major
- Heat 6/10 Major 7 d/yr ≥107°F today · 19 d/yr by 30 yrs out
- Wind 6/10 Major 58% chance of damaging wind over 30 yrs
- Air quality 1/10 Low 0 unhealthy d/yr today · 0 by 30 yrs out
Nearby sold comps map
Loading sold comps map…
Walkable amenities ~0.75 mi
Loading nearby amenities…
Taxation est. · year 1
- Rental income
- $10,761
- − Mortgage interest
- −$1,675
- − Property taxes
- −$274
- − Insurance
- −$150
- − Repairs & maintenance
- −$861
- − Management
- −$861
- − Depreciation
- −$870
- Taxable income
- $6,071
- Est. tax owed @ 24.0%
- −$1,457
- After-tax cash flow
- $4,739/yr
For passive investors: Depreciation is non-cash, so a rental often shows a tax loss while cash-flowing — sheltering income. Rental losses are passive: they offset passive income freely, and up to $25,000/yr can offset ordinary (W-2) income if you actively participate and your MAGI is under $100k (phasing out to $0 by $150k); unused losses carry forward. On sale, claimed depreciation is recaptured at up to 25%, and gains may owe capital-gains tax (a 1031 exchange can defer both). Figures are a year-1 estimate at your 24.0% rate — not tax advice; consult a CPA.
Schools (NCES district)
- District
- Alexander City
- NCES district ID
- 0100030
- Math proficiency
- 18% ▼ -25.00%
- Reading proficiency
- 39% ▲ 1.00%
- Median HH income
- $35,482
- Composite
- 23.49/100
- National rank
- #7871
- State rank
- #77 of 129 in AL
Livability — Alexander City
- Score
- 55/100
- State rank
- #426
- US rank
- #23127
Category grades
Schools grade is shown separately in the Schools card above.
Census & demographics
- Census place
- Alexander City, AL
- City population
- 19,619
- Population (ZIP)
- 2,805
Population outlook (Tallapoosa County) Hauer SSP2
- Today (2025)
- 38,909 people
- By 2030
- 37,413 · -3.8%
- By 2040
- 33,935 · -12.8%
- By 2050
- 30,467 · -21.7%
- By 2075
- 22,716 · -41.6%
- By 2100
- 15,167 · -61.0%
Race, ethnicity, and origin ACS 2023
- Neighborhood character
- Predominantly White (77%)
- Race & ethnicity
- White 77% Black 11% Two or more races 8% Native American 4%
- Common ancestry
- Serbian 3% Lithuanian 2% Italian 1%
- Foreign-born
- 0% · South Korea
- Languages at home
- 99% English-only · Spanish 1%
Political lean MEDSL · Tallapoosa
- 2024 margin
- Solid R (+49.6) · D 24.9% · R 74.5%
- 2008→2024 swing
- -13.1pp toward R · 2008: -36.5pp · 2024: -49.6pp
- All cycles
- 2024: R+49.6 2020: R+43.4 2016: R+41.6 2012: R+32.4 2008: R+36.5
Not yet ingested
- Civics
- —
Market trends
- HPI YoY
- ▼ -49.69%
- Current HPI
- 280.1383
- Rent YoY
- —
- Metro
- —
- State GDP YoY
- ▲ 2.94%
- F500 in state
- 4
Industry mix (Fortune 500 HQ in AL)
| Industry | F500 HQs | Revenue |
|---|---|---|
| Financial Services | 1 | $8B |
|
||
| Healthcare | 1 | $5B |
|
||
Price history
-57.2% since first listed6 events — show timeline
- 2026-04-20 Pending — Greater Alabama MLS
- 2026-04-10 Price Changed $29,900 Greater Alabama MLS
- 2026-03-25 Price Changed $39,900 Greater Alabama MLS
- 2026-03-10 Price Changed $49,900 Greater Alabama MLS
- 2026-03-06 Price Changed $59,900 Greater Alabama MLS
- 2026-03-04 Listed $69,900 Greater Alabama MLS
Property tax history
+6.5%/yrLatest (2025): $274 · +51.5% YoY. Source: county tax records.
Cash-flow waterfall
monthlySold comps — $/sqft
last 12 mo · ≤1 miLoading sold comps…