5974 Evergreen Ln · Bootjack, CA
Flood risk 1/10 · Minimal
- FEMA flood zone
- X (unshaded)
- Chance of flooding over 30 yrs
- 0.0%
- Est. flood insurance / yr
- $507 – $1,088
Fire risk 8/10 · Major
- Est. fire insurance / yr
- $659 – $1,223
Heat risk 4/10 · Minor
- Hot days now (above 99°F)
- 9 days/yr
- Hot days in 30 yrs
- 24 days/yr
Wind risk 1/10 · Minimal
- Chance of severe wind over 30 yrs
- —
Air-quality risk 10/10 · Severe
- Unhealthy air days now
- 48 days/yr
- Unhealthy air days in 30 yrs
- 55 days/yr
Risk factors via First Street. Map © Google.
Why this score? — see what drove the B- grade
The composite is a weighted blend of 9 inputs, each scored 0–100. Each bar is that input's sub-score; the figure is the points it added to the 100-point composite (weight × sub-score).
- Cash flow +30.0/30.0
- DSCR +10.0/10.0
- 1% rule +9.1/10.0
- ARV discount +7.5/15.0
- Condition / age +3.8/5.0
- Schools +3.0/10.0
- Rent growth +2.5/5.0
- Livability +2.4/5.0
- Appreciation +0.0/10.0
$249,000
🖨 Deal sheet 📄 Offer letter ✓ Due diligence
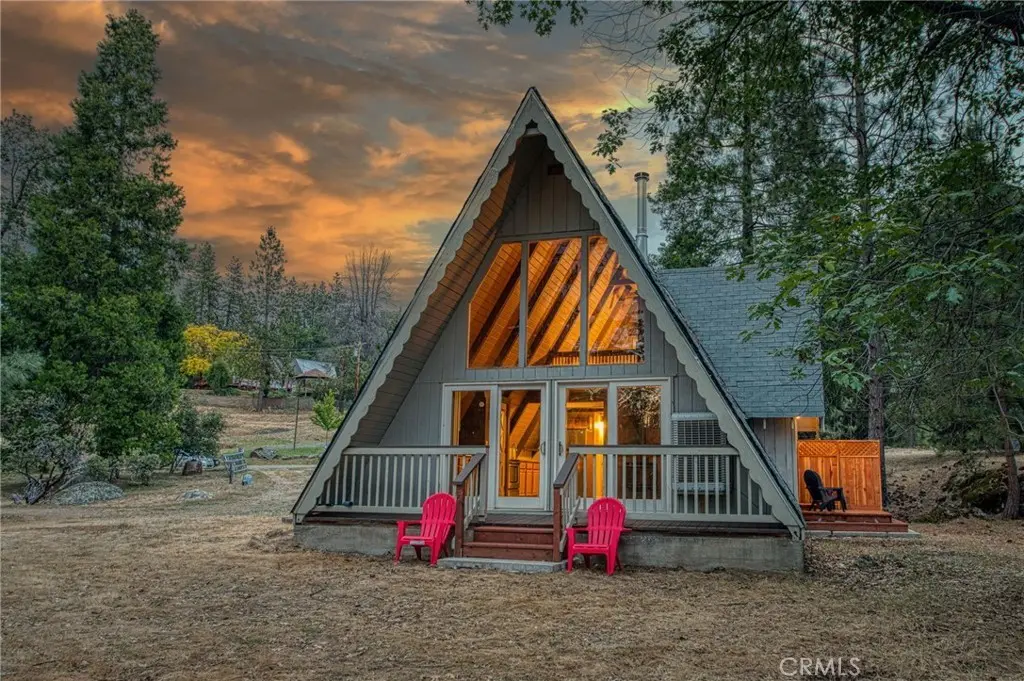
Listing remarks
Tucked away in the trees of beautiful Mariposa, this charming A-frame in Lushmeadows offers the perfect blend of rustic character and thoughtful updates. Located in a quiet neighborhood, this is your chance to own a cozy mountain retreat with the kind of peaceful setting people come to Mariposa to find. The main level features 1 bedroom, 1 bathroom, and approximately 740 sq ft of living space, while the 340 sq ft loft adds extra flexibility for guests, a home office, or additional sleeping space. The vaulted ceilings and classic cabin feel make the home feel larger than its footprint suggests. Recent improvements include granite countertops in both the kitchen and bathroom, a newer wood-bur
Key facts
- Thoughtful updates
- Vaulted ceilings
- Granite countertops
Tags
Property features AI
Finance
- Other: Neighborhood features: horse trails, biking, hiking, fishing, BLM/National Forest access, lake, park
- HOA & community: Part of Lushmeadows Mountain Estates association; Annual association fee of $180; Community amenities include hiking trails, playground, clubhouse, picnic area, barbecue and other shared spaces
Exterior
- Parking: On-site parking; Driveway; RV potential
- Utilities: Septic tank; Well (private); Electricity connected; Water connected
- Home design: House; Two stories; Entry level 1; Main-level entry
- Construction: Composition roof; Concrete slab foundation; Built date from assessor
- Exterior features: Covered wood porch; Patio/porch; Shed; Partial barbed wire fencing; Pasture and gentle slope; 0-1 unit/acre lot; Has view; Access via county road
Interior
- Kitchen: Granite counters; Refrigerator; Electric range; Electric oven; Water heater unit
- Bedrooms: Main floor primary bedroom; Primary bedroom plus loft
- Flooring: Wood flooring; Laminate flooring
- Bathrooms: One full bathroom with shower and granite counters; Primary bathroom
- Heating & cooling: Wood stove heating; Wall/window cooling; Evaporative cooling
- Interior features: Beamed ceilings; Balcony; Granite counters; Two levels; Main entry on the main level
- Laundry & utility: Laundry room inside; Utility room
Neighborhood map
What this means for you Summary
Snapshot
- This is a 1-bed/1.0-bath single-family listed at $249k. Condition is rated good.
Deal economics
- At list price, monthly cash flow is $1k ($12k/yr) — positive.
- The deal already cash-flows at list — no discount required.
- Meets the 1% rule at list price ($4k rent vs $249k).
- Recommended offer: $245k (1.5% below list) — sets the bar for market timing.
- Cap rate 11.3% vs local median 3.4% in Bootjack — top-decile yield for the area; either an underpriced asset or a hidden risk that comps aren't pricing in. Stress-test before assuming the spread holds.
Location & tenants
- Location reads 48/100 on livability (#1,203 in CA) — a working-class tenant base; expect higher turnover. Strengths: housing B; Watch: employment C-, crime F, amenities F.
- Mariposa County Unified (rural): math 27% / reading 42% proficiency, ranked #282 of 517 in CA (top 54%) — families likely to look elsewhere, expect single-tenant / working-renter base with shorter leases.
- Market conditions: 167 active listings in the ZIP; 1 comparable units currently listed for rent nearby; 89 units permitted in Mariposa County in 2024 (0 in 5+ unit buildings).
Forward outlook
- Local home prices are declining (-3.0%/yr); year-one equity from $2k of loan paydown is wiped out by about $7k of value loss. Plan a longer hold.
- Mariposa County population projected at -23% by 2050 — secular population decline; favor cash flow + early exit over multi-decade hold.
- At projected returns (-3.0% appreciation + 3.0% rent growth), your $70k cash investment doubles in ~7 years — after that, you're playing with house money.
Negotiation context
- It's been on market 18 days — a 2% lower offer ($245k) is reasonable based on typical stale-listing flexibility.
Risks & watch-outs
- Climate carrying-cost: severe wildfire risk — expect insurance premiums to compound above CPI over the hold.
Questions for the listing agent
- Built in 1963 — when were the roof, HVAC, electrical panel, plumbing, and water heater last replaced?
- What does the HOA fee cover, when was the last increase, and are there any pending special assessments or reserve-fund shortfalls?
- Is there a deadline driving the sale (1031 exchange, divorce, estate, relocation)? That informs how much negotiation room exists.
- Crime grade is F in this area — have there been break-ins, vandalism, or insurance claims at this property in the last 3 years? What carrier currently insures it and at what premium?
- What's the average days-on-market for RENTAL listings here right now (not sales)? A rising rental-DOM trend means longer vacancies and softer asking-rent achievability than the comps imply.
- What's the recent tenant-quality profile in this submarket — average credit score on applications, eviction rate, late-payment / NSF rate, and stable-employment percentage? A property-management company in the area should have these aggregated.
- How much new for-sale + rental construction is in the pipeline within 1–3 miles? Heavy new supply typically softens prices + rents 12–24 months out; constrained supply supports both.
Investment metrics
- 1% rule
- 1.41% ✓
- Cap rate
- 11.25%
- Cash-on-cash
- 17.71%
- DSCR
- 1.79
- GRM
- 5.9
CMA / ARV
No comps found within radius.
Projected returns pro-forma
-3.0% appreciation · 3.0% rent growth · sell at horizon
- IRR
- 9.2%
- Equity multiple
- 1.36×
- Total profit
- $25,265
- Equity at exit
- $37,127
- IRR
- 18.4%
- Equity multiple
- 2.53×
- Total profit
- $106,660
- Equity at exit
- $21,529
Cash invested: $69,720 (down + closing). Projections, not guarantees.
Landlord ↔ Tenant lean methodology
- Overall (STATE)
- 18 Strongly Tenant-Friendly
- State California
- 18 Strongly Tenant-Friendly · D+13
- County
- — inherits STATE
- City
- — inherits STATE
ZIP-level market 95338
- Active inventory
- 167
- Price-to-rent
- 5.9×
Monthly cashflow live
- Estimated rent
- $3,500 medium interval (Pro) →
- Mortgage (P&I)
- −$1,306
- Tax est. 1.5%
- −$311 /mo · $3,735/yr
- Insurance
- −$104
- HOA
- −$15
- Vacancy / Maint / Mgmt
- −$735
- Net cashflow
- $1,029
Break-even live
UW: 25.0% down · 7.5% · 30yr · 1.5% tax · 5.0% vac · 8.0% maint · 8.0% mgmt
Financing live
Cash to close
- Down payment
- $62,250
- Closing costs
- $7,470
- Reserves months
- —
- Total cash needed
- —
Loan-product check · same deal, 3 products live
Conventional
25% down · 7.5% · 30yr
- Down + closing
- —
- Monthly P&I
- —
- Monthly cashflow
- —
- DSCR
- —
- Eligible?
- —
Personal DTI + credit; lowest rate.
DSCR
20% down · 8.5% · 30yr
- Down + closing
- —
- Monthly P&I
- —
- Monthly cashflow
- —
- DSCR
- —
- Eligible?
- —
No personal income docs; deal must DSCR.
Hard money
10% down · 12.0% · 12mo
- Down + closing
- —
- Monthly P&I
- —
- Monthly cashflow
- —
- DSCR
- —
- Eligible?
- —
Short-term bridge; refi at stabilization.
Rent comps 1 comps
| Address | Beds | Baths | Sqft | Rent | $/sqft | DOM | Units | Dist |
|---|---|---|---|---|---|---|---|---|
| 6106 Smither Rd Mariposa, CA | 2.0 | 2.0 | 1474 | $3,500 | $2.37 | 43d | 1 | 0.92mi |
HOA detail
- Monthly dues
- $15 · $180/yr
Listing history 14 events
-
2026-06-16days on market $249,000 Active 18 DOM
-
2026-06-15days on market $249,000 Active 17 DOM
-
2026-06-14days on market $249,000 Active 15 DOM
-
2026-06-13days on market $249,000 Active 14 DOM
-
2026-06-10days on market $249,000 Active 12 DOM
-
2026-06-09days on market $249,000 Active 11 DOM
-
2026-06-08days on market $249,000 Active 10 DOM
-
2026-06-07days on market $249,000 Active 9 DOM
-
2026-06-05days on market $249,000 Active 6 DOM
-
2026-06-03days on market $249,000 Active 5 DOM
-
2026-06-02days on market $249,000 Active 4 DOM
-
2026-06-01days on market $249,000 Active 3 DOM
-
2026-05-31days on market $249,000 Active 2 DOM
-
2026-05-29$249,000 Active
ⓘ Source: listings_history table (triggers on properties + properties_extension) + one-shot
backfill from property_details.listing_events for pre-trigger history.
Climate risk First Street
- Flood 1/10 Low FEMA zone X (unshaded) · 0% chance over 30 yrs
- Wildfire 8/10 Severe
- Heat 4/10 Moderate 9 d/yr ≥99°F today · 24 d/yr by 30 yrs out
- Wind 1/10 Low
- Air quality 10/10 Extreme 48 unhealthy d/yr today · 55 by 30 yrs out
Nearby sold comps map
Loading sold comps map…
Walkable amenities ~0.75 mi
Loading nearby amenities…
Taxation est. · year 1
- Rental income
- $42,000
- − Mortgage interest
- −$13,948
- − Property taxes
- −$3,735
- − Insurance
- −$1,245
- − Repairs & maintenance
- −$3,360
- − Management
- −$3,360
- − HOA
- −$180
- − Depreciation
- −$7,244
- Taxable income
- $8,928
- Est. tax owed @ 24.0%
- −$2,143
- After-tax cash flow
- $10,208/yr
For passive investors: Depreciation is non-cash, so a rental often shows a tax loss while cash-flowing — sheltering income. Rental losses are passive: they offset passive income freely, and up to $25,000/yr can offset ordinary (W-2) income if you actively participate and your MAGI is under $100k (phasing out to $0 by $150k); unused losses carry forward. On sale, claimed depreciation is recaptured at up to 25%, and gains may owe capital-gains tax (a 1031 exchange can defer both). Figures are a year-1 estimate at your 24.0% rate — not tax advice; consult a CPA.
Condition & rehab AI · 13 photos
This charming A-frame cabin in Mariposa is in good condition with recent updates, offering a cozy mountain retreat with a peaceful setting.
Value-add opportunities
- Resale paint exterior — enhances curb appeal
- Both trim trees — improves curb appeal and reduces maintenance
- Both landscaping — enhances curb appeal and adds value
Renovation cost estimate screening
Value-add ROI direction
- Resale paint exterior — enhances curb appeal ↑
- Both trim trees — improves curb appeal and reduces maintenance ↑
- Both landscaping — enhances curb appeal and adds value ↑
ⓘ Cost ranges are severity-bucket heuristics (US national rule-of-thumb). Get contractor quotes + a written scope before underwriting a rehab budget.
Schools (NCES district)
- District
- Mariposa County Unified
- NCES district ID
- 0623940
- Math proficiency
- 27% ▼ -12.00%
- Reading proficiency
- 42% ▼ -5.00%
- Median HH income
- $48,669
- Composite
- 29.75/100
- National rank
- #6438
- State rank
- #282 of 517 in CA
Livability — Bootjack
- Score
- 48/100
- State rank
- #1203
- US rank
- #26092
Category grades
Schools grade is shown separately in the Schools card above.
Census & demographics
- Population (ZIP)
- 10,164
Population outlook (Mariposa County) Hauer SSP2
- Today (2025)
- 15,956 people
- By 2030
- 15,078 · -5.5%
- By 2040
- 13,413 · -15.9%
- By 2050
- 12,232 · -23.3%
- By 2075
- 11,143 · -30.2%
- By 2100
- 10,187 · -36.2%
Race, ethnicity, and origin ACS 2023
- Neighborhood character
- Predominantly White (81%)
- Race & ethnicity
- White 81% Two or more races 9% Hispanic / Latino 9% Native American 2% Asian 2%
- Hispanic origin (detail)
- Mexican 7%
- Common ancestry
- Lithuanian 5% Italian 4% Russian 2%
- Foreign-born
- 4% · Canada, China
- Languages at home
- 95% English-only · Spanish 2% French/Haitian/Cajun 1% Chinese 1%
Political lean MEDSL · Mariposa
- 2024 margin
- Strong R (+21.1) · D 38.1% · R 59.1% · Other 2.8%
- 2008→2024 swing
- -8.6pp toward R · 2008: -12.4pp · 2024: -21.1pp
- All cycles
- 2024: R+21.1 2020: R+18.1 2016: R+23.2 2012: R+17.4 2008: R+12.4
Not yet ingested
- Civics
- —
Market trends
- HPI YoY
- ▼ -151.82%
- Current HPI
- 140.3045
- Rent YoY
- —
- Metro
- —
- State GDP YoY
- ▲ 3.21%
- F500 in state
- 116
Industry mix (Fortune 500 HQ in CA)
| Industry | F500 HQs | Revenue |
|---|---|---|
| Technology | 27 | $1,492B |
|
||
| Financial Services | 3 | $174B |
|
||
| Retail | 3 | $44B |
|
||
| Insurance | 3 | $26B |
|
||
| Media / Entertainment | 2 | $115B |
|
||
| Pharmaceuticals / Biotech | 2 | $62B |
|
||
Price history
1 event — show timeline
- 2026-05-29 Listed $249,000 CRMLS
Cash-flow waterfall
monthlySold comps — $/sqft
last 12 mo · ≤1 miLoading sold comps…