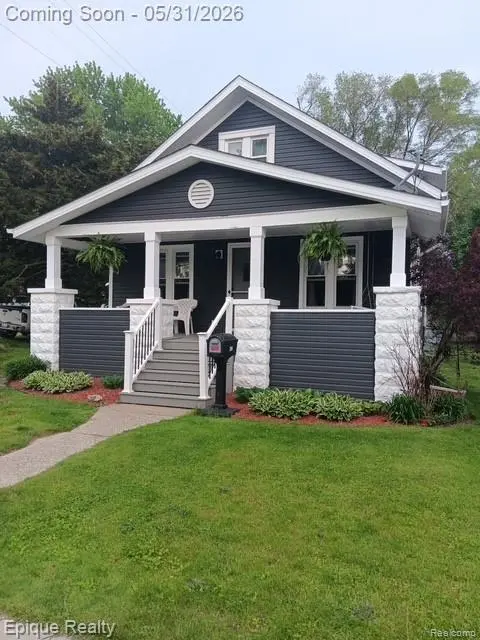
204 E Wood St · Yale, MI
Flood risk 1/10 · Minimal
- FEMA flood zone
- X (unshaded)
- Chance of flooding over 30 yrs
- 0.0%
- Est. flood insurance / yr
- $473 – $860
Fire risk 1/10 · Minimal
- Est. fire insurance / yr
- $784 – $1,456
Heat risk 2/10 · Minimal
- Hot days now (above 95°F)
- 7 days/yr
- Hot days in 30 yrs
- 14 days/yr
Wind risk 1/10 · Minimal
- Chance of severe wind over 30 yrs
- —
Air-quality risk 3/10 · Minor
- Unhealthy air days now
- 2 days/yr
- Unhealthy air days in 30 yrs
- 4 days/yr
Risk factors via First Street. Map © Google.
Why this score? — see what drove the D- grade
The composite is a weighted blend of 9 inputs, each scored 0–100. Each bar is that input's sub-score; the figure is the points it added to the 100-point composite (weight × sub-score).
- Cash flow +15.3/30.0
- DSCR +4.7/10.0
- Schools +4.4/10.0
- 1% rule +3.4/10.0
- Livability +3.3/5.0
- Rent growth +2.5/5.0
- Condition / age +2.5/5.0
- ARV discount +1.7/15.0
- Appreciation +0.0/10.0
$180,000
🖨 Deal sheet (PDF) 📄 Offer letter ✓ Due diligence
Listing remarks MLS
Move right in! 4BR, 1.5 bath bungalow-style charmer has great woodwork and gas fireplace in LR. Newer windows, completely updated electric and copper plumbing, kitchen cabines, bath fixtures, floorcoverings and newly finished wood flooring. Fenced yard, 1-car garage, deep basement. All freshly painted and sparkling! Quality renovations throughout! Land Contract Terms possible.
Key facts
- 7,841 sq ft lot
- Garage
- Built 1935
Property features AI
Exterior
- Parking: Detached garage with space for 1 car
- Utilities: Public water; Natural gas heating (forced air)
- Home design: Residential 2-story home; Built in 1935; Basement level present
- Construction: Vinyl siding exterior; Basement foundation; Built in 1935
- Exterior features: Vinyl siding; Paved street access; Approximately 0.18 acre lot with 53' frontage
Interior
- Bedrooms: Entry-level bedroom (11 x 10) with wood floors; Second-level bedroom (10 x 10) with wood floors; Second-level bedroom (approx. 11' wide) with wood floors; Second-level bedroom (10 x 12) with wood floors
- Flooring: Wood flooring in bedrooms; Vinyl flooring in one bathroom; Linoleum flooring in one lavatory
- Bathrooms: Two total baths (one full bathroom and one lavatory); Entry-level bathroom (8 x 7) with vinyl flooring; Second-level lavatory (9 x 5) with linoleum flooring
- Heating & cooling: Forced air heating; Natural gas fuel
- Interior features: Total of 6 rooms; Unfinished basement
Neighborhood map
What this means for you Summary
Snapshot
- This is a 4-bed/1.5-bath single-family listed at $180k.
Deal economics
- At list price, monthly cash flow is $67 ($810/yr) — positive.
- The deal already cash-flows at list — no discount required.
- To meet the 1% rule (rent ≥ 1% of price), the offer needs to be $152k (15.7% below list).
- Recommended offer: $152k (15.7% below list) — sets the bar for 1% rule.
- Cap rate 6.7% vs local median 3.5% in Yale — top-decile yield for the area; either an underpriced asset or a hidden risk that comps aren't pricing in. Stress-test before assuming the spread holds.
Location & tenants
- Location reads 66/100 on livability (#432 in MI) — a middle-class / working-renter tenant base. Strengths: cost of living A+, housing A+; Watch: amenities F, commute F, employment F.
- Yale Public Schools (rural): math 40% / reading 62% proficiency, ranked #92 of 540 in MI (top 17%) — acceptable for families but not a draw, mixed tenant base, ~2y average lease.
- Zoned schools: Yale Elementary School (math 47% / reading 57%, grade C-, #328 of 1,397 statewide, top 26%, 341 students, 62% FRL); Yale Junior High School (math 36% / reading 65%, grade C, #110 of 493 statewide, top 23%, 381 students, 48% FRL); Yale Senior High School (math 32% / reading 62%, grade D-, #187 of 713 statewide, top 29%, 551 students, 38% FRL) — zoned schools average 49% FRL vs 33% district-wide (16 pts higher); higher-poverty schools than district average — tighter screening recommended.
- Market conditions: 48 active listings in the ZIP; 232 units permitted in St. Clair County in 2024 (0 in 5+ unit buildings).
Forward outlook
- Local home prices are declining (-3.0%/yr); year-one equity from $1k of loan paydown is wiped out by about $5k of value loss. Plan a longer hold.
- St. Clair County population projected at -20% by 2050 — secular population decline; favor cash flow + early exit over multi-decade hold.
Negotiation context
- Only 7 days on market — expect competitive offers; lowballing is unlikely to land.
- 7 sale attempts since 20y ago; this cycle's ask is 201% above the opening price — seller raised mid-cycle; expect resistance to lowballs.
- Current owner paid $60k; list at $180k implies a 201% gain — meaningful room to come down on a strong offer.
Risks & watch-outs
- Watch-outs: built in 1935 — expect roof / HVAC / electrical / plumbing capex.
Questions for the listing agent
- Built in 1935 — when were the roof, HVAC, electrical panel, plumbing, and water heater last replaced?
- Is there a deadline driving the sale (1031 exchange, divorce, estate, relocation)? That informs how much negotiation room exists.
- Schools are B-rated — typically a magnet for longer-tenancy family renters. What's the average tenant stay here, and is there a school-zone premium baked into asking?
- The area grade is low — what's the realistic commute time and amenity access for the typical tenant pool here? Any planned neighborhood developments (good or bad) we should know about?
- What's the average days-on-market for RENTAL listings here right now (not sales)? A rising rental-DOM trend means longer vacancies and softer asking-rent achievability than the comps imply.
- What's the recent tenant-quality profile in this submarket — average credit score on applications, eviction rate, late-payment / NSF rate, and stable-employment percentage? A property-management company in the area should have these aggregated.
- How much new for-sale + rental construction is in the pipeline within 1–3 miles? Heavy new supply typically softens prices + rents 12–24 months out; constrained supply supports both.
Investment metrics
- 1% rule
- 0.84% ✗
- Cap rate
- 6.74%
- Cash-on-cash
- 1.61%
- DSCR
- 1.07
- GRM
- 9.9
CMA / ARV
- ARV (on-the-fly)
- $159,600
- Comps found
- 9
Show comp detail 9 sales within ~0.75 mi
| Address | Dist | Beds/Ba | Sqft | Sold | Price | $/sf | Match |
|---|---|---|---|---|---|---|---|
| 304 Jones St | 0.23mi | 3/1.0 (-1) | 1,263 (+5%) | 9mo | $170,500 | $135 | 66 |
| 125 Clark St | 0.46mi | 3/1.0 (-1) | 1,188 (-1%) | 6mo | $235,000 | $198 | 65 |
| 206 S Kennefic St | 0.10mi | 3/1.0 (-1) | 1,114 (-7%) | 21mo | $45,000 | $40 | 58 |
| 102 Jean St | 0.46mi | 3/1.0 (-1) | 1,316 (+10%) | 0mo | $375,000 | $285 | 55 |
| 206 Arthur St | 0.44mi | 3/1.0 (-1) | 1,353 (+13%) | 4mo | $180,000 | $133 | 48 |
| 302 N Kennefic St | 0.53mi | 3/1.0 (-1) | 1,288 (+7%) | 10mo | $50,000 | $39 | 47 |
| 107 Morrell St | 0.42mi | 4/1.0 | 1,300 (+8%) | 21mo | $195,000 | $150 | 47 |
| 219 Clark St | 0.55mi | 3/2.0 (-1) | 1,352 (+13%) | 0mo | $180,000 | $133 | 46 |
| 106 W 2nd St | 0.59mi | 3/1.0 (-1) | 1,272 (+6%) | 15mo | $156,000 | $123 | 42 |
Match score weights: distance 35% · size 25% · config 20% · recency 20%. Top-matched comps best support the ARV.
Projected returns pro-forma
-3.0% appreciation · 3.0% rent growth · sell at horizon
- IRR
- -13.8%
- Equity multiple
- 0.51×
- Total profit
- $-24,915
- Equity at exit
- $26,839
- IRR
- -5.0%
- Equity multiple
- 0.68×
- Total profit
- $-16,346
- Equity at exit
- $15,563
Cash invested: $50,400 (down + closing). Projections, not guarantees.
Landlord ↔ Tenant lean methodology
- Overall (STATE)
- 62 Landlord-Friendly
- State Michigan
- 62 Landlord-Friendly · EVEN
- County
- — inherits STATE
- City
- — inherits STATE
ZIP-level market 48097
- Home prices YoY
- -17.5%
- Active inventory
- 48
- Price-to-rent
- 9.9×
Monthly cashflow live
- Estimated rent
- $1,518 medium interval (Pro) →
- Mortgage (P&I)
- −$944
- Tax from tax record
- −$113 /mo · $1,356/yr
- Insurance
- −$75
- HOA
- −$0
- Vacancy / Maint / Mgmt
- −$319
- Net cashflow
- $67
Break-even live
Sensitivity live
| Price | -10% $169 | -5% $118 | +0% $67 | +5% $17 | +10% $-34 |
|---|---|---|---|---|---|
| Rent | -10% $-52 | -5% $8 | +0% $67 | +5% $127 | +10% $187 |
| Rate | -1.0pp $158 | -0.5pp $113 | base $67 | +0.5pp $21 | +1.0pp $-27 |
UW: 25.0% down · 7.5% · 30yr · 1.5% tax · 5.0% vac · 8.0% maint · 8.0% mgmt
Financing live
Cash to close
- Down payment
- $45,000
- Closing costs
- $5,400
- Reserves months
- —
- Total cash needed
- —
Loan-product check · same deal, 3 products live
Conventional
25% down · 7.5% · 30yr
- Down + closing
- —
- Monthly P&I
- —
- Monthly cashflow
- —
- DSCR
- —
- Eligible?
- —
Personal DTI + credit; lowest rate.
DSCR
20% down · 8.5% · 30yr
- Down + closing
- —
- Monthly P&I
- —
- Monthly cashflow
- —
- DSCR
- —
- Eligible?
- —
No personal income docs; deal must DSCR.
Hard money
10% down · 12.0% · 12mo
- Down + closing
- —
- Monthly P&I
- —
- Monthly cashflow
- —
- DSCR
- —
- Eligible?
- —
Short-term bridge; refi at stabilization.
Listing history 25 events
-
2026-06-13statusdays on market $180,000 Pending 7 DOM
-
2026-06-10status $180,000 Active 5 DOM
-
2026-06-04statusdays on market $180,000 Pending 5 DOM
-
2026-06-03days on market $180,000 Active 4 DOM
-
2026-06-02days on market $180,000 Active 3 DOM
-
2026-06-01days on market $180,000 Active 2 DOM
-
2026-05-31statusdays on market $180,000 Active 1 DOM
-
2026-05-27historical $180,000
-
2018-03-01soldstatus $59,900
-
2010-09-14soldstatus $59,900 379-char remark
Show marketing remark (379 chars)
Move right in! 4BR, 1.5 bath bungalow-style charmer has great woodwork and gas fireplace in LR. Newer windows, completely updated electric and copper plumbing, kitchen cabines, bath fixtures, floorcoverings and newly finished wood flooring. Fenced yard, 1-car garage, deep basement. All freshly painted and sparkling! Quality renovations throughout! Land Contract Terms possible.
-
2010-08-06historical 379-char remark
Show marketing remark (379 chars)
Move right in! 4BR, 1.5 bath bungalow-style charmer has great woodwork and gas fireplace in LR. Newer windows, completely updated electric and copper plumbing, kitchen cabines, bath fixtures, floorcoverings and newly finished wood flooring. Fenced yard, 1-car garage, deep basement. All freshly painted and sparkling! Quality renovations throughout! Land Contract Terms possible.
-
2010-04-15$59,900 379-char remark
Show marketing remark (379 chars)
Move right in! 4BR, 1.5 bath bungalow-style charmer has great woodwork and gas fireplace in LR. Newer windows, completely updated electric and copper plumbing, kitchen cabines, bath fixtures, floorcoverings and newly finished wood flooring. Fenced yard, 1-car garage, deep basement. All freshly painted and sparkling! Quality renovations throughout! Land Contract Terms possible.
-
2008-11-21soldstatus $19,000
-
2008-11-21soldstatus $19,000
-
2008-11-13historical
-
2008-07-08$19,900
-
2008-07-08$19,900
-
2007-07-23historical
-
2007-07-23historical
-
2007-02-20$78,000
-
2007-02-20$78,000
-
2006-10-30historical
-
2006-10-30historical
-
2006-06-12$93,000
-
2006-06-12$93,000
ⓘ Source: listings_history table (triggers on properties + properties_extension) + one-shot
backfill from property_details.listing_events for pre-trigger history.
Tax reassessment forecast MI · Partial reset (capped growth)
- Current annual tax
- $1,356 · $113/mo
- Projected year-2 tax
- $2,064 · $172/mo
- Expected delta
- +$708/yr (+$59/mo · 52.2%)
ⓘ Screening estimate from a state-policy table — verify with the county assessor before closing.
Climate risk First Street
- Flood 1/10 Low FEMA zone X (unshaded) · 0% chance over 30 yrs
- Wildfire 1/10 Low
- Heat 2/10 Low 7 d/yr ≥95°F today · 14 d/yr by 30 yrs out
- Wind 1/10 Low
- Air quality 3/10 Moderate 2 unhealthy d/yr today · 4 by 30 yrs out
Nearby sold comps map
Loading sold comps map…
Walkable amenities ~0.75 mi
Loading nearby amenities…
Taxation est. · year 1
- Rental income
- $18,219
- − Mortgage interest
- −$10,083
- − Property taxes
- −$1,356
- − Insurance
- −$900
- − Repairs & maintenance
- −$1,458
- − Management
- −$1,458
- − Depreciation
- −$5,236
- Taxable loss
- −$2,271
- Est. tax savings @ 24.0%
- +$545
- After-tax cash flow
- $1,355/yr
For passive investors: Depreciation is non-cash, so a rental often shows a tax loss while cash-flowing — sheltering income. Rental losses are passive: they offset passive income freely, and up to $25,000/yr can offset ordinary (W-2) income if you actively participate and your MAGI is under $100k (phasing out to $0 by $150k); unused losses carry forward. On sale, claimed depreciation is recaptured at up to 25%, and gains may owe capital-gains tax (a 1031 exchange can defer both). Figures are a year-1 estimate at your 24.0% rate — not tax advice; consult a CPA.
Schools (NCES district)
- District
- Yale Public Schools
- NCES district ID
- 2636600
- Math proficiency
- 40% ▼ -11.00%
- Reading proficiency
- 62% ▼ -8.00%
- Median HH income
- $53,116
- Composite
- 43.83/100
- National rank
- #2926
- State rank
- #92 of 540 in MI
Livability — Yale
- Score
- 66/100
- State rank
- #432
- US rank
- #12026
Category grades
Schools grade is shown separately in the Schools card above.
Census & demographics
- Census place
- Yale, MI
- County
- Saint Clair County · 44,760 people
- City population
- 5,418
- Metro
- Detroit-Warren-Dearborn, MI
- Population (ZIP)
- 5,418
- Household income
- $63,659
- Rent vs Own
- Severe rent burden
- 94.0
Population outlook (St. Clair County) Hauer SSP2
- Today (2025)
- 154,587 people
- By 2030
- 150,031 · -2.9%
- By 2040
- 138,177 · -10.6%
- By 2050
- 124,390 · -19.5%
- By 2075
- 95,825 · -38.0%
- By 2100
- 68,672 · -55.6%
Race, ethnicity, and origin ACS 2023
- Neighborhood character
- Predominantly White (95%)
- Race & ethnicity
- White 95% Two or more races 3% Hispanic / Latino 3%
- Common ancestry
- Romanian 9% Slovak 4% Lithuanian 3%
- Foreign-born
- 1% · Canada
- Languages at home
- 98% English-only · Spanish 1%
Political lean MEDSL · St. Clair
- 2024 margin
- Solid R (+34.6) · D 32.0% · R 66.6% · Other 1.4%
- 2008→2024 swing
- -37.3pp toward R · 2008: 2.6pp · 2024: -34.6pp
- All cycles
- 2024: R+34.6 2020: R+30.2 2016: R+31.4 2012: R+7.1 2008: D+2.6
Not yet ingested
- Civics
- —
Market trends
- HPI YoY
- ▼ -52.26%
- Current HPI
- 246.4218
- Rent YoY
- —
- Metro
- Detroit-Warren-Dearborn, MI
- State GDP YoY
- ▲ 1.37%
- F500 in state
- 28
Industry mix (Fortune 500 HQ in MI)
| Industry | F500 HQs | Revenue |
|---|---|---|
| Automotive Parts | 3 | $48B |
|
||
| Automotive | 2 | $372B |
|
||
| Chemicals | 1 | $45B |
|
||
| Automotive Retail | 1 | $29B |
|
||
| Healthcare / Medical Devices | 1 | $23B |
|
||
| Automotive Technology | 1 | $20B |
|
||
Price history
+93.5% since first listed18 events — show timeline
- 2026-05-27 Coming Soon $180,000 MiRealSource-MiMLS
- 2018-03-01 Sold (Public Records) $59,900 Public Records
- 2010-09-14 Sold (MLS) $59,900 MiRealSource-MiMLS
- 2010-08-06 Listing Removed — MiRealSource-MiMLS
- 2010-04-15 Listed $59,900 MiRealSource-MiMLS
- 2008-11-21 Sold (MLS) $19,000 MiRealSource-MiMLS
- 2008-11-21 Sold (MLS) $19,000 REALCOMP
- 2008-11-13 Listing Removed — MiRealSource-MiMLS
- 2008-07-08 Listed $19,900 MiRealSource-MiMLS
- 2008-07-08 Listed $19,900 REALCOMP
- 2007-07-23 Listing Removed — REALCOMP
- 2007-07-23 Listing Removed — MiRealSource-MiMLS
- 2007-02-20 Listed $78,000 REALCOMP
- 2007-02-20 Listed $78,000 MiRealSource-MiMLS
- 2006-10-30 Listing Removed — MiRealSource-MiMLS
- 2006-10-30 Listing Removed — REALCOMP
- 2006-06-12 Listed $93,000 MiRealSource-MiMLS
- 2006-06-12 Listed $93,000 REALCOMP
Property tax history
+2.8%/yrLatest (2025): $1,356 · +4.0% YoY. Source: county tax records.
Cash-flow waterfall
monthlySold comps — $/sqft
last 12 mo · ≤1 miLoading sold comps…