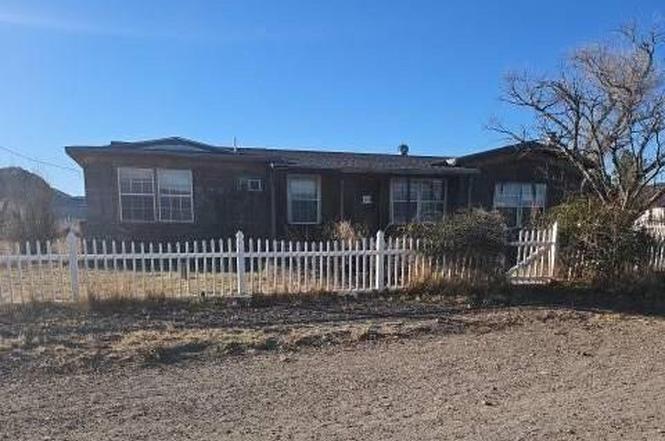
602 Copperhead Ln · Fort Davis, TX
Flood risk 1/10 · Minimal
- FEMA flood zone
- —
- Chance of flooding over 30 yrs
- 0.0%
- Est. flood insurance / yr
- —
Fire risk 10/10 · Severe
- Est. fire insurance / yr
- $1,222 – $2,270
Heat risk 4/10 · Minor
- Hot days now (above 95°F)
- 7 days/yr
- Hot days in 30 yrs
- 18 days/yr
Wind risk 1/10 · Minimal
- Chance of severe wind over 30 yrs
- —
Air-quality risk 2/10 · Minimal
- Unhealthy air days now
- 1 days/yr
- Unhealthy air days in 30 yrs
- 1 days/yr
Risk factors via First Street. Map © Google.
Why this score? — see what drove the B grade
The composite is a weighted blend of 9 inputs, each scored 0–100. Each bar is that input's sub-score; the figure is the points it added to the 100-point composite (weight × sub-score).
- Cash flow +28.9/30.0
- DSCR +10.0/10.0
- 1% rule +8.8/10.0
- ARV discount +7.5/15.0
- Appreciation +6.0/10.0
- Schools +3.1/10.0
- Livability +2.9/5.0
- Rent growth +2.5/5.0
- Condition / age +2.5/5.0
$79,900
🖨 Deal sheet 📄 Offer letter ✓ Due diligence
Listing remarks
Single-story residential property featuring 2 bedrooms and 2 bathrooms with a functional layout. Interior spaces receive natural light and are arranged with defined living and sleeping areas. Covered parking is provided by a detached two-car carport. The lot includes outdoor space suitable for general use. Located within Fort Davis with access to local services and regional routes.
Key facts
- Covered parking
- Natural light
- Functional layout
Tags
Property features AI
Exterior
- Parking: Detached carport with 2 spaces
- Utilities: Public water; Septic tank sewer
- Home design: Single-family residence; One-story
- Construction: Frame construction; Slab foundation; Composition roof; Built as residential single family
- Exterior features: Patio; Wood fencing; Shed(s)
Interior
- Kitchen: Dishwasher; Range
- Flooring: Tile
- Bathrooms: 2 full bathrooms
- Heating & cooling: Central heating (electric); Central air conditioning
- Interior features: Ceiling fan(s); Tile flooring; Electric water heater
Neighborhood map
What this means for you Summary
Snapshot
- This is a 2-bed/2.0-bath single-family listed at $80k.
Deal economics
- At list price, monthly cash flow is $271 ($3k/yr) — positive.
- The deal already cash-flows at list — no discount required.
- Meets the 1% rule at list price ($1k rent vs $80k).
- Recommended offer: $73k (9.0% below list) — sets the bar for market timing.
Location & tenants
- Location reads 57/100 on livability (#1,258 in TX) — a working-class tenant base; expect higher turnover. Strengths: cost of living A+, housing A+, crime A; Watch: schools F, amenities F, commute F.
- Ft Davis ISD (rural): math 30% / reading 35% proficiency, ranked #942 of 1,141 in TX (top 83%) — families likely to look elsewhere, expect single-tenant / working-renter base with shorter leases.
- Market conditions: 74 active listings in the ZIP.
Forward outlook
- In year one you build about $2k of equity ($552 loan paydown + $2k appreciation (2.0% local appreciation)).
- Jeff Davis County population projected at -28% by 2050 — secular population decline; favor cash flow + early exit over multi-decade hold.
- At projected returns (2.0% appreciation + 3.0% rent growth), your $22k cash investment doubles in ~4 years — after that, you're playing with house money.
Negotiation context
- It's been on market 111 days — a 9% lower offer ($73k) is reasonable based on typical stale-listing flexibility.
Risks & watch-outs
- Climate carrying-cost: severe wildfire risk — expect insurance premiums to compound above CPI over the hold.
Questions for the listing agent
- It's been on market 111 days. Have you received any prior offers? Is the seller open to a 9% concession, seller financing, or rate buy-down credit?
- Why hasn't it sold? Are there any deal-killer items the seller is aware of (foundation, flood, title, zoning, code violations)?
- Is there a deadline driving the sale (1031 exchange, divorce, estate, relocation)? That informs how much negotiation room exists.
- Schools are F-rated, which usually means shorter tenancies and higher turnover. Who's the typical renter profile here, and what's been the actual vacancy rate?
- What's the average days-on-market for RENTAL listings here right now (not sales)? A rising rental-DOM trend means longer vacancies and softer asking-rent achievability than the comps imply.
- What's the recent tenant-quality profile in this submarket — average credit score on applications, eviction rate, late-payment / NSF rate, and stable-employment percentage? A property-management company in the area should have these aggregated.
- How much new for-sale + rental construction is in the pipeline within 1–3 miles? Heavy new supply typically softens prices + rents 12–24 months out; constrained supply supports both.
Investment metrics
- 1% rule
- 1.38% ✓
- Cap rate
- 10.37%
- Cash-on-cash
- 14.55%
- DSCR
- 1.65
- GRM
- 6.1
CMA / ARV
No comps found within radius.
Projected returns pro-forma
2.0% appreciation · 3.0% rent growth · sell at horizon
- IRR
- 18.9%
- Equity multiple
- 2.02×
- Total profit
- $22,801
- Equity at exit
- $31,521
- IRR
- 21.1%
- Equity multiple
- 3.79×
- Total profit
- $62,406
- Equity at exit
- $45,395
Cash invested: $22,372 (down + closing). Projections, not guarantees.
Landlord ↔ Tenant lean methodology
- Overall (STATE)
- 87 Strongly Landlord-Friendly
- State Texas
- 87 Strongly Landlord-Friendly · R+5
- County
- — inherits STATE
- City
- — inherits STATE
ZIP-level market 79734
- Home prices YoY
- 1.9%
- Active inventory
- 74
- Price-to-rent
- 6.1×
Monthly cashflow live
- Estimated rent
- $1,100 medium interval (Pro) →
- Mortgage (P&I)
- −$419
- Tax from tax record
- −$146 /mo · $1,747/yr
- Insurance
- −$33
- HOA
- −$0
- Vacancy / Maint / Mgmt
- −$231
- Net cashflow
- $271
Break-even live
UW: 25.0% down · 7.5% · 30yr · 1.5% tax · 5.0% vac · 8.0% maint · 8.0% mgmt
Financing live
Cash to close
- Down payment
- $19,975
- Closing costs
- $2,397
- Reserves months
- —
- Total cash needed
- —
Loan-product check · same deal, 3 products live
Conventional
25% down · 7.5% · 30yr
- Down + closing
- —
- Monthly P&I
- —
- Monthly cashflow
- —
- DSCR
- —
- Eligible?
- —
Personal DTI + credit; lowest rate.
DSCR
20% down · 8.5% · 30yr
- Down + closing
- —
- Monthly P&I
- —
- Monthly cashflow
- —
- DSCR
- —
- Eligible?
- —
No personal income docs; deal must DSCR.
Hard money
10% down · 12.0% · 12mo
- Down + closing
- —
- Monthly P&I
- —
- Monthly cashflow
- —
- DSCR
- —
- Eligible?
- —
Short-term bridge; refi at stabilization.
Listing history 9 events
-
2026-05-07status Pending
-
2026-04-24price $79,900
-
2026-04-09price $89,900
-
2026-03-27price $99,900
-
2026-03-12price $109,900
-
2026-02-28price $114,900
-
2026-02-18price $124,900
-
2026-01-16$134,900 Active
-
2003-11-06soldstatus
ⓘ Source: listings_history table (triggers on properties + properties_extension) + one-shot
backfill from property_details.listing_events for pre-trigger history.
Tax reassessment forecast TX · Resets to sale price
- Current annual tax
- $1,747 · $146/mo
- Projected year-2 tax
- $1,747 · $146/mo
- Expected delta
- $0/yr ($0/mo · 0.0%)
ⓘ Screening estimate from a state-policy table — verify with the county assessor before closing.
Climate risk First Street
- Flood 1/10 Low 0% chance over 30 yrs
- Wildfire 10/10 Extreme
- Heat 4/10 Moderate 7 d/yr ≥95°F today · 18 d/yr by 30 yrs out
- Wind 1/10 Low
- Air quality 2/10 Low 1 unhealthy d/yr today · 1 by 30 yrs out
Nearby sold comps map
Loading sold comps map…
Walkable amenities ~0.75 mi
Loading nearby amenities…
Taxation est. · year 1
- Rental income
- $13,201
- − Mortgage interest
- −$4,476
- − Property taxes
- −$1,747
- − Insurance
- −$400
- − Repairs & maintenance
- −$1,056
- − Management
- −$1,056
- − Depreciation
- −$2,324
- Taxable income
- $2,142
- Est. tax owed @ 24.0%
- −$514
- After-tax cash flow
- $2,740/yr
For passive investors: Depreciation is non-cash, so a rental often shows a tax loss while cash-flowing — sheltering income. Rental losses are passive: they offset passive income freely, and up to $25,000/yr can offset ordinary (W-2) income if you actively participate and your MAGI is under $100k (phasing out to $0 by $150k); unused losses carry forward. On sale, claimed depreciation is recaptured at up to 25%, and gains may owe capital-gains tax (a 1031 exchange can defer both). Figures are a year-1 estimate at your 24.0% rate — not tax advice; consult a CPA.
Schools (NCES district)
- District
- Ft Davis ISD
- NCES district ID
- 4820100
- Math proficiency
- 30% ▬ 0.00%
- Reading proficiency
- 35% ▬ 0.00%
- Median HH income
- $48,341
- Composite
- 30.84/100
- National rank
- #11376
- State rank
- #942 of 1141 in TX
Livability — Fort Davis
- Score
- 57/100
- State rank
- #1258
- US rank
- #21905
Category grades
Schools grade is shown separately in the Schools card above.
Census & demographics
- Census place
- Fort Davis, TX
- Population (ZIP)
- 1,616
Population outlook (Jeff Davis County) Hauer SSP2
- Today (2025)
- 2,052 people
- By 2030
- 1,942 · -5.4%
- By 2040
- 1,710 · -16.7%
- By 2050
- 1,478 · -28.0%
- By 2075
- 957 · -53.4%
- By 2100
- 727 · -64.6%
Race, ethnicity, and origin ACS 2023
- Neighborhood character
- Predominantly White (70%)
- Race & ethnicity
- White 70% Hispanic / Latino 27% Two or more races 24%
- Hispanic origin (detail)
- Mexican 27%
- Common ancestry
- Portuguese 3% Serbian 2% Lithuanian 1%
- Foreign-born
- 14% · Canada
- Languages at home
- 75% English-only · Spanish 22% German/W. Germanic 1% Russian/Polish/Slavic 1%
Political lean MEDSL · Jeff Davis
- 2024 margin
- Strong R (+21.3) · D 38.5% · R 59.8% · Other 1.7%
- 2008→2024 swing
- +1.4pp toward D · 2008: -22.7pp · 2024: -21.3pp
- All cycles
- 2024: R+21.3 2020: R+21.7 2016: R+23.1 2012: R+23.3 2008: R+22.7
Not yet ingested
- Civics
- —
Market trends
- HPI YoY
- ▲ 2.00%
- Current HPI
- 105.8311
- Rent YoY
- —
- Metro
- —
- State GDP YoY
- ▲ 3.95%
- F500 in state
- 110
Industry mix (Fortune 500 HQ in TX)
| Industry | F500 HQs | Revenue |
|---|---|---|
| Energy | 16 | $1,198B |
|
||
| Technology | 5 | $198B |
|
||
| Engineering / Construction | 4 | $72B |
|
||
| Energy Services | 3 | $60B |
|
||
| Utilities | 3 | $41B |
|
||
| Healthcare | 2 | $330B |
|
||
Price history
-40.8% since first listed9 events — show timeline
- 2026-05-07 Pending — PBBOR
- 2026-04-24 Price Changed $79,900 PBBOR
- 2026-04-09 Price Changed $89,900 PBBOR
- 2026-03-27 Price Changed $99,900 PBBOR
- 2026-03-12 Price Changed $109,900 PBBOR
- 2026-02-28 Price Changed $114,900 PBBOR
- 2026-02-18 Price Changed $124,900 PBBOR
- 2026-01-16 Listed $134,900 PBBOR
- 2003-11-06 Sold (Public Records) — Public Records
Property tax history
+4.7%/yrLatest (2025): $1,747 · -0.8% YoY. Source: county tax records.
Cash-flow waterfall
monthlySold comps — $/sqft
last 12 mo · ≤1 miLoading sold comps…