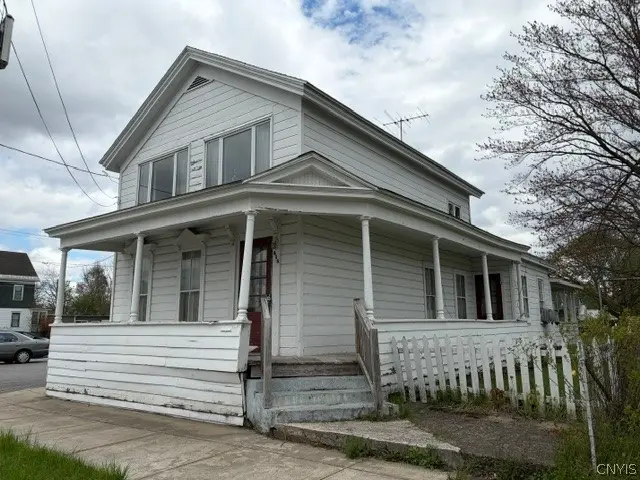
418 Roberts St · Rome, NY
Flood risk 1/10 · Minimal
- FEMA flood zone
- X (unshaded)
- Chance of flooding over 30 yrs
- 0.0%
- Est. flood insurance / yr
- $473 – $860
Fire risk 1/10 · Minimal
- Est. fire insurance / yr
- $691 – $1,283
Heat risk 3/10 · Minor
- Hot days now (above 94°F)
- 7 days/yr
- Hot days in 30 yrs
- 17 days/yr
Wind risk 1/10 · Minimal
- Chance of severe wind over 30 yrs
- —
Air-quality risk 2/10 · Minimal
- Unhealthy air days now
- 0 days/yr
- Unhealthy air days in 30 yrs
- 1 days/yr
Risk factors via First Street. Map © Google.
Why this score? — see what drove the B+ grade
The composite is a weighted blend of 9 inputs, each scored 0–100. Each bar is that input's sub-score; the figure is the points it added to the 100-point composite (weight × sub-score).
- Cash flow +30.0/30.0
- ARV discount +15.0/15.0
- DSCR +10.0/10.0
- 1% rule +9.6/10.0
- Schools +3.5/10.0
- Livability +3.2/5.0
- Rent growth +2.5/5.0
- Condition / age +2.5/5.0
- Appreciation +0.0/10.0
$99,900
🖨 Deal sheet 📄 Offer letter ✓ Due diligence
Listing remarks MLS
Calling all investors and entrepreneurs! Now offered at a newly reduced price of $99,900, this property presents an outstanding opportunity for those looking to create value—whether as a business venture or an income-generating investment. With a brand-new roof installed in 2024, you’ll have peace of mind as you bring your renovation vision to life. The first floor offers a practical layout with two bedrooms, a den, and a full bathroom—ready for updates and modernization. Upstairs features a spacious additional living area along with a second bathroom, opening the door for expanded rental potential or a flexible multi-level setup. With strong upside and versatile possibilities, this property is perfectly suited for investors seeking to build equity or establish a business presence in a growing Rome neighborhood. Taxes include water, sewer, and trash pickup—adding even more value to this already compelling opportunity.
Key facts
- Brand-new roof
- Functional layout
- 4,356 sq ft lot
Tags
Neighborhood map
What this means for you Summary
Snapshot
- This is a 3-bed/1.0-bath single-family listed at $100k.
Deal economics
- At list price, monthly cash flow is $492 ($6k/yr) — positive.
- The deal already cash-flows at list — no discount required.
- Meets the 1% rule at list price ($1k rent vs $100k).
- Recommended offer: $88k (12.0% below list) — sets the bar for market timing.
- Cap rate 12.2% vs local median 5.6% in Rome — top-decile yield for the area; either an underpriced asset or a hidden risk that comps aren't pricing in. Stress-test before assuming the spread holds.
Location & tenants
- Location reads 64/100 on livability (#722 in NY) — a middle-class / working-renter tenant base. Strengths: cost of living A+, housing A+; Watch: health & safety C-, schools F, amenities F.
- Rome City School District (town): math 35% / reading 46% proficiency, ranked #516 of 590 in NY (top 88%) — families likely to look elsewhere, expect single-tenant / working-renter base with shorter leases.
- Market conditions: 272 active listings in the ZIP; 3 comparable units currently listed for rent nearby; rentals lingering (median 44d on market — plan ~5-8 weeks vacancy on turnover, expect pricing pressure); 100% of comp listings sitting > 30 days — soft ceiling on asking rent; 204 units permitted in Oneida County in 2024 (68 in 5+ unit buildings).
Forward outlook
- Local home prices are declining (-3.0%/yr); year-one equity from $691 of loan paydown is wiped out by about $3k of value loss. Plan a longer hold.
- Oneida County population projected at -12% by 2050 — secular population decline; favor cash flow + early exit over multi-decade hold.
- At projected returns (-3.0% appreciation + 3.0% rent growth), your $28k cash investment doubles in ~6 years — after that, you're playing with house money.
Negotiation context
- It's been on market 180 days — a 12% lower offer ($88k) is reasonable based on typical stale-listing flexibility.
Risks & watch-outs
- Watch-outs: built in 1879 — expect roof / HVAC / electrical / plumbing capex.
Questions for the listing agent
- It's been on market 180 days. Have you received any prior offers? Is the seller open to a 12% concession, seller financing, or rate buy-down credit?
- Built in 1879 — when were the roof, HVAC, electrical panel, plumbing, and water heater last replaced?
- Why hasn't it sold? Are there any deal-killer items the seller is aware of (foundation, flood, title, zoning, code violations)?
- Is there a deadline driving the sale (1031 exchange, divorce, estate, relocation)? That informs how much negotiation room exists.
- Schools are F-rated, which usually means shorter tenancies and higher turnover. Who's the typical renter profile here, and what's been the actual vacancy rate?
- What's the average days-on-market for RENTAL listings here right now (not sales)? A rising rental-DOM trend means longer vacancies and softer asking-rent achievability than the comps imply.
- What's the recent tenant-quality profile in this submarket — average credit score on applications, eviction rate, late-payment / NSF rate, and stable-employment percentage? A property-management company in the area should have these aggregated.
- How much new for-sale + rental construction is in the pipeline within 1–3 miles? Heavy new supply typically softens prices + rents 12–24 months out; constrained supply supports both.
Investment metrics
- 1% rule
- 1.46% ✓
- Cap rate
- 12.20%
- Cash-on-cash
- 21.11%
- DSCR
- 1.94
- GRM
- 5.7
CMA / ARV
- ARV (median comp)
- $135,543
- List price
- $99,900
- Delta
- -26.30%
- Verdict
- UNDERPRICED
- Comps
- 20 within 1.0 mi
Show comp detail 12 sales within ~0.75 mi
| Address | Dist | Beds/Ba | Sqft | Sold | Price | $/sf | Match |
|---|---|---|---|---|---|---|---|
| 117 E Embargo St | 0.08mi | 3/2.0 | 1,458 (-11%) | 1mo | $70,000 | $48 | 74 |
| 715 Floyd Ave | 0.44mi | 3/1.5 | 1,623 (-0%) | 5mo | $200,000 | $123 | 72 |
| 204 Pleasant Ave | 0.24mi | 4/2.5 (+1) | 1,708 (+5%) | 2mo | $256,500 | $150 | 68 |
| 517 Roberts St | 0.09mi | 4/2.0 (+1) | 1,421 (-13%) | 6mo | $95,000 | $67 | 60 |
| 319 Mohawk St | 0.41mi | 4/2.0 (+1) | 1,551 (-5%) | 5mo | $159,900 | $103 | 59 |
| 638 Chatham St | 0.30mi | 3/2.0 | 1,449 (-11%) | 8mo | $180,094 | $124 | 57 |
| 402 N Jay St | 0.60mi | 3/1.5 | 1,737 (+7%) | 3mo | $149,900 | $86 | 56 |
| 805 Valentine Ave | 0.53mi | 2/2.0 (-1) | 1,564 (-4%) | 6mo | $235,000 | $150 | 54 |
| 617 N Jay St | 0.70mi | 3/2.0 | 1,681 (+3%) | 8mo | $180,000 | $107 | 52 |
| 114 Balsam St | 0.46mi | 3/1.0 | 1,400 (-14%) | 8mo | $185,000 | $132 | 49 |
| 304 Mohawk St | 0.41mi | 3/2.5 | 1,402 (-14%) | 5mo | $50,000 | $36 | 47 |
| 811 Harding Blvd | 0.64mi | 3/2.0 | 1,470 (-10%) | 8mo | $212,000 | $144 | 43 |
Match score weights: distance 35% · size 25% · config 20% · recency 20%. Top-matched comps best support the ARV.
Projected returns pro-forma
-3.0% appreciation · 3.0% rent growth · sell at horizon
- IRR
- 13.6%
- Equity multiple
- 1.54×
- Total profit
- $15,159
- Equity at exit
- $14,895
- IRR
- 22.4%
- Equity multiple
- 2.92×
- Total profit
- $53,567
- Equity at exit
- $8,638
Cash invested: $27,972 (down + closing). Projections, not guarantees.
Landlord ↔ Tenant lean methodology
- Overall (STATE)
- 15 Strongly Tenant-Friendly
- State New York
- 15 Strongly Tenant-Friendly · D+10
- County
- — inherits STATE
- City
- — inherits STATE
ZIP-level market 13440
- Home prices YoY
- -8.0%
- Active inventory
- 272
- Price-to-rent
- 5.7×
Monthly cashflow live
- Estimated rent
- $1,454 medium interval (Pro) →
- Mortgage (P&I)
- −$524
- Tax from tax record
- −$91 /mo · $1,089/yr
- Insurance
- −$42
- HOA
- −$0
- Vacancy / Maint / Mgmt
- −$305
- Net cashflow
- $492
Break-even live
UW: 25.0% down · 7.5% · 30yr · 1.5% tax · 5.0% vac · 8.0% maint · 8.0% mgmt
Financing live
Cash to close
- Down payment
- $24,975
- Closing costs
- $2,997
- Reserves months
- —
- Total cash needed
- —
Loan-product check · same deal, 3 products live
Conventional
25% down · 7.5% · 30yr
- Down + closing
- —
- Monthly P&I
- —
- Monthly cashflow
- —
- DSCR
- —
- Eligible?
- —
Personal DTI + credit; lowest rate.
DSCR
20% down · 8.5% · 30yr
- Down + closing
- —
- Monthly P&I
- —
- Monthly cashflow
- —
- DSCR
- —
- Eligible?
- —
No personal income docs; deal must DSCR.
Hard money
10% down · 12.0% · 12mo
- Down + closing
- —
- Monthly P&I
- —
- Monthly cashflow
- —
- DSCR
- —
- Eligible?
- —
Short-term bridge; refi at stabilization.
Rent comps 3 comps
| Address | Beds | Baths | Sqft | Rent | $/sqft | DOM | Units | Dist |
|---|---|---|---|---|---|---|---|---|
| 149 River St Unit 2 Rome, NY | 3.0 | 1.0 | 1160 | $1,500 | $1.29 | 44d | 1 | 0.16mi |
| 218 N George St Rome, NY | 2.0 | 1.0 | 2200 | $1,200 | $0.55 | 43d | 1 | 0.38mi |
| 1611 Craig St Rome, NY | 3.0 | 1.0 | 1250 | $2,000 | $1.60 | 43d | 1 | 1.44mi |
Listing history 6 events
-
2026-06-04days on market $99,900 Active 180 DOM
-
2026-06-02days on market $99,900 Active 179 DOM
-
2026-06-01days on market $99,900 Active 178 DOM
-
2026-05-31days on market $99,900 Active 177 DOM
-
2026-05-04price $99,900 955-char remark
Show marketing remark (955 chars)
Calling all investors and entrepreneurs! Now offered at a newly reduced price of $99,900, this property presents an outstanding opportunity for those looking to create value—whether as a business venture or an income-generating investment. With a brand-new roof installed in 2024, you’ll have peace of mind as you bring your renovation vision to life. The first floor offers a practical layout with two bedrooms, a den, and a full bathroom—ready for updates and modernization. Upstairs features a spacious additional living area along with a second bathroom, opening the door for expanded rental potential or a flexible multi-level setup. With strong upside and versatile possibilities, this property is perfectly suited for investors seeking to build equity or establish a business presence in a growing Rome neighborhood. Taxes include water, sewer, and trash pickup—adding even more value to this already compelling opportunity.
-
2025-12-05$159,000 Active 955-char remark
Show marketing remark (955 chars)
Calling all investors and entrepreneurs! Now offered at a newly reduced price of $99,900, this property presents an outstanding opportunity for those looking to create value—whether as a business venture or an income-generating investment. With a brand-new roof installed in 2024, you’ll have peace of mind as you bring your renovation vision to life. The first floor offers a practical layout with two bedrooms, a den, and a full bathroom—ready for updates and modernization. Upstairs features a spacious additional living area along with a second bathroom, opening the door for expanded rental potential or a flexible multi-level setup. With strong upside and versatile possibilities, this property is perfectly suited for investors seeking to build equity or establish a business presence in a growing Rome neighborhood. Taxes include water, sewer, and trash pickup—adding even more value to this already compelling opportunity.
ⓘ Source: listings_history table (triggers on properties + properties_extension) + one-shot
backfill from property_details.listing_events for pre-trigger history.
Tax reassessment forecast NY · Partial reset (capped growth)
- Current annual tax
- $1,089 · $91/mo
- Projected year-2 tax
- $1,389 · $116/mo
- Expected delta
- +$300/yr (+$25/mo · 27.5%)
ⓘ Screening estimate from a state-policy table — verify with the county assessor before closing.
Climate risk First Street
- Flood 1/10 Low FEMA zone X (unshaded) · 0% chance over 30 yrs
- Wildfire 1/10 Low
- Heat 3/10 Moderate 7 d/yr ≥94°F today · 17 d/yr by 30 yrs out
- Wind 1/10 Low
- Air quality 2/10 Low 0 unhealthy d/yr today · 1 by 30 yrs out
Nearby sold comps map
Loading sold comps map…
Walkable amenities ~0.75 mi
Loading nearby amenities…
Taxation est. · year 1
- Rental income
- $17,444
- − Mortgage interest
- −$5,596
- − Property taxes
- −$1,089
- − Insurance
- −$500
- − Repairs & maintenance
- −$1,396
- − Management
- −$1,396
- − Depreciation
- −$2,906
- Taxable income
- $4,563
- Est. tax owed @ 24.0%
- −$1,095
- After-tax cash flow
- $4,811/yr
For passive investors: Depreciation is non-cash, so a rental often shows a tax loss while cash-flowing — sheltering income. Rental losses are passive: they offset passive income freely, and up to $25,000/yr can offset ordinary (W-2) income if you actively participate and your MAGI is under $100k (phasing out to $0 by $150k); unused losses carry forward. On sale, claimed depreciation is recaptured at up to 25%, and gains may owe capital-gains tax (a 1031 exchange can defer both). Figures are a year-1 estimate at your 24.0% rate — not tax advice; consult a CPA.
Schools (NCES district)
- District
- Rome City School District
- NCES district ID
- 3624900
- Math proficiency
- 35% ▼ -4.00%
- Reading proficiency
- 46% ▲ 10.00%
- Median HH income
- $46,406
- Composite
- 34.52/100
- National rank
- #5178
- State rank
- #516 of 590 in NY
Livability — Rome
- Score
- 64/100
- State rank
- #722
- US rank
- #13676
Category grades
Schools grade is shown separately in the Schools card above.
Census & demographics
- Census place
- Rome, NY
- City population
- 41,418
- Population (ZIP)
- 41,273
Population outlook (Oneida County) Hauer SSP2
- Today (2025)
- 225,223 people
- By 2030
- 220,384 · -2.1%
- By 2040
- 209,071 · -7.2%
- By 2050
- 197,920 · -12.1%
- By 2075
- 175,541 · -22.1%
- By 2100
- 148,491 · -34.1%
Race, ethnicity, and origin ACS 2023
- Neighborhood character
- Predominantly White (82%)
- Race & ethnicity
- White 82% Hispanic / Latino 7% Two or more races 6% Black 4% Asian 1%
- Hispanic origin (detail)
- Mexican 1% Puerto Rican 4%
- Common ancestry
- Romanian 9% Lithuanian 4% Slovak 1%
- Foreign-born
- 3% · Canada, China
- Languages at home
- 94% English-only · Spanish 3% Other Indo-European 1%
Political lean MEDSL · Oneida
- 2024 margin
- Strong R (+21.3) · D 39.4% · R 60.6%
- 2008→2024 swing
- -15.2pp toward R · 2008: -6.1pp · 2024: -21.3pp
- All cycles
- 2024: R+21.3 2020: R+15.5 2016: R+21.1 2012: R+5.3 2008: R+6.1
Not yet ingested
- Civics
- —
Market trends
- HPI YoY
- ▼ -29.58%
- Current HPI
- 339.3589
- Rent YoY
- —
- Metro
- —
- State GDP YoY
- ▲ 2.60%
- F500 in state
- 92
Industry mix (Fortune 500 HQ in NY)
| Industry | F500 HQs | Revenue |
|---|---|---|
| Financial Services | 10 | $950B |
|
||
| Consumer Goods | 9 | $162B |
|
||
| Insurance | 4 | $225B |
|
||
| Telecommunications | 2 | $144B |
|
||
| Pharmaceuticals | 2 | $112B |
|
||
| Media / Entertainment | 2 | $69B |
|
||
Price history
-37.2% since first listed2 events — show timeline
- 2026-05-04 Price Changed $99,900 CNYIS
- 2025-12-05 Listed $159,000 CNYIS
Property tax history
+4.4%/yrLatest (2025): $1,089 · +587.7% YoY. Source: county tax records.
Cash-flow waterfall
monthlySold comps — $/sqft
last 12 mo · ≤1 miLoading sold comps…