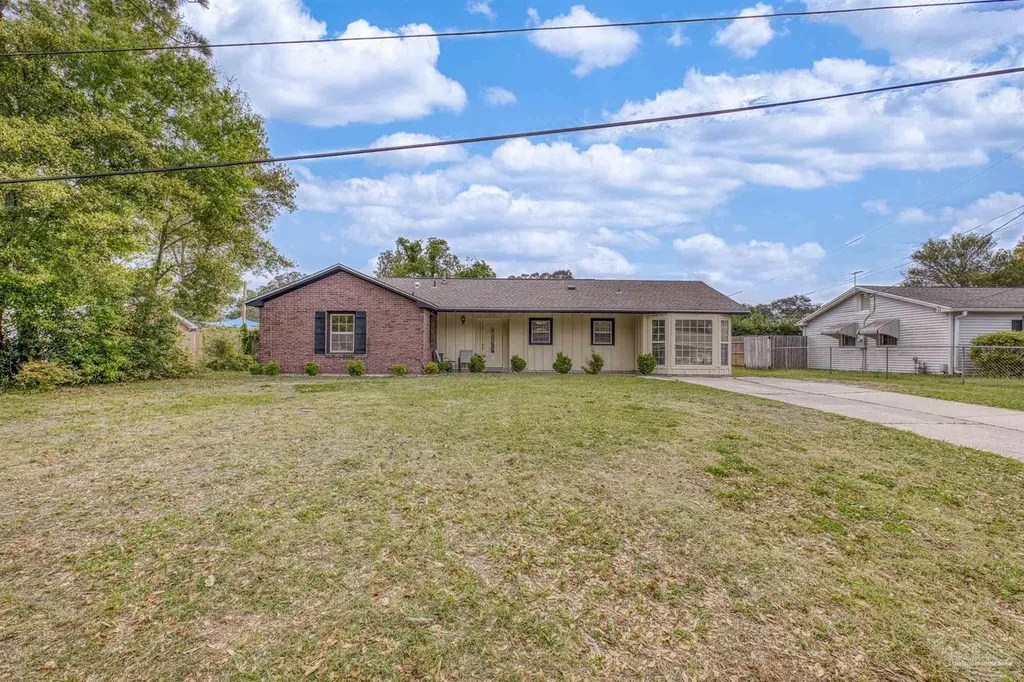
6410 Beauclair Dr · Pensacola, FL
Flood risk 1/10 · Minimal
- FEMA flood zone
- X (unshaded)
- Chance of flooding over 30 yrs
- 0.0%
- Est. flood insurance / yr
- $507 – $1,088
Fire risk 1/10 · Minimal
- Est. fire insurance / yr
- $947 – $1,759
Heat risk 10/10 · Severe
- Hot days now (above 106°F)
- 7 days/yr
- Hot days in 30 yrs
- 22 days/yr
Wind risk 9/10 · Severe
- Chance of severe wind over 30 yrs
- 99.0%
Air-quality risk 1/10 · Minimal
- Unhealthy air days now
- 0 days/yr
- Unhealthy air days in 30 yrs
- 0 days/yr
Risk factors via First Street. Map © Google.
Why this score? — see what drove the D+ grade
The composite is a weighted blend of 9 inputs, each scored 0–100. Each bar is that input's sub-score; the figure is the points it added to the 100-point composite (weight × sub-score).
- ARV discount +15.0/15.0
- Cash flow +13.0/30.0
- Livability +4.2/5.0
- DSCR +3.9/10.0
- Schools +3.6/10.0
- Rent growth +3.4/5.0
- 1% rule +3.2/10.0
- Condition / age +2.5/5.0
- Appreciation +0.0/10.0
$225,000
🖨 Deal sheet 📄 Offer letter ✓ Due diligence
Listing remarks MLS
CONTEMPORARY THREE BEDROOM ONE AND ONE-HALF BATH HOME. GALLEY KITCHEN WITH EAT-IN BREAKFAST AREA. SEPARATE LAUNDRY ROOM OFF OF THE FAMILY ROOM. NEW DIMENSIONAL SHINGLE ROOF. THE FREE STANDING STORAGE BUILDING IN THE BACK YARD ARE NOT WARRANTIED IN THIS SALE. ALL OF THE INFORMATION CONTAINED IN THIS LISTING ARE BELIEVED TO BE TRUE AND CORRECT. HOWEVER, IT IS THE SOLE RESPONSIBILITY OF THE BUYER TO VERIFY ANY AND ALL INFORMATION CONTAINED IN THIS LISTING.
Key facts
- Large backyard
- Storage shed
- Double pane windows
Tags
Neighborhood map
What this means for you Summary
Snapshot
- This is a 3-bed/2.0-bath single-family listed at $225k.
Deal economics
- At list price, monthly cash flow is $-11 ($-134/yr) — negative.
- To cash-flow at today's rent, offer at most $223k (0.9% below list).
- To meet the 1% rule (rent ≥ 1% of price), the offer needs to be $184k (18.2% below list).
- Recommended offer: $184k (18.2% below list) — sets the bar for 1% rule.
- Cap rate 6.2% vs local median 3.6% in Pensacola — top-decile yield for the area; either an underpriced asset or a hidden risk that comps aren't pricing in. Stress-test before assuming the spread holds.
Location & tenants
- Location reads 83/100 on livability (#53 in FL, #924 nationally) — a professional / high-income tenant draw. Strengths: commute A+, cost of living A+, housing A+.
- Escambia (suburban): math 40% / reading 45% proficiency, ranked #56 of 73 in FL (top 77%) — families likely to look elsewhere, expect single-tenant / working-renter base with shorter leases.
- Market conditions: Rents rising (+3.6%/yr); 172 active listings in the ZIP; 17 comparable units currently listed for rent nearby; rentals at typical pace (median 24d on market — plan ~3-4 weeks tenant-placement turnaround); 1,479 units permitted in Escambia County in 2024 (0 in 5+ unit buildings).
- This rent runs 30% of the median local income ($73k/yr) — at the standard rent-burdened threshold; future hikes will face affordability resistance.
Forward outlook
- Local home prices are declining (-3.0%/yr); year-one equity from $2k of loan paydown is wiped out by about $7k of value loss. Plan a longer hold.
- Escambia County population projected at +13% by 2050 — modest demand growth; plan on rents tracking national, not racing it.
Negotiation context
- It's been on market 42 days — a 3% lower offer ($218k) is reasonable based on typical stale-listing flexibility.
- 5 sale attempts since 8y ago with the ask held roughly flat each time — persistent listings suggest the price (not the market) is what's stuck; bring a comps-based counter.
- Current owner paid $190k; 19% above their basis — modest negotiation headroom, anchor on the comps not their cost.
Risks & watch-outs
- Climate carrying-cost: severe wind risk, 99% chance of damaging wind over 30y; extreme-heat days projected 7→22/yr by 2055 (HVAC capex compounding) — expect insurance premiums to compound above CPI over the hold.
Questions for the listing agent
- What do current leases actually rent for vs. the listed asking? Can we see a recent rent roll and the last 12 months of T-12 income?
- It's been on market 42 days. Have you received any prior offers? Is the seller open to a 18% concession, seller financing, or rate buy-down credit?
- Built in 1961 — when were the roof, HVAC, electrical panel, plumbing, and water heater last replaced?
- Is there a deadline driving the sale (1031 exchange, divorce, estate, relocation)? That informs how much negotiation room exists.
- The area grade is low — what's the realistic commute time and amenity access for the typical tenant pool here? Any planned neighborhood developments (good or bad) we should know about?
- What's the average days-on-market for RENTAL listings here right now (not sales)? A rising rental-DOM trend means longer vacancies and softer asking-rent achievability than the comps imply.
- What's the recent tenant-quality profile in this submarket — average credit score on applications, eviction rate, late-payment / NSF rate, and stable-employment percentage? A property-management company in the area should have these aggregated.
- How much new for-sale + rental construction is in the pipeline within 1–3 miles? Heavy new supply typically softens prices + rents 12–24 months out; constrained supply supports both.
Investment metrics
- 1% rule
- 0.82% ✗
- Cap rate
- 6.23%
- Cash-on-cash
- -0.21%
- DSCR
- 0.99
- GRM
- 10.2
CMA / ARV
- ARV (on-the-fly)
- $271,188
- Comps found
- 12
Show comp detail 12 sales within ~0.75 mi
| Address | Dist | Beds/Ba | Sqft | Sold | Price | $/sf | Match |
|---|---|---|---|---|---|---|---|
| 2500 E Burgess Rd | 0.32mi | 3/2.0 | 1,620 (-3%) | 1mo | $315,000 | $194 | 79 |
| 1810 Toni St | 0.28mi | 4/2.0 (+1) | 1,595 (-5%) | 1mo | $260,000 | $163 | 73 |
| 6598 Dewrell Sq | 0.21mi | 3/2.0 | 1,906 (+14%) | 1mo | $385,000 | $202 | 66 |
| 6650 Ames Rd | 0.17mi | 3/1.0 | 1,800 (+8%) | 12mo | $260,000 | $144 | 66 |
| 5801 Blaze Ave | 0.65mi | 3/2.0 | 1,737 (+4%) | 6mo | $169,000 | $97 | 58 |
| 7113 Whirlybird Ave | 0.50mi | 3/2.0 | 1,579 (-6%) | 11mo | $199,000 | $126 | 58 |
| 1524 Bakalane Ave | 0.49mi | 4/2.0 (+1) | 1,800 (+8%) | 9mo | $305,000 | $169 | 52 |
| 2902 Swan Ln | 0.74mi | 3/2.0 | 1,620 (-3%) | 12mo | $330,000 | $204 | 50 |
| 6203 Maybelle Dr | 0.62mi | 3/2.0 | 1,900 (+14%) | 6mo | $285,000 | $150 | 44 |
| 5837 Sanders St | 0.59mi | 3/1.5 | 1,479 (-12%) | 10mo | $240,000 | $162 | 42 |
| 7350 Beta Ln | 0.66mi | 4/2.0 (+1) | 1,470 (-12%) | 14mo | $230,000 | $156 | 33 |
| 1141 Tamara Dr | 0.64mi | 4/2.0 (+1) | 1,922 (+15%) | 18mo | $255,000 | $133 | 25 |
Match score weights: distance 35% · size 25% · config 20% · recency 20%. Top-matched comps best support the ARV.
Projected returns pro-forma
-3.0% appreciation · 3.63% rent growth · sell at horizon
- IRR
- -16.0%
- Equity multiple
- 0.43×
- Total profit
- $-36,024
- Equity at exit
- $33,548
- IRR
- -6.7%
- Equity multiple
- 0.56×
- Total profit
- $-27,520
- Equity at exit
- $19,454
Cash invested: $63,000 (down + closing). Projections, not guarantees.
Landlord ↔ Tenant lean methodology
- Overall (STATE)
- 87 Strongly Landlord-Friendly
- State Florida
- 87 Strongly Landlord-Friendly · R+3
- County
- — inherits STATE
- City
- — inherits STATE
ZIP-level market 32504
- Home prices YoY
- -30.9%
- Rents YoY
- 3.6%
- Active inventory
- 172
- Price-to-rent
- 10.2×
Monthly cashflow live
- Estimated rent
- $1,840 high interval (Pro) →
- Mortgage (P&I)
- −$1,180
- Tax from tax record
- −$191 /mo · $2,290/yr
- Insurance
- −$94
- HOA
- −$0
- Vacancy / Maint / Mgmt
- −$386
- Net cashflow
- $-11
Break-even live
UW: 25.0% down · 7.5% · 30yr · 1.5% tax · 5.0% vac · 8.0% maint · 8.0% mgmt
Financing live
Cash to close
- Down payment
- $56,250
- Closing costs
- $6,750
- Reserves months
- —
- Total cash needed
- —
Loan-product check · same deal, 3 products live
Conventional
25% down · 7.5% · 30yr
- Down + closing
- —
- Monthly P&I
- —
- Monthly cashflow
- —
- DSCR
- —
- Eligible?
- —
Personal DTI + credit; lowest rate.
DSCR
20% down · 8.5% · 30yr
- Down + closing
- —
- Monthly P&I
- —
- Monthly cashflow
- —
- DSCR
- —
- Eligible?
- —
No personal income docs; deal must DSCR.
Hard money
10% down · 12.0% · 12mo
- Down + closing
- —
- Monthly P&I
- —
- Monthly cashflow
- —
- DSCR
- —
- Eligible?
- —
Short-term bridge; refi at stabilization.
Rent comps 17 comps
| Address | Beds | Baths | Sqft | Rent | $/sqft | DOM | Units | Dist |
|---|---|---|---|---|---|---|---|---|
| 1521 Toni St Pensacola, FL | 4.0 | 3.0 | 2224 | $2,300 | $1.03 | 23d | 1 | 0.51mi |
| 7074 Javelin Ct Pensacola, FL | 3.0 | 2.5 | 1543 | $1,850 | $1.20 | 13d | 30 | 0.52mi |
| 711 Underwood Ave Pensacola, FL | 3.0 | 1.0–2.5 | 950 | $1,718 | $1.81 | 13d | 25 | 0.65mi |
| 7104 Cedar Grove Way Ferry Pass, FL | 3.0 | 2.5 | 1534 | $1,850 | $1.21 | 13d | 37 | 0.70mi |
| 2813 Langley Ave Pensacola, FL | 2.0 | 2.0 | 1078 | $1,450 | $1.35 | 23d | 1 | 0.78mi |
| 7322 Mangum Dr Unit 7322 Pensacola, FL | 2.0 | 2.0 | 1100 | $1,450 | $1.32 | 23d | 1 | 0.82mi |
| 7650 Kipling St Unit 1 Pensacola, FL | 3.0 | 2.0 | 1200 | $1,300 | $1.08 | 23d | 1 | 0.95mi |
| 7171 N 9th Ave Unit D6 Pensacola, FL | 2.0 | 2.0 | 1204 | $1,450 | $1.20 | 13d | 1 | 1.02mi |
| 7758 Kipling St Pensacola, FL | 4.0 | 2.0 | 1652 | $1,695 | $1.03 | 13d | 1 | 1.12mi |
| 3205 E Olive Rd Pensacola, FL | 1.0–2.0 | 1.0–2.0 | 900 | $1,540 | $1.71 | 13d | 8 | 1.17mi |
| 7101 Joy St Unit I5 Pensacola, FL | 3.0 | 2.0 | 1183 | $1,950 | $1.65 | 23d | 1 | 1.20mi |
| 8053 Malibu Cir Pensacola, FL | 3.0 | 2.0 | 1575 | $1,810 | $1.15 | 13d | 1 | 1.28mi |
| 6016 Sewell St Pensacola, FL | 3.0 | 1.5 | 1377 | $1,650 | $1.20 | 23d | 1 | 1.28mi |
| 3730 Forest Glen Dr Pensacola, FL | 3.0 | 2.0 | 1107 | $1,660 | $1.50 | 23d | 1 | 1.30mi |
| 3795 Summer Dr Pensacola, FL | 3.0 | 2.0 | 1650 | $2,600 | $1.58 | 23d | 1 | 1.32mi |
| 3910 Langley Ave Pensacola, FL | 3.0 | 2.0 | 1989 | $2,495 | $1.25 | 23d | 1 | 1.41mi |
| 8108 Ridgefield Rd Pensacola, FL | 3.0 | 2.0 | 1485 | $2,000 | $1.35 | 13d | 1 | 1.50mi |
Listing history 21 events
-
2026-05-18status Pending
-
2026-04-08historical Contingent
-
2026-04-06$225,000 Active
-
2021-11-01soldstatus $189,500
-
2021-10-15soldstatus $189,500 Sold 464-char remark
Show marketing remark (464 chars)
CONTEMPORARY THREE BEDROOM ONE AND ONE-HALF BATH HOME. GALLEY KITCHEN WITH EAT-IN BREAKFAST AREA. SEPARATE LAUNDRY ROOM OFF OF THE FAMILY ROOM. NEW DIMENSIONAL SHINGLE ROOF. THE FREE STANDING STORAGE BUILDING IN THE BACK YARD ARE NOT WARRANTIED IN THIS SALE. ALL OF THE INFORMATION CONTAINED IN THIS LISTING ARE BELIEVED TO BE TRUE AND CORRECT. HOWEVER, IT IS THE SOLE RESPONSIBILITY OF THE BUYER TO VERIFY ANY AND ALL INFORMATION CONTAINED IN THIS LISTING.
-
2021-09-08historical Contingent 464-char remark
Show marketing remark (464 chars)
CONTEMPORARY THREE BEDROOM ONE AND ONE-HALF BATH HOME. GALLEY KITCHEN WITH EAT-IN BREAKFAST AREA. SEPARATE LAUNDRY ROOM OFF OF THE FAMILY ROOM. NEW DIMENSIONAL SHINGLE ROOF. THE FREE STANDING STORAGE BUILDING IN THE BACK YARD ARE NOT WARRANTIED IN THIS SALE. ALL OF THE INFORMATION CONTAINED IN THIS LISTING ARE BELIEVED TO BE TRUE AND CORRECT. HOWEVER, IT IS THE SOLE RESPONSIBILITY OF THE BUYER TO VERIFY ANY AND ALL INFORMATION CONTAINED IN THIS LISTING.
-
2021-08-31$189,500 Active 464-char remark
Show marketing remark (464 chars)
CONTEMPORARY THREE BEDROOM ONE AND ONE-HALF BATH HOME. GALLEY KITCHEN WITH EAT-IN BREAKFAST AREA. SEPARATE LAUNDRY ROOM OFF OF THE FAMILY ROOM. NEW DIMENSIONAL SHINGLE ROOF. THE FREE STANDING STORAGE BUILDING IN THE BACK YARD ARE NOT WARRANTIED IN THIS SALE. ALL OF THE INFORMATION CONTAINED IN THIS LISTING ARE BELIEVED TO BE TRUE AND CORRECT. HOWEVER, IT IS THE SOLE RESPONSIBILITY OF THE BUYER TO VERIFY ANY AND ALL INFORMATION CONTAINED IN THIS LISTING.
-
2021-08-12historical
-
2021-06-28historical Contingent
-
2021-06-25status Active
-
2021-06-25price $175,000
-
2021-06-24historical
-
2021-05-16historical Contingent
-
2021-05-14$167,000 Active
-
2019-07-22soldstatus $135,000
-
2018-11-15historical
-
2018-09-21$134,500
-
1999-01-07soldstatus $68,900
-
1998-02-25soldstatus $68,500
-
1996-04-01soldstatus $64,000
-
1984-02-01soldstatus $42,200
ⓘ Source: listings_history table (triggers on properties + properties_extension) + one-shot
backfill from property_details.listing_events for pre-trigger history.
Tax reassessment forecast FL · Resets to sale price
- Current annual tax
- $2,290 · $191/mo
- Projected year-2 tax
- $2,290 · $191/mo
- Expected delta
- $0/yr ($0/mo · 0.0%)
ⓘ Screening estimate from a state-policy table — verify with the county assessor before closing.
Climate risk First Street
- Flood 1/10 Low FEMA zone X (unshaded) · 0% chance over 30 yrs
- Wildfire 1/10 Low
- Heat 10/10 Extreme 7 d/yr ≥106°F today · 22 d/yr by 30 yrs out
- Wind 9/10 Extreme 99% chance of damaging wind over 30 yrs
- Air quality 1/10 Low 0 unhealthy d/yr today · 0 by 30 yrs out
Nearby sold comps map
Loading sold comps map…
Walkable amenities ~0.75 mi
Loading nearby amenities…
Taxation est. · year 1
- Rental income
- $22,077
- − Mortgage interest
- −$12,603
- − Property taxes
- −$2,290
- − Insurance
- −$1,125
- − Repairs & maintenance
- −$1,766
- − Management
- −$1,766
- − Depreciation
- −$6,545
- Taxable loss
- −$4,020
- Est. tax savings @ 24.0%
- +$965
- After-tax cash flow
- $831/yr
For passive investors: Depreciation is non-cash, so a rental often shows a tax loss while cash-flowing — sheltering income. Rental losses are passive: they offset passive income freely, and up to $25,000/yr can offset ordinary (W-2) income if you actively participate and your MAGI is under $100k (phasing out to $0 by $150k); unused losses carry forward. On sale, claimed depreciation is recaptured at up to 25%, and gains may owe capital-gains tax (a 1031 exchange can defer both). Figures are a year-1 estimate at your 24.0% rate — not tax advice; consult a CPA.
Schools (NCES district)
- District
- Escambia
- NCES district ID
- 1200510
- Math proficiency
- 40% ▼ -9.00%
- Reading proficiency
- 45% ▼ -4.00%
- Median HH income
- $44,649
- Composite
- 36.04/100
- National rank
- #4773
- State rank
- #56 of 73 in FL
Livability — Pensacola
- Score
- 83/100
- State rank
- #53
- US rank
- #924
Category grades
Schools grade is shown separately in the Schools card above.
Census & demographics
- Census place
- Pensacola, FL
- County
- Escambia County · 301,722 people
- City population
- 237,636
- Metro
- Pensacola-Ferry Pass-Brent, FL
- Population (ZIP)
- 22,153
- Household income
- $72,672
- Rent vs Own
- Severe rent burden
- 533.0
Population outlook (Escambia County) Hauer SSP2
- Today (2025)
- 334,637 people
- By 2030
- 345,779 · +3.3%
- By 2040
- 364,828 · +9.0%
- By 2050
- 378,514 · +13.1%
- By 2075
- 403,220 · +20.5%
- By 2100
- 386,125 · +15.4%
Race, ethnicity, and origin ACS 2023
- Neighborhood character
- Predominantly White (69%)
- Race & ethnicity
- White 69% Black 13% Two or more races 10% Hispanic / Latino 6% Asian 4%
- Hispanic origin (detail)
- Mexican 2%
- Common ancestry
- Lithuanian 3% Italian 2% Slovak 2%
- Foreign-born
- 7% · Canada, China, Jamaica
- Languages at home
- 92% English-only · Spanish 2% Chinese 2% Other Indo-European 1%
Political lean MEDSL · Escambia
- 2024 margin
- R (+19.5) · D 39.7% · R 59.2% · Other 1.1%
- 2008→2024 swing
- -0.2pp no change · 2008: -19.3pp · 2024: -19.5pp
- All cycles
- 2024: R+19.5 2020: R+15.1 2016: R+20.6 2012: R+20.6 2008: R+19.3
Not yet ingested
- Civics
- —
Market trends
- HPI YoY
- ▼ -119.75%
- Current HPI
- 268.2214
- Rent YoY
- ▲ 3.63%
- Metro
- Pensacola-Ferry Pass-Brent, FL
- State GDP YoY
- ▲ 3.28%
- F500 in state
- 36
Industry mix (Fortune 500 HQ in FL)
| Industry | F500 HQs | Revenue |
|---|---|---|
| Industrial Technology | 2 | $29B |
|
||
| Insurance | 2 | $17B |
|
||
| Retail | 1 | $60B |
|
||
| Technology Distribution | 1 | $58B |
|
||
| Homebuilding | 1 | $35B |
|
||
| Technology Manufacturing | 1 | $35B |
|
||
Price history
+433.2% since first listed21 events — show timeline
- 2026-05-18 Pending — PARMLS
- 2026-04-08 Contingent — PARMLS
- 2026-04-06 Listed $225,000 PARMLS
- 2021-11-01 Sold (Public Records) $189,500 Public Records
- 2021-10-15 Sold (MLS) $189,500 PARMLS
- 2021-09-08 Contingent — PARMLS
- 2021-08-31 Listed $189,500 PARMLS
- 2021-08-12 Listing Removed — PARMLS
- 2021-06-28 Contingent — PARMLS
- 2021-06-25 Relisted — PARMLS
- 2021-06-25 Price Changed $175,000 PARMLS
- 2021-06-24 Listing Removed — PARMLS
- 2021-05-16 Contingent — PARMLS
- 2021-05-14 Listed $167,000 PARMLS
- 2019-07-22 Sold (Public Records) $135,000 Public Records
- 2018-11-15 Listing Removed — PARMLS
- 2018-09-21 Listed $134,500 PARMLS
- 1999-01-07 Sold (Public Records) $68,900 Public Records
- 1998-02-25 Sold (Public Records) $68,500 Public Records
- 1996-04-01 Sold (Public Records) $64,000 Public Records
- 1984-02-01 Sold (Public Records) $42,200 Public Records
Property tax history
+6.3%/yrLatest (2025): $2,290 · +6.5% YoY. Source: county tax records.
Cash-flow waterfall
monthlySold comps — $/sqft
last 12 mo · ≤1 miLoading sold comps…