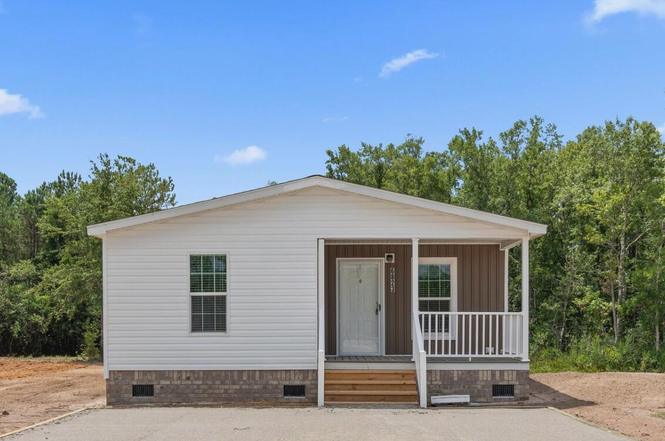
6823 Lewis Dr SE · Boiling Spring Lakes, NC
Flood risk No data
- FEMA flood zone
- —
- Chance of flooding over 30 yrs
- —
- Est. flood insurance / yr
- —
Fire risk No data
- Est. fire insurance / yr
- —
Heat risk No data
- Hot days now (above threshold)
- —
- Hot days in 30 yrs
- —
Wind risk No data
- Chance of severe wind over 30 yrs
- —
Air-quality risk No data
- Unhealthy air days now
- —
- Unhealthy air days in 30 yrs
- —
Risk factors via First Street. Map © Google.
Why this score? — see what drove the D- grade
The composite is a weighted blend of 9 inputs, each scored 0–100. Each bar is that input's sub-score; the figure is the points it added to the 100-point composite (weight × sub-score).
- Cash flow +9.2/30.0
- ARV discount +7.5/15.0
- Appreciation +5.6/10.0
- Schools +3.9/10.0
- Livability +3.0/5.0
- 1% rule +2.8/10.0
- DSCR +2.6/10.0
- Rent growth +2.5/5.0
- Condition / age +2.5/5.0
$249,900
🖨 Deal sheet (PDF) 📄 Offer letter ✓ Due diligence
Listing remarks
Your coastal escape awaits—spacious, affordable, and completely free from HOA rules. This brand-new Champion home at 6823 Lewis Drive sits on a rare 1.5-acre lot in Lewis Acres, offering the privacy, flexibility, and freedom so many buyers are seeking. With a private well and septic, minimal monthly costs, and room for a boat, RV, or additional outbuildings, this property is perfect for those who want the coastal lifestyle without compromise. Inside, the Chapel Hill model delivers a bright, open floor plan with 3 bedrooms and 2 full bathrooms. The fully equipped kitchen features stainless steel appliances, making it move-in ready from day one. Cozy up on the front porch in the evening
Key facts
- 1.5 acre lot
- Private well
- Septic
Tags
Property features AI
Finance
- Other: Zoning: CO-RR; Lot is approximately 1.52 acres (irregular shape); Subdivision: Lewis Acres
Exterior
- Parking: On-site gravel parking
- Utilities: Well water; Septic tank; Other utilities
- Home design: Manufactured home; Single-story (one level); Entry on level 1
- Construction: Vinyl siding with frame construction; Shingle roof; Permanent foundation; New construction
- Exterior features: Covered porch; Porch; Wooded lot; View
Interior
- Kitchen: Refrigerator; Dishwasher; Electric range; Microwave
- Bedrooms: Total of 5 rooms (bedroom count not specified)
- Flooring: Laminate
- Bathrooms: 2 full bathrooms
- Heating & cooling: Electric heating; Heat pump; Central air conditioning
- Interior features: Walk-in closets; Kitchen island; Window coverings; Unfurnished; Accessible full bath
- Laundry & utility: Laundry room; Electric water heater
Neighborhood map
What this means for you Summary
Snapshot
- This is a 3-bed/2.0-bath single-family listed at $250k.
Deal economics
- At list price, monthly cash flow is $-188 ($-2k/yr) — negative.
- To cash-flow at today's rent, offer at most $223k (10.9% below list).
- To meet the 1% rule (rent ≥ 1% of price), the offer needs to be $195k (22.1% below list).
- Recommended offer: $195k (22.1% below list) — sets the bar for 1% rule.
- Cap rate 5.4% vs local median 4.1% in Boiling Spring Lakes — top-decile yield for the area; either an underpriced asset or a hidden risk that comps aren't pricing in. Stress-test before assuming the spread holds.
Location & tenants
- Location reads 59/100 on livability (#542 in NC) — a working-class tenant base; expect higher turnover. Strengths: cost of living A+, housing A+; Watch: employment C-, health & safety D, amenities F.
- Brunswick County Schools (rural): math 45% / reading 47% proficiency, ranked #82 of 178 in NC (top 46%) — families likely to look elsewhere, expect single-tenant / working-renter base with shorter leases.
- Zoned schools: Bolivia Elementary (math 50% / reading 43%, grade D-, #542 of 1,410 statewide, top 39%, 496 students, 99% FRL); South Brunswick Middle (math 41% / reading 49%, grade D, #160 of 475 statewide, top 35%, 572 students, 100% FRL); South Brunswick High (math 62% / reading 57%, grade C+, #216 of 535 statewide, top 43%, 1,172 students, 100% FRL) — zoned schools average 100% FRL vs 53% district-wide (46 pts higher); higher-poverty schools than district average — tighter screening recommended.
- Market conditions: 191 active listings in the ZIP; 6,112 units permitted in Brunswick County in 2024 (990 in 5+ unit buildings).
Forward outlook
- In year one you build about $5k of equity ($2k loan paydown + $3k appreciation (1.2% local appreciation)).
- Brunswick County population projected at +36% by 2050 — long-run rental-demand tailwind backs the buy-and-hold thesis.
- By year 7, paydown + projected appreciation supports a ~$32k cash-out refi (75% LTV) — recoverable capital for the next deal without selling this one.
Negotiation context
- It's been on market 150 days — a 12% lower offer ($220k) is reasonable based on typical stale-listing flexibility.
- 2 sale attempts with the ask held roughly flat each time — persistent listings suggest the price (not the market) is what's stuck; bring a comps-based counter.
Questions for the listing agent
- What do current leases actually rent for vs. the listed asking? Can we see a recent rent roll and the last 12 months of T-12 income?
- It's been on market 150 days. Have you received any prior offers? Is the seller open to a 22% concession, seller financing, or rate buy-down credit?
- Why hasn't it sold? Are there any deal-killer items the seller is aware of (foundation, flood, title, zoning, code violations)?
- Is there a deadline driving the sale (1031 exchange, divorce, estate, relocation)? That informs how much negotiation room exists.
- Schools are F-rated, which usually means shorter tenancies and higher turnover. Who's the typical renter profile here, and what's been the actual vacancy rate?
- The area grade is low — what's the realistic commute time and amenity access for the typical tenant pool here? Any planned neighborhood developments (good or bad) we should know about?
- What's the average days-on-market for RENTAL listings here right now (not sales)? A rising rental-DOM trend means longer vacancies and softer asking-rent achievability than the comps imply.
- What's the recent tenant-quality profile in this submarket — average credit score on applications, eviction rate, late-payment / NSF rate, and stable-employment percentage? A property-management company in the area should have these aggregated.
- How much new for-sale + rental construction is in the pipeline within 1–3 miles? Heavy new supply typically softens prices + rents 12–24 months out; constrained supply supports both.
Investment metrics
- 1% rule
- 0.78% ✗
- Cap rate
- 5.39%
- Cash-on-cash
- -3.23%
- DSCR
- 0.86
- GRM
- 10.7
CMA / ARV
No comps found within radius.
Projected returns pro-forma
1.23% appreciation · 3.0% rent growth · sell at horizon
- IRR
- -1.2%
- Equity multiple
- 0.94×
- Total profit
- $-4,427
- Equity at exit
- $88,358
- IRR
- 3.6%
- Equity multiple
- 1.45×
- Total profit
- $31,310
- Equity at exit
- $119,813
Cash invested: $69,972 (down + closing). Projections, not guarantees.
Landlord ↔ Tenant lean methodology
- Overall (STATE)
- 85 Strongly Landlord-Friendly
- State North Carolina
- 85 Strongly Landlord-Friendly · R+3
- County
- — inherits STATE
- City
- — inherits STATE
ZIP-level market 28479
- Home prices YoY
- 0.8%
- Active inventory
- 191
- Price-to-rent
- 10.7×
Monthly cashflow live
- Estimated rent
- $1,948 medium interval (Pro) →
- Mortgage (P&I)
- −$1,311
- Tax est. 1.5%
- −$312 /mo · $3,748/yr
- Insurance
- −$104
- HOA
- −$0
- Vacancy / Maint / Mgmt
- −$409
- Net cashflow
- $-188
Break-even live
Sensitivity live
| Price | -10% $-16 | -5% $-102 | +0% $-188 | +5% $-275 | +10% $-361 |
|---|---|---|---|---|---|
| Rent | -10% $-342 | -5% $-265 | +0% $-188 | +5% $-111 | +10% $-34 |
| Rate | -1.0pp $-62 | -0.5pp $-125 | base $-188 | +0.5pp $-253 | +1.0pp $-319 |
UW: 25.0% down · 7.5% · 30yr · 1.5% tax · 5.0% vac · 8.0% maint · 8.0% mgmt
Financing live
Cash to close
- Down payment
- $62,475
- Closing costs
- $7,497
- Reserves months
- —
- Total cash needed
- —
Loan-product check · same deal, 3 products live
Conventional
25% down · 7.5% · 30yr
- Down + closing
- —
- Monthly P&I
- —
- Monthly cashflow
- —
- DSCR
- —
- Eligible?
- —
Personal DTI + credit; lowest rate.
DSCR
20% down · 8.5% · 30yr
- Down + closing
- —
- Monthly P&I
- —
- Monthly cashflow
- —
- DSCR
- —
- Eligible?
- —
No personal income docs; deal must DSCR.
Hard money
10% down · 12.0% · 12mo
- Down + closing
- —
- Monthly P&I
- —
- Monthly cashflow
- —
- DSCR
- —
- Eligible?
- —
Short-term bridge; refi at stabilization.
Listing history 24 events
-
2026-06-22days on market $249,900 Active 150 DOM
-
2026-06-18days on market $249,900 Active 147 DOM
-
2026-06-17days on market $249,900 Active 146 DOM
-
2026-06-16days on market $249,900 Active 145 DOM
-
2026-06-15days on market $249,900 Active 144 DOM
-
2026-06-14days on market $249,900 Active 142 DOM
-
2026-06-13days on market $249,900 Active 141 DOM
-
2026-06-10days on market $249,900 Active 139 DOM
-
2026-06-09days on market $249,900 Active 138 DOM
-
2026-06-08days on market $249,900 Active 137 DOM
-
2026-06-07days on market $249,900 Active 136 DOM
-
2026-06-05days on market $249,900 Active 133 DOM
-
2026-06-03days on market $249,900 Active 132 DOM
-
2026-06-02days on market $249,900 Active 131 DOM
-
2026-06-01days on market $249,900 Active 130 DOM
-
2026-05-31days on market $249,900 Active 129 DOM
-
2026-05-30days on market $249,900 Active 128 DOM
-
2026-02-21price $249,900
-
2026-01-22$254,900 Active
-
2025-11-19historical
-
2025-09-03price $265,900
-
2025-08-07price $268,500
-
2025-02-05$270,139 Active
-
2025-01-06historical
ⓘ Source: listings_history table (triggers on properties + properties_extension) + one-shot
backfill from property_details.listing_events for pre-trigger history.
Nearby sold comps map
Loading sold comps map…
Walkable amenities ~0.75 mi
Loading nearby amenities…
Taxation est. · year 1
- Rental income
- $23,373
- − Mortgage interest
- −$13,998
- − Property taxes
- −$3,748
- − Insurance
- −$1,250
- − Repairs & maintenance
- −$1,870
- − Management
- −$1,870
- − Depreciation
- −$7,270
- Taxable loss
- −$6,633
- Est. tax savings @ 24.0%
- +$1,592
- After-tax cash flow
- $-668/yr
For passive investors: Depreciation is non-cash, so a rental often shows a tax loss while cash-flowing — sheltering income. Rental losses are passive: they offset passive income freely, and up to $25,000/yr can offset ordinary (W-2) income if you actively participate and your MAGI is under $100k (phasing out to $0 by $150k); unused losses carry forward. On sale, claimed depreciation is recaptured at up to 25%, and gains may owe capital-gains tax (a 1031 exchange can defer both). Figures are a year-1 estimate at your 24.0% rate — not tax advice; consult a CPA.
Schools (NCES district)
- District
- Brunswick County Schools
- NCES district ID
- 3700420
- Math proficiency
- 45% ▲ 4.00%
- Reading proficiency
- 47% ▲ 4.00%
- Median HH income
- $47,494
- Composite
- 39.23/100
- National rank
- #4011
- State rank
- #82 of 178 in NC
Livability — Boiling Spring Lakes
- Score
- 59/100
- State rank
- #542
- US rank
- #19781
Category grades
Schools grade is shown separately in the Schools card above.
Census & demographics
- Population (ZIP)
- 6,971
Population outlook (Brunswick County) Hauer SSP2
- Today (2025)
- 152,111 people
- By 2030
- 165,705 · +8.9%
- By 2040
- 188,494 · +23.9%
- By 2050
- 206,228 · +35.6%
- By 2075
- 237,876 · +56.4%
- By 2100
- 251,451 · +65.3%
Race, ethnicity, and origin ACS 2023
- Neighborhood character
- Predominantly White (72%)
- Race & ethnicity
- White 72% Black 13% Two or more races 13% Hispanic / Latino 3%
- Common ancestry
- Serbian 2% Slovak 2% Italian 2%
- Foreign-born
- 0%
- Languages at home
- 97% English-only · Spanish 3%
Political lean MEDSL · Brunswick
- 2024 margin
- Strong R (+24.9) · D 37.2% · R 62.0%
- 2008→2024 swing
- -6.9pp toward R · 2008: -17.9pp · 2024: -24.9pp
- All cycles
- 2024: R+24.9 2020: R+25.0 2016: R+28.7 2012: R+22.2 2008: R+17.9
Not yet ingested
- Civics
- —
Market trends
- HPI YoY
- ▲ 1.23%
- Current HPI
- 159.4516
- Rent YoY
- —
- Metro
- —
- State GDP YoY
- ▲ 3.28%
- F500 in state
- 26
Industry mix (Fortune 500 HQ in NC)
| Industry | F500 HQs | Revenue |
|---|---|---|
| Financial Services | 2 | $213B |
|
||
| Retail | 2 | $95B |
|
||
| Industrial Conglomerate | 1 | $38B |
|
||
| Metals / Steel | 1 | $35B |
|
||
| Utilities | 1 | $30B |
|
||
| Industrial Machinery | 1 | $19B |
|
||
Price history
-7.5% since first listed7 events — show timeline
- 2026-02-21 Price Changed $249,900 Hive MLS
- 2026-01-22 Listed $254,900 Hive MLS
- 2025-11-19 Listing Removed — Hive MLS
- 2025-09-03 Price Changed $265,900 Hive MLS
- 2025-08-07 Price Changed $268,500 Hive MLS
- 2025-02-05 Listed $270,139 Hive MLS
- 2025-01-06 Coming Soon — Hive MLS
Cash-flow waterfall
monthlySold comps — $/sqft
last 12 mo · ≤1 miLoading sold comps…