23336 Pond Fork Rd · Van, WV
Flood risk 9/10 · Severe
- FEMA flood zone
- AE
- Chance of flooding over 30 yrs
- 0.99%
- Est. flood insurance / yr
- $1,737 – $8,500
Fire risk 4/10 · Minor
- Est. fire insurance / yr
- $787 – $1,461
Heat risk 5/10 · Moderate
- Hot days now (above 97°F)
- 8 days/yr
- Hot days in 30 yrs
- 22 days/yr
Wind risk 2/10 · Minimal
- Chance of severe wind over 30 yrs
- 1.0%
Air-quality risk 1/10 · Minimal
- Unhealthy air days now
- 0 days/yr
- Unhealthy air days in 30 yrs
- 0 days/yr
Risk factors via First Street. Map © Google.
Why this score? — see what drove the B+ grade
The composite is a weighted blend of 9 inputs, each scored 0–100. Each bar is that input's sub-score; the figure is the points it added to the 100-point composite (weight × sub-score).
- Cash flow +30.0/30.0
- 1% rule +10.0/10.0
- DSCR +10.0/10.0
- ARV discount +7.5/15.0
- Appreciation +7.4/10.0
- Livability +3.2/5.0
- Schools +2.6/10.0
- Rent growth +2.5/5.0
- Condition / age +2.5/5.0
$29,500
🖨 Deal sheet 📄 Offer letter ✓ Due diligence
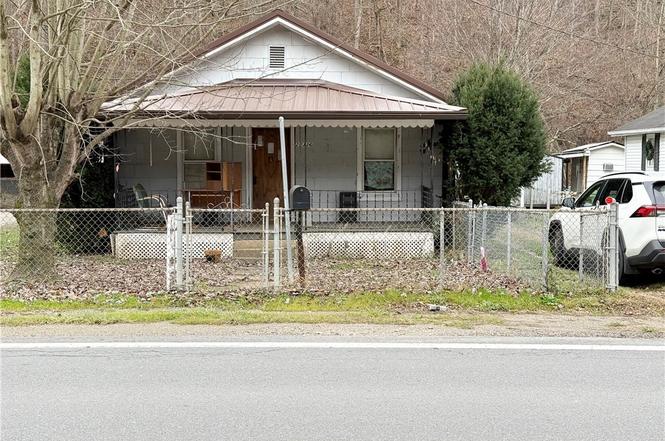
Listing remarks
Older home that needs tlc. Carpets & vinyl need replaced. Older windows. Baseboard electric heat. Window air conditioner. Older refrigerator & kitchen stove. Large living room & kitchen. You have to walk thru one bedroom to get to the other one. Nice large fenced yard. Has a carport & an older garage that owner used for storage. Needs a new floor. Metal roof is 4-5 years old.
Key facts
- Metal roof
- Large fenced yard
- Carport
Tags
Property features AI
Exterior
- Parking: Detached garage; Carport; 1 garage space
- Utilities: Public water; Septic tank
- Home design: Ranch-style residence; Single-story
- Construction: Frame construction; Metal roof
- Exterior features: Porch; Fenced yard; Waterfront lot on a creek/stream
Interior
- Kitchen: Electric range; Refrigerator
- Flooring: Carpet; Vinyl
- Bathrooms: 1 full bathroom
- Heating & cooling: Baseboard heating; Window air conditioning units
- Interior features: Eat-in kitchen; Storm windows; Partial basement with sump pump
Neighborhood map
What this means for you Summary
Snapshot
- This is a 2-bed/1.0-bath single-family listed at $30k.
Deal economics
- At list price, monthly cash flow is $97 ($1k/yr) — positive.
- The deal already cash-flows at list — no discount required.
- Meets the 1% rule at list price ($880 rent vs $30k).
- Recommended offer: $26k (12.0% below list) — sets the bar for market timing.
Location & tenants
- Location reads 64/100 on livability (#149 in WV) — a middle-class / working-renter tenant base. Strengths: employment A+, cost of living A+, crime A; Watch: amenities F, commute F, housing F.
- Boone County Schools (rural): math 26% / reading 36% proficiency, ranked #26 of 55 in WV (top 47%) — families likely to look elsewhere, expect single-tenant / working-renter base with shorter leases.
- Zoned schools: Van Elementary (math 24% / reading 24%, grade F, #287 of 377 statewide, top 85%, 155 students, 0% FRL); Van Junior Senior High School (math 22% / reading 37%, grade F, #69 of 110 statewide, top 71%, 177 students, 0% FRL) — zoned schools average 0% FRL vs 43% district-wide (43 pts lower); this property's tenant base skews higher-income than the district average.
- Market conditions: 2 active listings in the ZIP; 4 units permitted in Boone County in 2024 (0 in 5+ unit buildings).
Forward outlook
- In year one you build about $2k of equity ($204 loan paydown + $1k appreciation (4.8% local appreciation)).
- Boone County population projected at -34% by 2050 — secular population decline; favor cash flow + early exit over multi-decade hold.
- At projected returns (4.8% appreciation + 3.0% rent growth), your $8k cash investment doubles in ~3 years — after that, you're playing with house money.
Negotiation context
- It's been on market 196 days — a 12% lower offer ($26k) is reasonable based on typical stale-listing flexibility.
Risks & watch-outs
- Watch-outs: flood insurance adds $427/mo; built in 1950 — expect roof / HVAC / electrical / plumbing capex.
- Climate carrying-cost: in FEMA flood zone AE (mandatory federal flood insurance); extreme-heat days projected 8→22/yr by 2055 (HVAC capex compounding) — expect insurance premiums to compound above CPI over the hold.
Questions for the listing agent
- It's been on market 196 days. Have you received any prior offers? Is the seller open to a 12% concession, seller financing, or rate buy-down credit?
- Built in 1950 — when were the roof, HVAC, electrical panel, plumbing, and water heater last replaced?
- What's the actual annual flood-insurance premium (NFIP or private), and is the property in a SFHA with mandatory coverage?
- Why hasn't it sold? Are there any deal-killer items the seller is aware of (foundation, flood, title, zoning, code violations)?
- Is there a deadline driving the sale (1031 exchange, divorce, estate, relocation)? That informs how much negotiation room exists.
- Schools are A-rated — typically a magnet for longer-tenancy family renters. What's the average tenant stay here, and is there a school-zone premium baked into asking?
- What's the average days-on-market for RENTAL listings here right now (not sales)? A rising rental-DOM trend means longer vacancies and softer asking-rent achievability than the comps imply.
- What's the recent tenant-quality profile in this submarket — average credit score on applications, eviction rate, late-payment / NSF rate, and stable-employment percentage? A property-management company in the area should have these aggregated.
- How much new for-sale + rental construction is in the pipeline within 1–3 miles? Heavy new supply typically softens prices + rents 12–24 months out; constrained supply supports both.
Investment metrics
- 1% rule
- 2.98% ✓
- Cap rate
- 27.58%
- Cash-on-cash
- 76.01%
- DSCR
- 4.38
- GRM
- 2.8
CMA / ARV
No comps found within radius.
Projected returns pro-forma
4.84% appreciation · 3.0% rent growth · sell at horizon
- IRR
- 25.1%
- Equity multiple
- 2.57×
- Total profit
- $12,938
- Equity at exit
- $16,426
- IRR
- 24.6%
- Equity multiple
- 5.17×
- Total profit
- $34,415
- Equity at exit
- $28,110
Cash invested: $8,260 (down + closing). Projections, not guarantees.
Landlord ↔ Tenant lean methodology
- Overall (STATE)
- 83 Strongly Landlord-Friendly
- State West Virginia
- 83 Strongly Landlord-Friendly · R+22
- County
- — inherits STATE
- City
- — inherits STATE
ZIP-level market 25028
- Home prices YoY
- 4.5%
- Active inventory
- 2
- Price-to-rent
- 2.8×
Monthly cashflow live
- Estimated rent
- $880 medium interval (Pro) →
- Mortgage (P&I)
- −$155
- Tax from tax record
- −$5 /mo · $60/yr
- Insurance
- −$12
- Flood insurance flood zone
- −$427 /mo · $5,118/yr
- HOA
- −$0
- Vacancy / Maint / Mgmt
- −$185
- Net cashflow
- $97
Break-even live
UW: 25.0% down · 7.5% · 30yr · 1.5% tax · 5.0% vac · 8.0% maint · 8.0% mgmt
Financing live
Cash to close
- Down payment
- $7,375
- Closing costs
- $885
- Reserves months
- —
- Total cash needed
- —
Loan-product check · same deal, 3 products live
Conventional
25% down · 7.5% · 30yr
- Down + closing
- —
- Monthly P&I
- —
- Monthly cashflow
- —
- DSCR
- —
- Eligible?
- —
Personal DTI + credit; lowest rate.
DSCR
20% down · 8.5% · 30yr
- Down + closing
- —
- Monthly P&I
- —
- Monthly cashflow
- —
- DSCR
- —
- Eligible?
- —
No personal income docs; deal must DSCR.
Hard money
10% down · 12.0% · 12mo
- Down + closing
- —
- Monthly P&I
- —
- Monthly cashflow
- —
- DSCR
- —
- Eligible?
- —
Short-term bridge; refi at stabilization.
Listing history 19 events
-
2026-06-18days on market $29,500 Active 196 DOM
-
2026-06-17days on market $29,500 Active 195 DOM
-
2026-06-16days on market $29,500 Active 194 DOM
-
2026-06-15days on market $29,500 Active 193 DOM
-
2026-06-15days on market $29,500 Active 192 DOM
-
2026-06-13days on market $29,500 Active 191 DOM
-
2026-06-12days on market $29,500 Active 190 DOM
-
2026-06-09days on market $29,500 Active 187 DOM
-
2026-06-08days on market $29,500 Active 186 DOM
-
2026-06-08days on market $29,500 Active 185 DOM
-
2026-06-07days on market $29,500 Active 184 DOM
-
2026-06-04days on market $29,500 Active 182 DOM
-
2026-06-03days on market $29,500 Active 181 DOM
-
2026-06-02days on market $29,500 Active 180 DOM
-
2026-06-01days on market $29,500 Active 179 DOM
-
2026-05-31days on market $29,500 Active 178 DOM
-
2026-05-11price $29,500
-
2026-03-25price $33,500
-
2025-12-04$37,500 Active
ⓘ Source: listings_history table (triggers on properties + properties_extension) + one-shot
backfill from property_details.listing_events for pre-trigger history.
Tax reassessment forecast WV · Resets to sale price
- Current annual tax
- $60 · $5/mo
- Projected year-2 tax
- $174 · $15/mo
- Expected delta
- +$114/yr (+$10/mo · 190.1%)
ⓘ Screening estimate from a state-policy table — verify with the county assessor before closing.
Climate risk First Street
- Flood 9/10 Extreme FEMA zone AE · 99% chance over 30 yrs
- Wildfire 4/10 Moderate
- Heat 5/10 Major 8 d/yr ≥97°F today · 22 d/yr by 30 yrs out
- Wind 2/10 Low 100% chance of damaging wind over 30 yrs
- Air quality 1/10 Low 0 unhealthy d/yr today · 0 by 30 yrs out
Nearby sold comps map
Loading sold comps map…
Walkable amenities ~0.75 mi
Loading nearby amenities…
Taxation est. · year 1
- Rental income
- $10,560
- − Mortgage interest
- −$1,652
- − Property taxes
- −$60
- − Insurance
- −$5,266
- − Repairs & maintenance
- −$845
- − Management
- −$845
- − Depreciation
- −$858
- Taxable income
- $1,034
- Est. tax owed @ 24.0%
- −$248
- After-tax cash flow
- $912/yr
For passive investors: Depreciation is non-cash, so a rental often shows a tax loss while cash-flowing — sheltering income. Rental losses are passive: they offset passive income freely, and up to $25,000/yr can offset ordinary (W-2) income if you actively participate and your MAGI is under $100k (phasing out to $0 by $150k); unused losses carry forward. On sale, claimed depreciation is recaptured at up to 25%, and gains may owe capital-gains tax (a 1031 exchange can defer both). Figures are a year-1 estimate at your 24.0% rate — not tax advice; consult a CPA.
Schools (NCES district)
- District
- Boone County Schools
- NCES district ID
- 5400090
- Math proficiency
- 26% ▼ -10.00%
- Reading proficiency
- 36% ▼ -7.00%
- Median HH income
- $39,554
- Composite
- 26.0/100
- National rank
- #7318
- State rank
- #26 of 55 in WV
Livability — Van
- Score
- 64/100
- State rank
- #149
- US rank
- #14574
Category grades
Schools grade is shown separately in the Schools card above.
Census & demographics
- Population (ZIP)
- 234
Population outlook (Boone County) Hauer SSP2
- Today (2025)
- 20,544 people
- By 2030
- 19,019 · -7.4%
- By 2040
- 16,026 · -22.0%
- By 2050
- 13,482 · -34.4%
- By 2075
- 8,854 · -56.9%
- By 2100
- 6,046 · -70.6%
Race, ethnicity, and origin ACS 2023
- Neighborhood character
- Predominantly White (100%)
- Race & ethnicity
- White 100%
- Common ancestry
- Serbian 6%
Political lean MEDSL · Boone
- 2024 margin
- Solid R (+57.4) · D 20.1% · R 77.5% · Other 2.3%
- 2008→2024 swing
- -68.1pp toward R · 2008: 10.7pp · 2024: -57.4pp
- All cycles
- 2024: R+57.4 2020: R+53.0 2016: R+54.3 2012: R+31.3 2008: D+10.7
Not yet ingested
- Civics
- —
Market trends
- HPI YoY
- ▲ 4.84%
- Current HPI
- 113.183
- Rent YoY
- —
- Metro
- —
- State GDP YoY
- —
- F500 in state
- 0
Price history
-21.3% since first listed3 events — show timeline
- 2026-05-11 Price Changed $29,500 KVBOR
- 2026-03-25 Price Changed $33,500 KVBOR
- 2025-12-04 Listed $37,500 KVBOR
Cash-flow waterfall
monthlySold comps — $/sqft
last 12 mo · ≤1 miLoading sold comps…