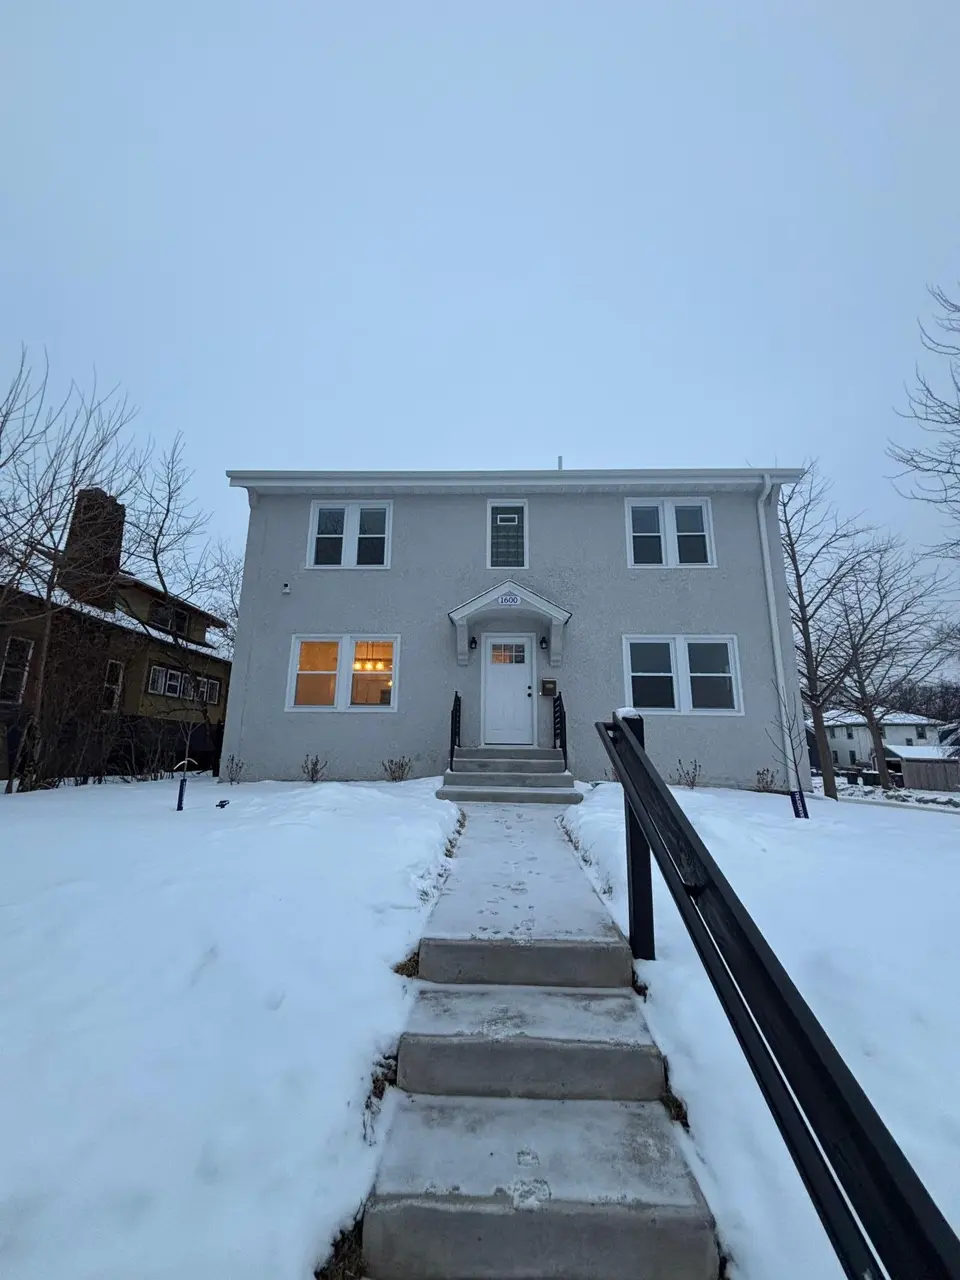
1600 Oliver Ave N · Minneapolis, MN
Flood risk 1/10 · Minimal
- FEMA flood zone
- X (unshaded)
- Chance of flooding over 30 yrs
- 0.0%
- Est. flood insurance / yr
- $473 – $860
Fire risk 1/10 · Minimal
- Est. fire insurance / yr
- $888 – $1,650
Heat risk 2/10 · Minimal
- Hot days now (above 99°F)
- 7 days/yr
- Hot days in 30 yrs
- 14 days/yr
Wind risk 2/10 · Minimal
- Chance of severe wind over 30 yrs
- —
Air-quality risk 2/10 · Minimal
- Unhealthy air days now
- 1 days/yr
- Unhealthy air days in 30 yrs
- 1 days/yr
Risk factors via First Street. Map © Google.
Why this score? — see what drove the B grade
The composite is a weighted blend of 9 inputs, each scored 0–100. Each bar is that input's sub-score; the figure is the points it added to the 100-point composite (weight × sub-score).
- Cash flow +30.0/30.0
- 1% rule +10.0/10.0
- DSCR +10.0/10.0
- ARV discount +7.5/15.0
- Rent growth +4.3/5.0
- Livability +3.9/5.0
- Schools +3.5/10.0
- Condition / age +2.5/5.0
- Appreciation +0.0/10.0
$98,500
🖨 Deal sheet 📄 Offer letter ✓ Due diligence
Listing remarks MLS
This beautifully rehabbed 4 bedroom 2 bathroom in Willard Hay was made possible by the Minneapolis Homes initiative and will be sold to a buyer meeting the income requirements of 40% or less of the Area Median Income, based on household size. This will be a perpetually affordable property in partnership with the City of Lakes Community Land Trust.
Key facts
- 5,662 sq ft lot
- Garage
- Built 1926
Neighborhood map
What this means for you Summary
Snapshot
- This is a 4-bed/1.5-bath single-family listed at $98k.
Deal economics
- At list price, monthly cash flow is $1k ($14k/yr) — positive.
- The deal already cash-flows at list — no discount required.
- Meets the 1% rule at list price ($2k rent vs $98k).
- Recommended offer: $97k (1.5% below list) — sets the bar for market timing.
- Cap rate 20.4% vs local median 3.1% in Minneapolis — top-decile yield for the area; either an underpriced asset or a hidden risk that comps aren't pricing in. Stress-test before assuming the spread holds.
Location & tenants
- Location reads 78/100 on livability (#110 in MN, #2,525 nationally) — a middle-class / working-renter tenant base. Strengths: amenities A+, commute A+, housing A+; Watch: cost of living C-, crime F.
- Minneapolis Public School District (urban): math 35% / reading 46% proficiency, ranked #217 of 301 in MN (top 72%) — families likely to look elsewhere, expect single-tenant / working-renter base with shorter leases.
- Market conditions: Rents rising fast (+7.3%/yr); 132 active listings in the ZIP; 26 comparable units currently listed for rent nearby; rentals at typical pace (median 18d on market — plan ~3-4 weeks tenant-placement turnaround); 4,651 units permitted in Hennepin County in 2024 (2,443 in 5+ unit buildings).
- At $2,453/mo this rent would consume 49% of the median local household income ($60k/yr) (locally 1826% of renters already pay >50% of income on rent) — very limited rent-growth headroom before tenants either downsize or default.
Forward outlook
- Local home prices are declining (-3.0%/yr); year-one equity from $681 of loan paydown is wiped out by about $3k of value loss. Plan a longer hold.
- Hennepin County population projected at +30% by 2050 — long-run rental-demand tailwind backs the buy-and-hold thesis.
- At projected returns (-3.0% appreciation + 7.3% rent growth), your $28k cash investment doubles in ~3 years — after that, you're playing with house money.
Negotiation context
- It's been on market 23 days — a 2% lower offer ($97k) is reasonable based on typical stale-listing flexibility.
- 3 sale attempts with the ask held roughly flat each time — persistent listings suggest the price (not the market) is what's stuck; bring a comps-based counter.
Risks & watch-outs
- Watch-outs: property tax is 2.7% of price; built in 1926 — expect roof / HVAC / electrical / plumbing capex.
Questions for the listing agent
- Built in 1926 — when were the roof, HVAC, electrical panel, plumbing, and water heater last replaced?
- Property tax is high relative to price — has the assessment been appealed recently, and will the sale trigger a re-assessment?
- Is there a deadline driving the sale (1031 exchange, divorce, estate, relocation)? That informs how much negotiation room exists.
- Crime grade is F in this area — have there been break-ins, vandalism, or insurance claims at this property in the last 3 years? What carrier currently insures it and at what premium?
- What's the average days-on-market for RENTAL listings here right now (not sales)? A rising rental-DOM trend means longer vacancies and softer asking-rent achievability than the comps imply.
- What's the recent tenant-quality profile in this submarket — average credit score on applications, eviction rate, late-payment / NSF rate, and stable-employment percentage? A property-management company in the area should have these aggregated.
- How much new for-sale + rental construction is in the pipeline within 1–3 miles? Heavy new supply typically softens prices + rents 12–24 months out; constrained supply supports both.
Investment metrics
- 1% rule
- 2.49% ✓
- Cap rate
- 20.38%
- Cash-on-cash
- 50.32%
- DSCR
- 3.24
- GRM
- 3.3
CMA / ARV
- ARV (median comp)
- $291,827
- List price
- $98,500
- Delta
- -66.25%
- Verdict
- UNDERPRICED
- Comps
- 5 within 1.0 mi
Projected returns pro-forma
-3.0% appreciation · 7.35% rent growth · sell at horizon
- IRR
- 53.2%
- Equity multiple
- 3.50×
- Total profit
- $68,999
- Equity at exit
- $14,687
- IRR
- 60.2%
- Equity multiple
- 8.46×
- Total profit
- $205,645
- Equity at exit
- $8,516
Cash invested: $27,580 (down + closing). Projections, not guarantees.
Landlord ↔ Tenant lean methodology
- Overall (CITY)
- 34 Tenant-Leaning
- State Minnesota
- 46 Balanced · D+2
- County
- — inherits STATE
- City Minneapolis
- 34 Tenant-Leaning · D+50
ZIP-level market 55411
- Home prices YoY
- -8.7%
- Rents YoY
- 7.3%
- Active inventory
- 132
- Price-to-rent
- 3.3×
Monthly cashflow live
- Estimated rent
- $2,453 high interval (Pro) →
- Mortgage (P&I)
- −$517
- Tax from tax record
- −$224 /mo · $2,690/yr
- Insurance
- −$41
- HOA
- −$0
- Vacancy / Maint / Mgmt
- −$515
- Net cashflow
- $1,156
Break-even live
UW: 25.0% down · 7.5% · 30yr · 1.5% tax · 5.0% vac · 8.0% maint · 8.0% mgmt
Financing live
Cash to close
- Down payment
- $24,625
- Closing costs
- $2,955
- Reserves months
- —
- Total cash needed
- —
Loan-product check · same deal, 3 products live
Conventional
25% down · 7.5% · 30yr
- Down + closing
- —
- Monthly P&I
- —
- Monthly cashflow
- —
- DSCR
- —
- Eligible?
- —
Personal DTI + credit; lowest rate.
DSCR
20% down · 8.5% · 30yr
- Down + closing
- —
- Monthly P&I
- —
- Monthly cashflow
- —
- DSCR
- —
- Eligible?
- —
No personal income docs; deal must DSCR.
Hard money
10% down · 12.0% · 12mo
- Down + closing
- —
- Monthly P&I
- —
- Monthly cashflow
- —
- DSCR
- —
- Eligible?
- —
Short-term bridge; refi at stabilization.
Rent comps 26 comps
| Address | Beds | Baths | Sqft | Rent | $/sqft | DOM | Units | Dist |
|---|---|---|---|---|---|---|---|---|
| 1504 Queen Ave N Minneapolis, MN | 3.0 | 1.5 | 1746 | $2,800 | $1.60 | 1d | 1 | 0.12mi |
| 1429 Knox Ave N Unit 1429 Minneapolis, MN | 4.0 | 1.0 | 1260 | $1,995 | $1.58 | 43d | 1 | 0.24mi |
| 1239 Knox Ave N Minneapolis, MN | 4.0 | 1.0 | 1944 | $2,400 | $1.23 | 4d | 1 | 0.37mi |
| 1312 18th Ave N Minneapolis, MN | 3.0 | 1.0 | 1520 | $1,899 | $1.25 | 7d | 1 | 0.48mi |
| 1414 Golden Valley Rd Unit 2 Minneapolis, MN | 5.0 | 2.0 | 2000 | $2,595 | $1.30 | 43d | 1 | 0.49mi |
| 1030 Knox Ave N Apt 3 Minneapolis, MN | 5.0 | 1.5 | 1500 | $2,450 | $1.63 | 43d | 1 | 0.52mi |
| 2324 Logan Ave N Minneapolis, MN | 4.0 | 1.5 | 1400 | $2,300 | $1.64 | 44d | 1 | 0.57mi |
| 1510 N 22nd Ave #1 Minneapolis, MN | 3.0 | 1.0 | 1500 | $1,875 | $1.25 | 4d | 1 | 0.59mi |
| 1510 N 22nd Ave #1 Minneapolis, MN | 3.0 | 1.0 | 1500 | $1,875 | $1.25 | 21d | 1 | 0.59mi |
| 522 N Newton Ave Unit 1 Minneapolis, MN | 4.0 | 2.0 | 2000 | $2,100 | $1.05 | 43d | 1 | 0.81mi |
| 519 Penn Ave N Minneapolis, MN | 4.0 | 2.0 | 1500 | $2,195 | $1.46 | 14d | 1 | 0.81mi |
| 519 Penn Ave N Minneapolis, MN | 4.0 | 2.0 | 1500 | $2,195 | $1.46 | 7d | 1 | 0.81mi |
| 1113 N 25th Ave Minneapolis, MN | 5.0 | 2.0 | 2295 | $2,695 | $1.17 | 17d | 1 | 0.89mi |
| 1901 4th Ave N Minneapolis, MN | 3.0 | 2.0 | 1300 | $1,300 | $1.00 | 24d | 1 | 0.95mi |
| 2647 Fremont Ave N Minneapolis, MN | 5.0 | 1.0 | 1508 | $2,595 | $1.72 | 14d | 1 | 1.02mi |
| 1611 Glenwood Ave #2 Minneapolis, MN | 3.0 | 2.0 | 1800 | $2,100 | $1.17 | 14d | 1 | 1.03mi |
| 2819 Girard Ave N Minneapolis, MN | 5.0 | 2.0 | 1718 | $2,300 | $1.34 | 43d | 1 | 1.09mi |
| 2646 Dupont Ave N Unit 2 Minneapolis, MN | 4.0 | 1.0 | 1514 | $2,245 | $1.48 | 43d | 1 | 1.10mi |
| 2923 Girard Ave N Minneapolis, MN | 5.0 | 2.0 | 1760 | $2,795 | $1.59 | 21d | 1 | 1.16mi |
| 3114 Morgan Ave N Minneapolis, MN | 4.0 | 2.0 | 1362 | $2,000 | $1.47 | 14d | 1 | 1.23mi |
| 2643 Lyndale Ave N Minneapolis, MN | 4.0 | 2.0 | 2198 | $750 | $0.34 | 16d | 1 | 1.25mi |
| 3105 N Girard Ave Unit 2 Minneapolis, MN | 4.0 | 1.0 | 1250 | $2,300 | $1.84 | 24d | 1 | 1.30mi |
| 3238 Humboldt Ave N Minneapolis, MN | 5.0 | 1.0 | 1389 | $2,100 | $1.51 | 43d | 1 | 1.42mi |
| 3315 James Ave N Minneapolis, MN | 4.0 | 1.0 | 1400 | $2,100 | $1.50 | 4d | 1 | 1.45mi |
| 2035 W River Rd Minneapolis, MN | 1.0–4.0 | 2.0 | 1034 | $2,503 | $2.42 | 4d | 10 | 1.46mi |
| 721 N 3rd St Minneapolis, MN | 3.0 | 1.0–2.0 | 972 | $4,630 | $4.76 | 2d | 10 | 1.47mi |
Listing history 6 events
-
2026-05-11status Pending 349-char remark
Show marketing remark (349 chars)
This beautifully rehabbed 4 bedroom 2 bathroom in Willard Hay was made possible by the Minneapolis Homes initiative and will be sold to a buyer meeting the income requirements of 40% or less of the Area Median Income, based on household size. This will be a perpetually affordable property in partnership with the City of Lakes Community Land Trust.
-
2026-04-21status Active 349-char remark
Show marketing remark (349 chars)
This beautifully rehabbed 4 bedroom 2 bathroom in Willard Hay was made possible by the Minneapolis Homes initiative and will be sold to a buyer meeting the income requirements of 40% or less of the Area Median Income, based on household size. This will be a perpetually affordable property in partnership with the City of Lakes Community Land Trust.
-
2026-04-17status Active 349-char remark
Show marketing remark (349 chars)
This beautifully rehabbed 4 bedroom 2 bathroom in Willard Hay was made possible by the Minneapolis Homes initiative and will be sold to a buyer meeting the income requirements of 40% or less of the Area Median Income, based on household size. This will be a perpetually affordable property in partnership with the City of Lakes Community Land Trust.
-
2026-03-12status Pending 349-char remark
Show marketing remark (349 chars)
This beautifully rehabbed 4 bedroom 2 bathroom in Willard Hay was made possible by the Minneapolis Homes initiative and will be sold to a buyer meeting the income requirements of 40% or less of the Area Median Income, based on household size. This will be a perpetually affordable property in partnership with the City of Lakes Community Land Trust.
-
2026-03-04historical Contingent - Inspection 349-char remark
Show marketing remark (349 chars)
This beautifully rehabbed 4 bedroom 2 bathroom in Willard Hay was made possible by the Minneapolis Homes initiative and will be sold to a buyer meeting the income requirements of 40% or less of the Area Median Income, based on household size. This will be a perpetually affordable property in partnership with the City of Lakes Community Land Trust.
-
2026-03-02$98,500 Active 349-char remark
Show marketing remark (349 chars)
This beautifully rehabbed 4 bedroom 2 bathroom in Willard Hay was made possible by the Minneapolis Homes initiative and will be sold to a buyer meeting the income requirements of 40% or less of the Area Median Income, based on household size. This will be a perpetually affordable property in partnership with the City of Lakes Community Land Trust.
ⓘ Source: listings_history table (triggers on properties + properties_extension) + one-shot
backfill from property_details.listing_events for pre-trigger history.
Tax reassessment forecast MN · Partial reset (capped growth)
- Current annual tax
- $2,690 · $224/mo
- Projected year-2 tax
- $2,690 · $224/mo
- Expected delta
- $0/yr ($0/mo · 0.0%)
ⓘ Screening estimate from a state-policy table — verify with the county assessor before closing.
Climate risk First Street
- Flood 1/10 Low FEMA zone X (unshaded) · 0% chance over 30 yrs
- Wildfire 1/10 Low
- Heat 2/10 Low 7 d/yr ≥99°F today · 14 d/yr by 30 yrs out
- Wind 2/10 Low
- Air quality 2/10 Low 1 unhealthy d/yr today · 1 by 30 yrs out
Nearby sold comps map
Loading sold comps map…
Walkable amenities ~0.75 mi
Loading nearby amenities…
Taxation est. · year 1
- Rental income
- $29,440
- − Mortgage interest
- −$5,518
- − Property taxes
- −$2,690
- − Insurance
- −$492
- − Repairs & maintenance
- −$2,355
- − Management
- −$2,355
- − Depreciation
- −$2,865
- Taxable income
- $13,165
- Est. tax owed @ 24.0%
- −$3,160
- After-tax cash flow
- $10,718/yr
For passive investors: Depreciation is non-cash, so a rental often shows a tax loss while cash-flowing — sheltering income. Rental losses are passive: they offset passive income freely, and up to $25,000/yr can offset ordinary (W-2) income if you actively participate and your MAGI is under $100k (phasing out to $0 by $150k); unused losses carry forward. On sale, claimed depreciation is recaptured at up to 25%, and gains may owe capital-gains tax (a 1031 exchange can defer both). Figures are a year-1 estimate at your 24.0% rate — not tax advice; consult a CPA.
Schools (NCES district)
- District
- Minneapolis Public School District
- NCES district ID
- 2721240
- Math proficiency
- 35% ▼ -7.00%
- Reading proficiency
- 46% ▼ -1.00%
- Median HH income
- $50,521
- Composite
- 34.92/100
- National rank
- #5067
- State rank
- #217 of 301 in MN
Livability — Minneapolis
- Score
- 78/100
- State rank
- #110
- US rank
- #2525
Category grades
Schools grade is shown separately in the Schools card above.
Census & demographics
- Census place
- Minneapolis, MN
- County
- Hennepin County · 1,150,272 people
- City population
- 417,555
- Metro
- Minneapolis-St. Paul-Bloomington, MN-WI
- Population (ZIP)
- 27,741
- Household income
- $60,225
- Rent vs Own
- Severe rent burden
- 1826.0
Population outlook (Hennepin County) Hauer SSP2
- Today (2025)
- 1,405,227 people
- By 2030
- 1,492,650 · +6.2%
- By 2040
- 1,660,157 · +18.1%
- By 2050
- 1,823,498 · +29.8%
- By 2075
- 2,221,283 · +58.1%
- By 2100
- 2,509,976 · +78.6%
Race, ethnicity, and origin ACS 2023
- Neighborhood character
- Diverse neighborhood (Simpson 0.68)
- Race & ethnicity
- Black 49% White 23% Two or more races 11% Hispanic / Latino 11% Asian 9%
- Hispanic origin (detail)
- Mexican 7% Puerto Rican 1%
- Common ancestry
- Portuguese 3% Lithuanian 2% Italian 1%
- Foreign-born
- 19% · Canada, Guatemala
- Languages at home
- 68% English-only · Other Asian/Pacific 8% Spanish 8%
Political lean MEDSL · Hennepin
- 2024 margin
- Solid D (+42.6) · D 70.2% · R 27.5% · Other 2.3%
- 2008→2024 swing
- +14.0pp toward D · 2008: 28.6pp · 2024: 42.6pp
- All cycles
- 2024: D+42.6 2020: D+43.2 2016: D+35.3 2012: D+27.1 2008: D+28.6
Not yet ingested
- Civics
- —
Market trends
- HPI YoY
- ▼ -33.91%
- Current HPI
- 356.6758
- Rent YoY
- ▲ 7.35%
- Metro
- Minneapolis-St. Paul-Bloomington, MN-WI
- State GDP YoY
- ▲ 2.41%
- F500 in state
- 34
Industry mix (Fortune 500 HQ in MN)
| Industry | F500 HQs | Revenue |
|---|---|---|
| Healthcare | 2 | $407B |
|
||
| Retail | 2 | $150B |
|
||
| Consumer Goods | 2 | $32B |
|
||
| Industrial Machinery | 2 | $6B |
|
||
| Agriculture | 1 | $40B |
|
||
| Healthcare / Medical Devices | 1 | $32B |
|
||
Price history
6 events — show timeline
- 2026-05-11 Pending — NORTHSTARMLS as Distributed by MLS Grid
- 2026-04-21 Relisted — NORTHSTARMLS as Distributed by MLS Grid
- 2026-04-17 Relisted — NORTHSTARMLS as Distributed by MLS Grid
- 2026-03-12 Pending — NORTHSTARMLS as Distributed by MLS Grid
- 2026-03-04 Contingent — NORTHSTARMLS as Distributed by MLS Grid
- 2026-03-02 Listed $98,500 NORTHSTARMLS as Distributed by MLS Grid
Property tax history
+8.4%/yrLatest (2019): $2,690 · +0.0% YoY. Source: county tax records.
Cash-flow waterfall
monthlySold comps — $/sqft
last 12 mo · ≤1 miLoading sold comps…