344 Paul St · Cabool, MO
Flood risk 1/10 · Minimal
- FEMA flood zone
- X
- Chance of flooding over 30 yrs
- 0.0%
- Est. flood insurance / yr
- $507 – $1,088
Fire risk 5/10 · Moderate
- Est. fire insurance / yr
- $1,054 – $1,958
Heat risk 5/10 · Moderate
- Hot days now (above 105°F)
- 7 days/yr
- Hot days in 30 yrs
- 19 days/yr
Wind risk 2/10 · Minimal
- Chance of severe wind over 30 yrs
- 1.0%
Air-quality risk 1/10 · Minimal
- Unhealthy air days now
- 0 days/yr
- Unhealthy air days in 30 yrs
- 0 days/yr
Risk factors via First Street. Map © Google.
Why this score? — see what drove the B grade
The composite is a weighted blend of 9 inputs, each scored 0–100. Each bar is that input's sub-score; the figure is the points it added to the 100-point composite (weight × sub-score).
- Cash flow +28.5/30.0
- DSCR +10.0/10.0
- Appreciation +9.7/10.0
- ARV discount +7.5/15.0
- 1% rule +6.8/10.0
- Livability +3.4/5.0
- Rent growth +2.5/5.0
- Schools +2.5/10.0
- Condition / age +2.5/5.0
$79,900
🖨 Deal sheet (PDF) 📄 Offer letter ✓ Due diligence
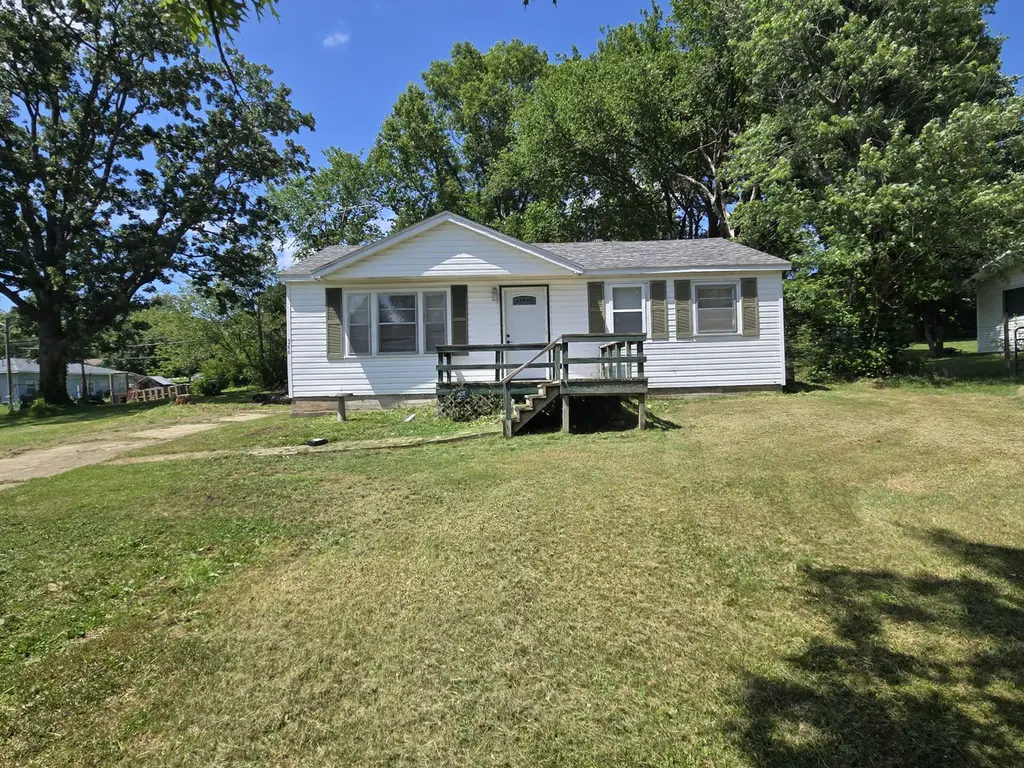
Listing remarks
Welcome home to this charming 3-bedroom, 1-bath residence nestled in a quiet neighborhood in Cabool, Missouri. Whether you're searching for your first home or looking to add a solid investment property to your portfolio, this home offers plenty of potential. Inside, you'll find a comfortable layout with spacious living areas and three well-sized bedrooms. The property provides a great opportunity for first-time homebuyers, small families, or investors seeking a rental property in a desirable location. Enjoy the peaceful setting while still being conveniently close to schools, shopping, and local amenities. With its affordable appeal and versatile potential, this property is a great place to
Key facts
- 0.31 acre lot
- Built 1962
- Listed 2 days
Property features AI
Finance
- Other: Lot approximately 0.31 acre
- Financial info: Tax amount provided (financial specifics excluded per instructions)
- HOA & community: HOA information not provided
Exterior
- Parking: Parking details not provided
- Security: Security details not provided
- Utilities: Public water; Public sewer
- Home design: Single-family residence; One level
- Construction: Construction details not provided
- Exterior features: City street frontage; Publicly maintained road
Interior
- Kitchen: Built-in electric oven; Microwave
- Bedrooms: Includes bedrooms (number not specified)
- Flooring: Flooring details not provided
- Bathrooms: One full bathroom
- Heating & cooling: Natural gas heating; Central air conditioning
- Interior features: Built-in electric oven; Microwave; Central heating
- Laundry & utility: Laundry details not provided
Neighborhood map
What this means for you Summary
Snapshot
- This is a 3-bed/1.0-bath other listed at $80k.
Deal economics
- At list price, monthly cash flow is $262 ($3k/yr) — positive.
- The deal already cash-flows at list — no discount required.
- Meets the 1% rule at list price ($943 rent vs $80k).
- Cap rate 10.2% vs local median 3.0% in Cabool — top-decile yield for the area; either an underpriced asset or a hidden risk that comps aren't pricing in. Stress-test before assuming the spread holds.
Location & tenants
- Location reads 67/100 on livability (#218 in MO) — a middle-class / working-renter tenant base. Strengths: cost of living A+, crime A, housing A-; Watch: amenities F, commute F, employment F.
- Cabool R-IV (rural): math 22% / reading 39% proficiency, ranked #275 of 324 in MO (top 85%) — families likely to look elsewhere, expect single-tenant / working-renter base with shorter leases.
- Zoned schools: Cabool Elem. (math 27% / reading 37%, grade F, #761 of 1,115 statewide, top 72%, 340 students, 98% FRL); Cabool Middle (math 21% / reading 40%, grade F, #283 of 391 statewide, top 74%, 222 students, 100% FRL); Cabool High (math 15% / reading 34%, grade F, #436 of 521 statewide, top 85%, 207 students, 100% FRL) — zoned schools average 99% FRL vs 57% district-wide (42 pts higher); higher-poverty schools than district average — tighter screening recommended.
- Market conditions: 63 active listings in the ZIP; 10 units permitted in Texas County in 2024 (5 in 5+ unit buildings).
Forward outlook
- In year one you build about $8k of equity ($552 loan paydown + $8k appreciation (9.5% local appreciation)).
- Texas County population projected at -11% by 2050 — secular population decline; favor cash flow + early exit over multi-decade hold.
- At projected returns (9.5% appreciation + 3.0% rent growth), your $22k cash investment doubles in ~2 years — after that, you're playing with house money.
- By year 5, paydown + projected appreciation supports a ~$37k cash-out refi (75% LTV) — recoverable capital for the next deal without selling this one.
Negotiation context
- Only 2 days on market — expect competitive offers; lowballing is unlikely to land.
Risks & watch-outs
- Climate carrying-cost: moderate wildfire risk; extreme-heat days projected 7→19/yr by 2055 (HVAC capex compounding) — expect insurance premiums to compound above CPI over the hold.
Questions for the listing agent
- Built in 1962 — when were the roof, HVAC, electrical panel, plumbing, and water heater last replaced?
- Is there a deadline driving the sale (1031 exchange, divorce, estate, relocation)? That informs how much negotiation room exists.
- Schools are D-rated, which usually means shorter tenancies and higher turnover. Who's the typical renter profile here, and what's been the actual vacancy rate?
- What's the average days-on-market for RENTAL listings here right now (not sales)? A rising rental-DOM trend means longer vacancies and softer asking-rent achievability than the comps imply.
- What's the recent tenant-quality profile in this submarket — average credit score on applications, eviction rate, late-payment / NSF rate, and stable-employment percentage? A property-management company in the area should have these aggregated.
- How much new for-sale + rental construction is in the pipeline within 1–3 miles? Heavy new supply typically softens prices + rents 12–24 months out; constrained supply supports both.
Investment metrics
- 1% rule
- 1.18% ✓
- Cap rate
- 10.22%
- Cash-on-cash
- 14.03%
- DSCR
- 1.62
- GRM
- 7.1
CMA / ARV
No comps found within radius.
Projected returns pro-forma
9.46% appreciation · 3.0% rent growth · sell at horizon
- IRR
- 33.6%
- Equity multiple
- 3.56×
- Total profit
- $57,208
- Equity at exit
- $68,854
- IRR
- 29.2%
- Equity multiple
- 7.91×
- Total profit
- $154,614
- Equity at exit
- $145,280
Cash invested: $22,372 (down + closing). Projections, not guarantees.
Landlord ↔ Tenant lean methodology
- Overall (STATE)
- 81 Strongly Landlord-Friendly
- State Missouri
- 81 Strongly Landlord-Friendly · R+10
- County
- — inherits STATE
- City
- — inherits STATE
ZIP-level market 65689
- Home prices YoY
- 4.2%
- Active inventory
- 63
- Price-to-rent
- 7.1×
Monthly cashflow live
- Estimated rent
- $943 medium interval (Pro) →
- Mortgage (P&I)
- −$419
- Tax from tax record
- −$31 /mo · $371/yr
- Insurance
- −$33
- HOA
- −$0
- Vacancy / Maint / Mgmt
- −$198
- Net cashflow
- $262
Break-even live
Sensitivity live
| Price | -10% $307 | -5% $284 | +0% $262 | +5% $239 | +10% $216 |
|---|---|---|---|---|---|
| Rent | -10% $187 | -5% $224 | +0% $262 | +5% $299 | +10% $336 |
| Rate | -1.0pp $302 | -0.5pp $282 | base $262 | +0.5pp $241 | +1.0pp $220 |
UW: 25.0% down · 7.5% · 30yr · 1.5% tax · 5.0% vac · 8.0% maint · 8.0% mgmt
Financing live
Cash to close
- Down payment
- $19,975
- Closing costs
- $2,397
- Reserves months
- —
- Total cash needed
- —
Loan-product check · same deal, 3 products live
Conventional
25% down · 7.5% · 30yr
- Down + closing
- —
- Monthly P&I
- —
- Monthly cashflow
- —
- DSCR
- —
- Eligible?
- —
Personal DTI + credit; lowest rate.
DSCR
20% down · 8.5% · 30yr
- Down + closing
- —
- Monthly P&I
- —
- Monthly cashflow
- —
- DSCR
- —
- Eligible?
- —
No personal income docs; deal must DSCR.
Hard money
10% down · 12.0% · 12mo
- Down + closing
- —
- Monthly P&I
- —
- Monthly cashflow
- —
- DSCR
- —
- Eligible?
- —
Short-term bridge; refi at stabilization.
Listing history 2 events
-
2026-06-12remarks 699-char remark
-
2026-06-12$79,900 Pending 2 DOM
ⓘ Source: listings_history table (triggers on properties + properties_extension) + one-shot
backfill from property_details.listing_events for pre-trigger history.
Tax reassessment forecast MO · Resets to sale price
- Current annual tax
- $371 · $31/mo
- Projected year-2 tax
- $775 · $65/mo
- Expected delta
- +$404/yr (+$34/mo · 109.0%)
ⓘ Screening estimate from a state-policy table — verify with the county assessor before closing.
Climate risk First Street
- Flood 1/10 Low FEMA zone X · 0% chance over 30 yrs
- Wildfire 5/10 Major
- Heat 5/10 Major 7 d/yr ≥105°F today · 19 d/yr by 30 yrs out
- Wind 2/10 Low 100% chance of damaging wind over 30 yrs
- Air quality 1/10 Low 0 unhealthy d/yr today · 0 by 30 yrs out
Nearby sold comps map
Loading sold comps map…
Walkable amenities ~0.75 mi
Loading nearby amenities…
Taxation est. · year 1
- Rental income
- $11,313
- − Mortgage interest
- −$4,476
- − Property taxes
- −$371
- − Insurance
- −$400
- − Repairs & maintenance
- −$905
- − Management
- −$905
- − Depreciation
- −$2,324
- Taxable income
- $1,932
- Est. tax owed @ 24.0%
- −$464
- After-tax cash flow
- $2,675/yr
For passive investors: Depreciation is non-cash, so a rental often shows a tax loss while cash-flowing — sheltering income. Rental losses are passive: they offset passive income freely, and up to $25,000/yr can offset ordinary (W-2) income if you actively participate and your MAGI is under $100k (phasing out to $0 by $150k); unused losses carry forward. On sale, claimed depreciation is recaptured at up to 25%, and gains may owe capital-gains tax (a 1031 exchange can defer both). Figures are a year-1 estimate at your 24.0% rate — not tax advice; consult a CPA.
Schools (NCES district)
- District
- Cabool R-IV
- NCES district ID
- 2906430
- Math proficiency
- 22% ▼ -7.00%
- Reading proficiency
- 39% ▲ 1.00%
- Median HH income
- $32,537
- Composite
- 24.88/100
- National rank
- #7584
- State rank
- #275 of 324 in MO
Livability — Cabool
- Score
- 67/100
- State rank
- #218
- US rank
- #10822
Category grades
Schools grade is shown separately in the Schools card above.
Census & demographics
- Census place
- Cabool, MO
- City population
- 4,273
- Population (ZIP)
- 4,273
Population outlook (Texas County) Hauer SSP2
- Today (2025)
- 24,648 people
- By 2030
- 23,981 · -2.7%
- By 2040
- 22,840 · -7.3%
- By 2050
- 21,832 · -11.4%
- By 2075
- 19,481 · -21.0%
- By 2100
- 16,634 · -32.5%
Race, ethnicity, and origin ACS 2023
- Neighborhood character
- Predominantly White (86%)
- Race & ethnicity
- White 86% Two or more races 7% Hispanic / Latino 4% Asian 2%
- Common ancestry
- Romanian 4% Iranian 2% Lithuanian 1%
- Foreign-born
- 2% · Canada
- Languages at home
- 97% English-only · Spanish 3%
Political lean MEDSL · Texas
- 2024 margin
- Solid R (+71.7) · D 13.8% · R 85.5%
- 2008→2024 swing
- -36.7pp toward R · 2008: -35.1pp · 2024: -71.7pp
- All cycles
- 2024: R+71.7 2020: R+68.6 2016: R+65.4 2012: R+44.1 2008: R+35.1
Not yet ingested
- Civics
- —
Market trends
- HPI YoY
- ▲ 9.46%
- Current HPI
- 232.9575
- Rent YoY
- —
- Metro
- —
- State GDP YoY
- ▲ 1.84%
- F500 in state
- 20
Industry mix (Fortune 500 HQ in MO)
| Industry | F500 HQs | Revenue |
|---|---|---|
| Healthcare | 1 | $163B |
|
||
| Insurance | 1 | $21B |
|
||
| Industrial Technology | 1 | $17B |
|
||
| Retail | 1 | $16B |
|
||
| Industrial Distribution | 1 | $10B |
|
||
| Utilities | 1 | $9B |
|
||
Price history
2 events — show timeline
- 2026-06-11 Pending — SOMO
- 2026-06-09 Listed $79,900 SOMO
Property tax history
+4.9%/yrLatest (2025): $371 · +1.5% YoY. Source: county tax records.
Cash-flow waterfall
monthlySold comps — $/sqft
last 12 mo · ≤1 miLoading sold comps…