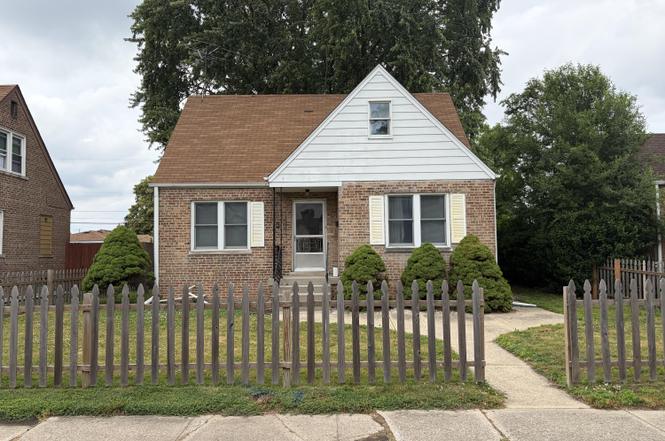
905 174th St · Hammond, IN
Flood risk 1/10 · Minimal
- FEMA flood zone
- X (unshaded)
- Chance of flooding over 30 yrs
- 0.0%
- Est. flood insurance / yr
- $473 – $860
Fire risk 1/10 · Minimal
- Est. fire insurance / yr
- $717 – $1,331
Heat risk 3/10 · Minor
- Hot days now (above 102°F)
- 7 days/yr
- Hot days in 30 yrs
- 15 days/yr
Wind risk 2/10 · Minimal
- Chance of severe wind over 30 yrs
- 0.0%
Air-quality risk 4/10 · Minor
- Unhealthy air days now
- 5 days/yr
- Unhealthy air days in 30 yrs
- 6 days/yr
Risk factors via First Street. Map © Google.
Why this score? — see what drove the C+ grade
The composite is a weighted blend of 9 inputs, each scored 0–100. Each bar is that input's sub-score; the figure is the points it added to the 100-point composite (weight × sub-score).
- Cash flow +23.3/30.0
- ARV discount +15.0/15.0
- DSCR +7.5/10.0
- 1% rule +7.0/10.0
- Rent growth +3.9/5.0
- Livability +3.5/5.0
- Condition / age +2.5/5.0
- Schools +1.1/10.0
- Appreciation +0.0/10.0
$129,900
🖨 Deal sheet (PDF) 📄 Offer letter ✓ Due diligence
Listing remarks
Attention all investors and home buyers looking for a summer project! Check out this 3-bedroom, 1-bath Cape Cod home that needs a fresh look. This property boasts great structural integrity and is conveniently located near local attractions. It has the potential to be a valuable addition to a rental portfolio, a fantastic fix-and-flip opportunity, or simply a wonderful place to call home! Do not miss your opportunity to cash in!
Key facts
- Structural integrity
- Local attractions
- Conveniently located
Tags
Property features AI
Finance
- Financial info: Property is vacant
- HOA & community: Curbs in the community
Exterior
- Parking: Detached garage; Approximately 1.5 garage spaces
- Utilities: Public water; Public sewer; Natural gas available and connected; Electricity available and connected (100 amp service)
- Home design: One-and-one-half story home; Built in 1947; Property listed as fixer condition
- Construction: Aluminum siding and brick exterior; Asphalt shingle roof; Has basement (full)
- Exterior features: Patio; Fenced yard; Rain gutters; City and neighborhood views; Aluminum-frame windows; Garage structure on property
Interior
- Kitchen: Gas range; Refrigerator
- Bedrooms: Primary bedroom; Two additional bedrooms (one listed as Bedroom 2 and one as Bedroom 3)
- Flooring: Hardwood; Carpet; Concrete; Linoleum
- Bathrooms: 1 full bathroom
- Heating & cooling: Forced air heating; Central air conditioning; Ceiling fan(s) for additional cooling
- Interior features: Ceiling fans; Eat-in kitchen; Full unfinished basement with storage space and sump pump; 6 total rooms including a loft and living room
- Laundry & utility: Washer and dryer included; Washer hookup; Gas dryer hookup; Laundry located on lower level
Neighborhood map
What this means for you Summary
Snapshot
- This is a 3-bed/1.0-bath single-family listed at $130k.
Deal economics
- At list price, monthly cash flow is $238 ($3k/yr) — positive.
- The deal already cash-flows at list — no discount required.
- Meets the 1% rule at list price ($2k rent vs $130k).
- Cap rate 8.5% vs local median 5.8% in Hammond — top-decile yield for the area; either an underpriced asset or a hidden risk that comps aren't pricing in. Stress-test before assuming the spread holds.
Location & tenants
- Location reads 70/100 on livability (#143 in IN) — a middle-class / working-renter tenant base. Strengths: cost of living A+, housing A+, commute A; Watch: health & safety D+, employment D, crime F.
- School City Of Hammond (suburban): math 8% / reading 18% proficiency, ranked #289 of 301 in IN (top 96%) — low school quality limits family demand, transient renter base, plan for 1-2y turnover; 74% free/reduced lunch — lower-income household profile, screen leases tightly.
- Zoned schools: Thomas A Edison Elementary School (math 7% / reading 11%, grade F, #935 of 994 statewide, top 94%, 665 students, 71% FRL) — zoned schools at 71% FRL track the district average.
- Market conditions: Rents rising fast (+5.5%/yr); 63 active listings in the ZIP; 7 comparable units currently listed for rent nearby; rentals leasing fast (median 14d on market — plan ~1-2 weeks tenant-placement turnaround); 1,642 units permitted in Lake County in 2024 (14 in 5+ unit buildings).
Forward outlook
- Local home prices are declining (-3.0%/yr); year-one equity from $898 of loan paydown is wiped out by about $4k of value loss. Plan a longer hold.
- Lake County population projected to shrink 7% by 2050 — rents likely to lag national; underwrite the cash flow, not the appreciation.
- At projected returns (-3.0% appreciation + 5.5% rent growth), your $36k cash investment doubles in ~10 years — after that, you're playing with house money.
Negotiation context
- Only 3 days on market — expect competitive offers; lowballing is unlikely to land.
Risks & watch-outs
- Watch-outs: built in 1947 — expect roof / HVAC / electrical / plumbing capex.
Questions for the listing agent
- Built in 1947 — when were the roof, HVAC, electrical panel, plumbing, and water heater last replaced?
- Is there a deadline driving the sale (1031 exchange, divorce, estate, relocation)? That informs how much negotiation room exists.
- Schools are F-rated, which usually means shorter tenancies and higher turnover. Who's the typical renter profile here, and what's been the actual vacancy rate?
- Crime grade is F in this area — have there been break-ins, vandalism, or insurance claims at this property in the last 3 years? What carrier currently insures it and at what premium?
- What's the average days-on-market for RENTAL listings here right now (not sales)? A rising rental-DOM trend means longer vacancies and softer asking-rent achievability than the comps imply.
- What's the recent tenant-quality profile in this submarket — average credit score on applications, eviction rate, late-payment / NSF rate, and stable-employment percentage? A property-management company in the area should have these aggregated.
- How much new for-sale + rental construction is in the pipeline within 1–3 miles? Heavy new supply typically softens prices + rents 12–24 months out; constrained supply supports both.
Investment metrics
- 1% rule
- 1.20% ✓
- Cap rate
- 8.49%
- Cash-on-cash
- 7.85%
- DSCR
- 1.35
- GRM
- 7.0
CMA / ARV
- ARV (on-the-fly)
- $193,683
- Comps found
- 12
Show comp detail 12 sales within ~0.75 mi
| Address | Dist | Beds/Ba | Sqft | Sold | Price | $/sf | Match |
|---|---|---|---|---|---|---|---|
| 7319 Oakdale Ave | 0.18mi | 3/1.0 | 1,220 (+1%) | 5mo | $197,000 | $161 | 85 |
| 7405 Howard Ave | 0.23mi | 3/1.5 | 1,156 (-4%) | 0mo | $237,000 | $205 | 81 |
| 7511 Monroe Ave | 0.34mi | 3/1.0 | 1,072 (-11%) | 3mo | $199,000 | $186 | 64 |
| 925 Cherry St | 0.70mi | 3/1.5 | 1,178 (-2%) | 3mo | $130,000 | $110 | 60 |
| 7613 Monroe Ave | 0.42mi | 4/1.0 (+1) | 1,330 (+11%) | 1mo | $196,000 | $147 | 57 |
| 7607 Monroe Ave | 0.41mi | 2/1.5 (-1) | 1,092 (-9%) | 3mo | $179,900 | $165 | 56 |
| 1320 170th Pl | 0.66mi | 3/1.0 | 1,084 (-10%) | 2mo | $111,250 | $103 | 51 |
| 737 Cherry St | 0.71mi | 3/1.0 | 1,312 (+9%) | 3mo | $145,000 | $111 | 49 |
| 1135 169th St | 0.71mi | 4/2.0 (+1) | 1,248 (+4%) | 4mo | $195,000 | $156 | 49 |
| 7742 Catalpa Ave | 0.74mi | 3/1.5 | 1,092 (-9%) | 3mo | $212,900 | $195 | 46 |
| 7341 Harrison Ave | 0.48mi | 4/2.0 (+1) | 1,365 (+14%) | 2mo | $201,995 | $148 | 45 |
| 7840 Monroe Ave | 0.70mi | 3/1.0 | 1,379 (+15%) | 1mo | $320,000 | $232 | 42 |
Match score weights: distance 35% · size 25% · config 20% · recency 20%. Top-matched comps best support the ARV.
Projected returns pro-forma
-3.0% appreciation · 5.51% rent growth · sell at horizon
- IRR
- -1.3%
- Equity multiple
- 0.95×
- Total profit
- $-1,784
- Equity at exit
- $19,369
- IRR
- 11.1%
- Equity multiple
- 1.98×
- Total profit
- $35,677
- Equity at exit
- $11,231
Cash invested: $36,372 (down + closing). Projections, not guarantees.
Landlord ↔ Tenant lean methodology
- Overall (STATE)
- 90 Strongly Landlord-Friendly
- State Indiana
- 90 Strongly Landlord-Friendly · R+11
- County
- — inherits STATE
- City
- — inherits STATE
ZIP-level market 46324
- Home prices YoY
- -9.6%
- Rents YoY
- 5.5%
- Active inventory
- 63
- Price-to-rent
- 7.0×
Monthly cashflow live
- Estimated rent
- $1,554 high interval (Pro) →
- Mortgage (P&I)
- −$681
- Tax from tax record
- −$254 /mo · $3,053/yr
- Insurance
- −$54
- HOA
- −$0
- Vacancy / Maint / Mgmt
- −$326
- Net cashflow
- $238
Break-even live
Sensitivity live
| Price | -10% $312 | -5% $275 | +0% $238 | +5% $201 | +10% $165 |
|---|---|---|---|---|---|
| Rent | -10% $115 | -5% $177 | +0% $238 | +5% $299 | +10% $361 |
| Rate | -1.0pp $303 | -0.5pp $271 | base $238 | +0.5pp $204 | +1.0pp $170 |
UW: 25.0% down · 7.5% · 30yr · 1.5% tax · 5.0% vac · 8.0% maint · 8.0% mgmt
Financing live
Cash to close
- Down payment
- $32,475
- Closing costs
- $3,897
- Reserves months
- —
- Total cash needed
- —
Loan-product check · same deal, 3 products live
Conventional
25% down · 7.5% · 30yr
- Down + closing
- —
- Monthly P&I
- —
- Monthly cashflow
- —
- DSCR
- —
- Eligible?
- —
Personal DTI + credit; lowest rate.
DSCR
20% down · 8.5% · 30yr
- Down + closing
- —
- Monthly P&I
- —
- Monthly cashflow
- —
- DSCR
- —
- Eligible?
- —
No personal income docs; deal must DSCR.
Hard money
10% down · 12.0% · 12mo
- Down + closing
- —
- Monthly P&I
- —
- Monthly cashflow
- —
- DSCR
- —
- Eligible?
- —
Short-term bridge; refi at stabilization.
Rent comps 7 comps
| Address | Beds | Baths | Sqft | Rent | $/sqft | DOM | Units | Dist |
|---|---|---|---|---|---|---|---|---|
| 7234 Columbia Ave Hammond, IN | 2.0 | 1.0 | 960 | $1,300 | $1.35 | 26d | 1 | 0.38mi |
| 7129 Columbia Ave Unit 1E Hammond, IN | 2.0 | 1.0 | 900 | $1,195 | $1.33 | 12d | 1 | 0.49mi |
| 7609 Beech Ave Hammond, IN | 2.0 | 1.0 | 700 | $1,400 | $2.00 | 5d | 1 | 0.72mi |
| 7019 Chestnut Ave Hammond, IN | 3.0 | 1.5 | 1440 | $1,895 | $1.32 | 22d | 1 | 0.78mi |
| 3649 173rd Ct Lansing, IL | 2.0 | 2.0 | 972 | $1,357 | $1.40 | 26d | 1 | 1.02mi |
| 17104 Wentworth Ave Unit 4 Lansing, IL | 2.0 | 1.0 | 1100 | $1,400 | $1.27 | 0d | 1 | 1.27mi |
| 1539 Wentworth Ave Unit 3W Calumet City, IL | 3.0 | 1.0 | 1100 | $1,700 | $1.55 | 13d | 1 | 1.35mi |
Listing history 3 events
-
2026-06-15statusdays on market $129,900 Pending 3 DOM
-
2026-06-13remarks 432-char remark
-
2026-06-13$129,900 Active 2 DOM
ⓘ Source: listings_history table (triggers on properties + properties_extension) + one-shot
backfill from property_details.listing_events for pre-trigger history.
Tax reassessment forecast IN · Partial reset (capped growth)
- Current annual tax
- $3,053 · $254/mo
- Projected year-2 tax
- $3,053 · $254/mo
- Expected delta
- $0/yr ($0/mo · 0.0%)
ⓘ Screening estimate from a state-policy table — verify with the county assessor before closing.
Climate risk First Street
- Flood 1/10 Low FEMA zone X (unshaded) · 0% chance over 30 yrs
- Wildfire 1/10 Low
- Heat 3/10 Moderate 7 d/yr ≥102°F today · 15 d/yr by 30 yrs out
- Wind 2/10 Low 0% chance of damaging wind over 30 yrs
- Air quality 4/10 Moderate 5 unhealthy d/yr today · 6 by 30 yrs out
Nearby sold comps map
Loading sold comps map…
Walkable amenities ~0.75 mi
Loading nearby amenities…
Taxation est. · year 1
- Rental income
- $18,650
- − Mortgage interest
- −$7,276
- − Property taxes
- −$3,053
- − Insurance
- −$650
- − Repairs & maintenance
- −$1,492
- − Management
- −$1,492
- − Depreciation
- −$3,779
- Taxable income
- $908
- Est. tax owed @ 24.0%
- −$218
- After-tax cash flow
- $2,639/yr
For passive investors: Depreciation is non-cash, so a rental often shows a tax loss while cash-flowing — sheltering income. Rental losses are passive: they offset passive income freely, and up to $25,000/yr can offset ordinary (W-2) income if you actively participate and your MAGI is under $100k (phasing out to $0 by $150k); unused losses carry forward. On sale, claimed depreciation is recaptured at up to 25%, and gains may owe capital-gains tax (a 1031 exchange can defer both). Figures are a year-1 estimate at your 24.0% rate — not tax advice; consult a CPA.
Schools (NCES district)
- District
- School City Of Hammond
- NCES district ID
- 1804320
- Math proficiency
- 8% ▼ -18.00%
- Reading proficiency
- 18% ▼ -15.00%
- Median HH income
- $39,970
- Composite
- 11.11/100
- National rank
- #9730
- State rank
- #289 of 301 in IN
Livability — Hammond
- Score
- 70/100
- State rank
- #143
- US rank
- #7343
Category grades
Schools grade is shown separately in the Schools card above.
Census & demographics
- Census place
- Hammond, IN
- County
- Lake County · 422,878 people
- City population
- 58,809
- Metro
- Chicago-Naperville-Elgin, IL-IN-WI
- Population (ZIP)
- 21,409
- Household income
- $63,052
- Rent vs Own
- Severe rent burden
- 507.0
Population outlook (Lake County) Hauer SSP2
- Today (2025)
- 484,026 people
- By 2030
- 478,091 · -1.2%
- By 2040
- 462,974 · -4.3%
- By 2050
- 449,894 · -7.1%
- By 2075
- 436,169 · -9.9%
- By 2100
- 426,607 · -11.9%
Race, ethnicity, and origin ACS 2023
- Neighborhood character
- Diverse neighborhood (Simpson 0.69)
- Race & ethnicity
- Hispanic / Latino 39% White 34% Black 22% Two or more races 14% Asian 1% Native American 1%
- Hispanic origin (detail)
- Mexican 31% Puerto Rican 5%
- Common ancestry
- Romanian 5% Lithuanian 1% Italian 1%
- Foreign-born
- 10% · Canada
- Languages at home
- 79% English-only · Spanish 20%
Political lean MEDSL · Lake
- 2024 margin
- Lean D (+5.6) · D 52.1% · R 46.5% · Other 1.5%
- 2008→2024 swing
- -28.6pp toward R · 2008: 34.3pp · 2024: 5.6pp
- All cycles
- 2024: D+5.6 2020: D+15.1 2016: D+20.6 2012: D+31.0 2008: D+34.3
Not yet ingested
- Civics
- —
Market trends
- HPI YoY
- ▼ -37.65%
- Current HPI
- 352.8678
- Rent YoY
- ▲ 5.51%
- Metro
- Chicago-Naperville-Elgin, IL-IN-WI
- State GDP YoY
- ▲ 2.90%
- F500 in state
- 18
Industry mix (Fortune 500 HQ in IN)
| Industry | F500 HQs | Revenue |
|---|---|---|
| Industrial Machinery | 2 | $37B |
|
||
| Healthcare | 1 | $177B |
|
||
| Pharmaceuticals | 1 | $45B |
|
||
| Metals / Steel | 1 | $18B |
|
||
| Agriculture | 1 | $17B |
|
||
| Packaging | 1 | $12B |
|
||
Price history
1 event — show timeline
- 2026-06-11 Listed $129,900 NIRA MLS as Distributed by MLS Grid
Property tax history
-1.5%/yrLatest (2024): $3,053 · -9.9% YoY. Source: county tax records.
Cash-flow waterfall
monthlySold comps — $/sqft
last 12 mo · ≤1 miLoading sold comps…