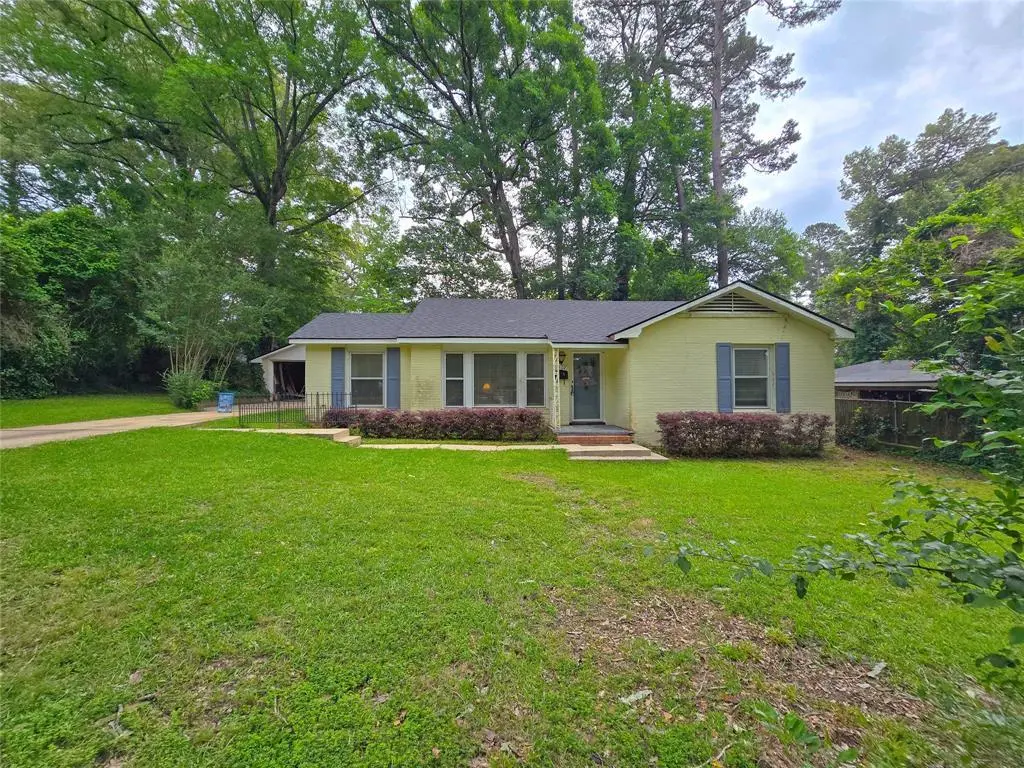
1302 Turner St · Minden, LA
Flood risk 1/10 · Minimal
- FEMA flood zone
- X (unshaded)
- Chance of flooding over 30 yrs
- 0.0%
- Est. flood insurance / yr
- $507 – $1,088
Fire risk 4/10 · Minor
- Est. fire insurance / yr
- $1,269 – $2,357
Heat risk 7/10 · Major
- Hot days now (above 111°F)
- 7 days/yr
- Hot days in 30 yrs
- 21 days/yr
Wind risk 6/10 · Moderate
- Chance of severe wind over 30 yrs
- 68.0%
Air-quality risk 1/10 · Minimal
- Unhealthy air days now
- 0 days/yr
- Unhealthy air days in 30 yrs
- 0 days/yr
Risk factors via First Street. Map © Google.
Why this score? — see what drove the C- grade
The composite is a weighted blend of 9 inputs, each scored 0–100. Each bar is that input's sub-score; the figure is the points it added to the 100-point composite (weight × sub-score).
- Cash flow +18.5/30.0
- ARV discount +15.0/15.0
- DSCR +5.8/10.0
- 1% rule +4.4/10.0
- Livability +3.4/5.0
- Rent growth +2.5/5.0
- Condition / age +2.5/5.0
- Schools +1.8/10.0
- Appreciation +0.0/10.0
$114,900
🖨 Deal sheet (PDF) 📄 Offer letter ✓ Due diligence
Listing remarks
Investor Special - Needs TLC. New Roof installed May 2026, Water heater 2022, HVAC 2020, Quiet Street, Shady lot, , 6' Fenced Backyard. Hardwood floors, Detached carport. Sold As-Is.
Key facts
- Hvac
- Detached carport
- Water heater
Tags
Property features AI
Finance
- Other: Possession at closing/funding; Standard listing conditions; Transaction type: For Sale
- Financial info: Listing terms include cash or other; Treat as clear loan type; No second mortgage indicated
- HOA & community: No association
Exterior
- Parking: Covered parking (2 spaces); Detached carport; Additional concrete parking; Carport with 2 spaces
- Utilities: City water; City sewer; Electricity connected; Co-op electric available; Individual gas meter; Individual water meter; Natural gas available; Not in a municipal utility district
- Home design: Single-family residence; Residential property; Entry and living on one level; Subdivision: LAKESIDE SUBDIV.
- Construction: Brick construction; Asphalt shingle roof; Pillar/post/pier foundation; Built in 1972 (preowned)
- Exterior features: Few trees on lot; Easements for access, drainage, electric, natural gas, utilities, water lines, and other
Interior
- Kitchen: Dishwasher
- Bedrooms: 2 bedrooms (both on the main level)
- Flooring: Ceramic tile; Wood flooring
- Bathrooms: 2 full bathrooms
- Heating & cooling: Central heating (natural gas); Central air conditioning; Electric heating components; Ceiling fan(s)
- Interior features: Eat-in kitchen; One-level layout; 5 rooms total; 1 living area; 1 dining area
- Laundry & utility: Laundry area in kitchen
Neighborhood map
What this means for you Summary
Snapshot
- This is a 2-bed/2.0-bath single-family listed at $115k.
Deal economics
- At list price, monthly cash flow is $109 ($1k/yr) — positive.
- The deal already cash-flows at list — no discount required.
- To meet the 1% rule (rent ≥ 1% of price), the offer needs to be $108k (6.2% below list).
- Recommended offer: $108k (6.2% below list) — sets the bar for 1% rule.
- Cap rate 7.4% vs local median 5.0% in Minden — top-decile yield for the area; either an underpriced asset or a hidden risk that comps aren't pricing in. Stress-test before assuming the spread holds.
Location & tenants
- Location reads 68/100 on livability (#92 in LA) — a middle-class / working-renter tenant base. Strengths: cost of living A+, health & safety A+, housing A; Watch: amenities D, crime F, commute F.
- Webster Parish (town): math 17% / reading 26% proficiency, ranked #67 of 98 in LA (top 68%) — low school quality limits family demand, transient renter base, plan for 1-2y turnover; 61% free/reduced lunch — lower-income household profile, screen leases tightly.
- Zoned schools: J. L. Jones Elementary School (math 12% / reading 12%, grade F, #568 of 646 statewide, top 89%, 334 students, 53% FRL); Webster Junior High School (math 13% / reading 21%, grade F, #174 of 218 statewide, top 81%, 519 students, 50% FRL); Minden High School (math 27% / reading 27%, grade F, #136 of 265 statewide, top 55%, 807 students, 44% FRL).
- Market conditions: 136 active listings in the ZIP; 36 units permitted in Webster Parish in 2024 (0 in 5+ unit buildings).
Forward outlook
- Local home prices are declining (-3.0%/yr); year-one equity from $794 of loan paydown is wiped out by about $3k of value loss. Plan a longer hold.
- Webster County population projected at -21% by 2050 — secular population decline; favor cash flow + early exit over multi-decade hold.
Negotiation context
- It's been on market 42 days — a 3% lower offer ($111k) is reasonable based on typical stale-listing flexibility.
- Current owner paid $97k; 18% above their basis — modest negotiation headroom, anchor on the comps not their cost.
Risks & watch-outs
- Climate carrying-cost: major wind risk, 68% chance of damaging wind over 30y; extreme-heat days projected 7→21/yr by 2055 (HVAC capex compounding) — expect insurance premiums to compound above CPI over the hold.
Questions for the listing agent
- It's been on market 42 days. Have you received any prior offers? Is the seller open to a 6% concession, seller financing, or rate buy-down credit?
- Built in 1972 — when were the roof, HVAC, electrical panel, plumbing, and water heater last replaced?
- Is there a deadline driving the sale (1031 exchange, divorce, estate, relocation)? That informs how much negotiation room exists.
- Crime grade is F in this area — have there been break-ins, vandalism, or insurance claims at this property in the last 3 years? What carrier currently insures it and at what premium?
- What's the average days-on-market for RENTAL listings here right now (not sales)? A rising rental-DOM trend means longer vacancies and softer asking-rent achievability than the comps imply.
- What's the recent tenant-quality profile in this submarket — average credit score on applications, eviction rate, late-payment / NSF rate, and stable-employment percentage? A property-management company in the area should have these aggregated.
- How much new for-sale + rental construction is in the pipeline within 1–3 miles? Heavy new supply typically softens prices + rents 12–24 months out; constrained supply supports both.
Investment metrics
- 1% rule
- 0.94% ✗
- Cap rate
- 7.43%
- Cash-on-cash
- 4.06%
- DSCR
- 1.18
- GRM
- 8.9
CMA / ARV
- ARV (median comp)
- $147,010
- List price
- $114,900
- Delta
- -21.84%
- Verdict
- UNDERPRICED
- Comps
- 20 within 1.0 mi
Show comp detail 12 sales within ~0.75 mi
| Address | Dist | Beds/Ba | Sqft | Sold | Price | $/sf | Match |
|---|---|---|---|---|---|---|---|
| 200 Germantown Rd | 0.28mi | 2/1.0 | 1,418 (-4%) | 4mo | $150,000 | $106 | 72 |
| 114 Berry Dr | 0.15mi | 3/2.0 (+1) | 1,550 (+4%) | 11mo | $215,000 | $139 | 71 |
| 511 Chandler St | 0.51mi | 3/2.0 (+1) | 1,500 (+1%) | 1mo | $132,500 | $88 | 69 |
| 1101 Park Hwy | 0.31mi | 3/2.0 (+1) | 1,330 (-10%) | 6mo | $110,000 | $83 | 58 |
| 1106 Rathbun St | 0.52mi | 3/2.0 (+1) | 1,515 (+2%) | 13mo | $165,000 | $109 | 56 |
| 1101 Louisiana Ave | 0.66mi | 3/2.0 (+1) | 1,435 (-3%) | 5mo | $250,000 | $174 | 54 |
| 223 Virginia Ave | 0.67mi | 3/2.0 (+1) | 1,500 (+1%) | 11mo | $135,000 | $90 | 53 |
| 400 Summit | 0.55mi | 3/2.5 (+1) | 1,365 (-8%) | 4mo | $239,000 | $175 | 51 |
| 402 E Todd St | 0.52mi | 3/1.0 (+1) | 1,345 (-9%) | 2mo | $160,000 | $119 | 50 |
| 1105 Drew Ln | 0.58mi | 3/1.5 (+1) | 1,350 (-9%) | 4mo | $174,900 | $130 | 48 |
| 311 Summit St | 0.51mi | 2/2.0 | 1,277 (-14%) | 8mo | $165,000 | $129 | 46 |
| 1100 Bonnie Ln | 0.51mi | 3/1.0 (+1) | 1,300 (-12%) | 2mo | $150,000 | $115 | 45 |
Match score weights: distance 35% · size 25% · config 20% · recency 20%. Top-matched comps best support the ARV.
Projected returns pro-forma
-3.0% appreciation · 3.0% rent growth · sell at horizon
- IRR
- -10.0%
- Equity multiple
- 0.64×
- Total profit
- $-11,700
- Equity at exit
- $17,132
- IRR
- -0.6%
- Equity multiple
- 0.96×
- Total profit
- $-1,322
- Equity at exit
- $9,934
Cash invested: $32,172 (down + closing). Projections, not guarantees.
Landlord ↔ Tenant lean methodology
- Overall (STATE)
- 90 Strongly Landlord-Friendly
- State Louisiana
- 90 Strongly Landlord-Friendly · R+12
- County
- — inherits STATE
- City
- — inherits STATE
ZIP-level market 71055
- Active inventory
- 136
- Price-to-rent
- 8.9×
Monthly cashflow live
- Estimated rent
- $1,078 medium interval (Pro) →
- Mortgage (P&I)
- −$603
- Tax from tax record
- −$92 /mo · $1,110/yr
- Insurance
- −$48
- HOA
- −$0
- Lot rent
- −$0
- Vacancy / Maint / Mgmt
- −$226
- Net cashflow
- $109
Break-even live
Sensitivity live
| Price | -10% $174 | -5% $141 | +0% $109 | +5% $76 | +10% $44 |
|---|---|---|---|---|---|
| Rent | -10% $24 | -5% $66 | +0% $109 | +5% $151 | +10% $194 |
| Rate | -1.0pp $167 | -0.5pp $138 | base $109 | +0.5pp $79 | +1.0pp $49 |
UW: 25.0% down · 7.5% · 30yr · 1.5% tax · 5.0% vac · 8.0% maint · 8.0% mgmt
Financing live
Cash to close
- Down payment
- $28,725
- Closing costs
- $3,447
- Reserves months
- —
- Total cash needed
- —
Loan-product check · same deal, 3 products live
Conventional
25% down · 7.5% · 30yr
- Down + closing
- —
- Monthly P&I
- —
- Monthly cashflow
- —
- DSCR
- —
- Eligible?
- —
Personal DTI + credit; lowest rate.
DSCR
20% down · 8.5% · 30yr
- Down + closing
- —
- Monthly P&I
- —
- Monthly cashflow
- —
- DSCR
- —
- Eligible?
- —
No personal income docs; deal must DSCR.
Hard money
10% down · 12.0% · 12mo
- Down + closing
- —
- Monthly P&I
- —
- Monthly cashflow
- —
- DSCR
- —
- Eligible?
- —
Short-term bridge; refi at stabilization.
Listing history 19 events
-
2026-06-23days on market $114,900 Active 42 DOM
-
2026-06-22days on market $114,900 Active 41 DOM
-
2026-06-18days on market $114,900 Active 38 DOM
-
2026-06-17days on market $114,900 Active 37 DOM
-
2026-06-16days on market $114,900 Active 36 DOM
-
2026-06-15days on market $114,900 Active 35 DOM
-
2026-06-14days on market $114,900 Active 33 DOM
-
2026-06-13days on market $114,900 Active 32 DOM
-
2026-06-10days on market $114,900 Active 30 DOM
-
2026-06-09days on market $114,900 Active 29 DOM
-
2026-06-08days on market $114,900 Active 28 DOM
-
2026-06-07days on market $114,900 Active 27 DOM
-
2026-06-02days on market $114,900 Active 22 DOM
-
2026-06-01days on market $114,900 Active 21 DOM
-
2026-05-31days on market $114,900 Active 20 DOM
-
2026-05-30days on market $114,900 Active 19 DOM
-
2026-05-11$120,000 Active 182-char remark
-
2013-02-27soldstatus $97,000
-
2005-10-25soldstatus $72,500
ⓘ Source: listings_history table (triggers on properties + properties_extension) + one-shot
backfill from property_details.listing_events for pre-trigger history.
Tax reassessment forecast LA · Resets to sale price
- Current annual tax
- $1,110 · $92/mo
- Projected year-2 tax
- $1,110 · $92/mo
- Expected delta
- $0/yr ($0/mo · 0.0%)
ⓘ Screening estimate from a state-policy table — verify with the county assessor before closing.
Climate risk First Street
- Flood 1/10 Low FEMA zone X (unshaded) · 0% chance over 30 yrs
- Wildfire 4/10 Moderate
- Heat 7/10 Severe 7 d/yr ≥111°F today · 21 d/yr by 30 yrs out
- Wind 6/10 Major 68% chance of damaging wind over 30 yrs
- Air quality 1/10 Low 0 unhealthy d/yr today · 0 by 30 yrs out
Nearby sold comps map
Loading sold comps map…
Walkable amenities ~0.75 mi
Loading nearby amenities…
Taxation est. · year 1
- Rental income
- $12,938
- − Mortgage interest
- −$6,436
- − Property taxes
- −$1,110
- − Insurance
- −$574
- − Repairs & maintenance
- −$1,035
- − Management
- −$1,035
- − Depreciation
- −$3,343
- Taxable loss
- −$595
- Est. tax savings @ 24.0%
- +$143
- After-tax cash flow
- $1,449/yr
For passive investors: Depreciation is non-cash, so a rental often shows a tax loss while cash-flowing — sheltering income. Rental losses are passive: they offset passive income freely, and up to $25,000/yr can offset ordinary (W-2) income if you actively participate and your MAGI is under $100k (phasing out to $0 by $150k); unused losses carry forward. On sale, claimed depreciation is recaptured at up to 25%, and gains may owe capital-gains tax (a 1031 exchange can defer both). Figures are a year-1 estimate at your 24.0% rate — not tax advice; consult a CPA.
Schools (NCES district)
- District
- Webster Parish
- NCES district ID
- 2201890
- Math proficiency
- 17% ▼ -39.00%
- Reading proficiency
- 26% ▼ -38.00%
- Median HH income
- $33,011
- Composite
- 17.5/100
- National rank
- #9055
- State rank
- #67 of 98 in LA
Livability — Minden
- Score
- 68/100
- State rank
- #92
- US rank
- #9771
Category grades
Schools grade is shown separately in the Schools card above.
Census & demographics
- Census place
- Minden, LA
- Population (ZIP)
- 17,406
Population outlook (Webster County) Hauer SSP2
- Today (2025)
- 37,736 people
- By 2030
- 36,203 · -4.1%
- By 2040
- 32,988 · -12.6%
- By 2050
- 29,743 · -21.2%
- By 2075
- 22,346 · -40.8%
- By 2100
- 15,045 · -60.1%
Race, ethnicity, and origin ACS 2023
- Neighborhood character
- Majority White (56%)
- Race & ethnicity
- White 56% Black 40% Two or more races 3% Hispanic / Latino 2%
- Common ancestry
- Slovak 1% Serbian 1% Lithuanian 1%
- Foreign-born
- 2% · Canada
- Languages at home
- 97% English-only · Spanish 1%
Political lean MEDSL · Webster
- 2024 margin
- Solid R (+36.5) · D 31.2% · R 67.7% · Other 1.1%
- 2008→2024 swing
- -10.2pp toward R · 2008: -26.3pp · 2024: -36.5pp
- All cycles
- 2024: R+36.5 2020: R+31.1 2016: R+29.1 2012: R+25.0 2008: R+26.3
Not yet ingested
- Civics
- —
Market trends
- HPI YoY
- ▼ -89.40%
- Current HPI
- 117.9577
- Rent YoY
- —
- Metro
- —
- State GDP YoY
- ▲ 3.29%
- F500 in state
- 10
Industry mix (Fortune 500 HQ in LA)
| Industry | F500 HQs | Revenue |
|---|---|---|
| Telecommunications | 2 | $23B |
|
||
| Utilities | 1 | $12B |
|
||
| Wholesale / Distribution | 1 | $5B |
|
||
| Advertising | 1 | $2B |
|
||
Price history
+58.5% since first listed4 events — show timeline
- 2026-05-28 Price Changed $114,900 NTREIS
- 2026-05-11 Listed $120,000 NTREIS
- 2013-02-27 Sold (Public Records) $97,000 Public Records
- 2005-10-25 Sold (Public Records) $72,500 Public Records
Property tax history
+2.3%/yrLatest (2025): $1,110 · +1.4% YoY. Source: county tax records.
Cash-flow waterfall
monthlySold comps — $/sqft
last 12 mo · ≤1 miLoading sold comps…