220 Brockway Rd · Utica, NY
Flood risk 1/10 · Minimal
- FEMA flood zone
- X
- Chance of flooding over 30 yrs
- 0.0%
- Est. flood insurance / yr
- $473 – $860
Fire risk 3/10 · Minor
- Est. fire insurance / yr
- $691 – $1,283
Heat risk 1/10 · Minimal
- Hot days now (above 93°F)
- 7 days/yr
- Hot days in 30 yrs
- 15 days/yr
Wind risk 2/10 · Minimal
- Chance of severe wind over 30 yrs
- 1.0%
Air-quality risk 2/10 · Minimal
- Unhealthy air days now
- 0 days/yr
- Unhealthy air days in 30 yrs
- 1 days/yr
Risk factors via First Street. Map © Google.
Why this score? — see what drove the D grade
The composite is a weighted blend of 9 inputs, each scored 0–100. Each bar is that input's sub-score; the figure is the points it added to the 100-point composite (weight × sub-score).
- Appreciation +10.0/10.0
- ARV discount +7.5/15.0
- Cash flow +7.4/30.0
- Livability +4.0/5.0
- Schools +3.3/10.0
- Rent growth +2.5/5.0
- Condition / age +2.5/5.0
- 1% rule +2.1/10.0
- DSCR +1.5/10.0
$282,900
🖨 Deal sheet (PDF) 📄 Offer letter ✓ Due diligence
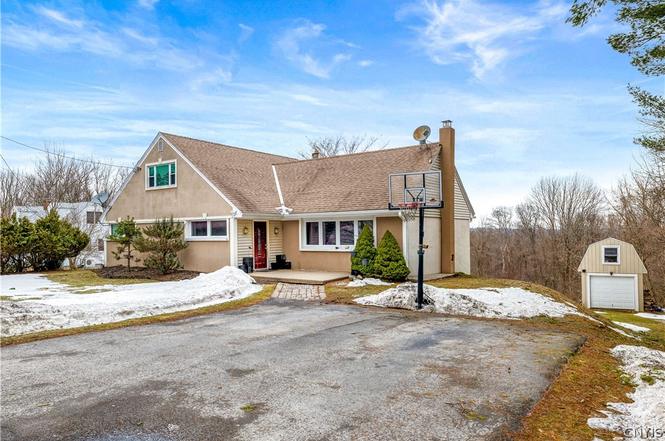
Listing remarks
Welcome to this beautifully updated 4-bedroom, 1.5-bath home that blends modern upgrades with timeless charm. Step inside and immediately notice the gleaming red rosewood hardwood floors and warm, inviting atmosphere throughout. The home features a huge living room that provides the perfect space for relaxing, entertaining, or gathering with family and friends. Elegant six-panel doors, updated lighting, and recessed fixtures add a refined touch to the interior. The kitchen is designed for both style and function, featuring striking 16x16 tile flooring and sleek stainless-steel appliances that make everyday cooking and entertaining a pleasure. A professionally installed wood stove adds both
Key facts
- Recessed fixtures
- 16x16 tile flooring
- Huge living room
Tags
Neighborhood map
What this means for you Summary
Snapshot
- This is a 3-bed/1.0-bath single-family listed at $283k.
Deal economics
- At list price, monthly cash flow is $-369 ($-4k/yr) — negative.
- To cash-flow at today's rent, offer at most $218k (23.0% below list).
- To meet the 1% rule (rent ≥ 1% of price), the offer needs to be $200k (29.2% below list).
- Recommended offer: $200k (29.2% below list) — sets the bar for 1% rule.
- Cap rate 4.7% vs local median 7.7% in Utica — below-typical yield; the buyer is paying a premium for something (appreciation thesis, condition, location) that the cap rate doesn't capture.
Location & tenants
- Location reads 80/100 on livability (#104 in NY, #1,589 nationally) — a professional / high-income tenant draw. Strengths: commute A+, cost of living A+, housing A+; Watch: employment D, schools D-, crime F.
- Frankfort-Schuyler Central School District (town): math 32% / reading 45% proficiency, ranked #538 of 590 in NY (top 91%) — families likely to look elsewhere, expect single-tenant / working-renter base with shorter leases.
- Market conditions: 40 active listings in the ZIP; 54 units permitted in Herkimer County in 2024 (0 in 5+ unit buildings).
Forward outlook
- In year one you build about $30k of equity ($2k loan paydown + $28k appreciation (10.0% local appreciation)).
- Herkimer County population projected at -24% by 2050 — secular population decline; favor cash flow + early exit over multi-decade hold.
- By year 2, paydown + projected appreciation supports a ~$49k cash-out refi (75% LTV) — recoverable capital for the next deal without selling this one.
Negotiation context
- Only 5 days on market — expect competitive offers; lowballing is unlikely to land.
- 7 sale attempts since 11y ago with the ask held roughly flat each time — persistent listings suggest the price (not the market) is what's stuck; bring a comps-based counter.
- Current owner paid $118k; list at $283k implies a 140% gain — meaningful room to come down on a strong offer.
Questions for the listing agent
- What do current leases actually rent for vs. the listed asking? Can we see a recent rent roll and the last 12 months of T-12 income?
- Built in 1962 — when were the roof, HVAC, electrical panel, plumbing, and water heater last replaced?
- Is there a deadline driving the sale (1031 exchange, divorce, estate, relocation)? That informs how much negotiation room exists.
- Schools are D-rated, which usually means shorter tenancies and higher turnover. Who's the typical renter profile here, and what's been the actual vacancy rate?
- Crime grade is F in this area — have there been break-ins, vandalism, or insurance claims at this property in the last 3 years? What carrier currently insures it and at what premium?
- The area grade is low — what's the realistic commute time and amenity access for the typical tenant pool here? Any planned neighborhood developments (good or bad) we should know about?
- What's the average days-on-market for RENTAL listings here right now (not sales)? A rising rental-DOM trend means longer vacancies and softer asking-rent achievability than the comps imply.
- What's the recent tenant-quality profile in this submarket — average credit score on applications, eviction rate, late-payment / NSF rate, and stable-employment percentage? A property-management company in the area should have these aggregated.
- How much new for-sale + rental construction is in the pipeline within 1–3 miles? Heavy new supply typically softens prices + rents 12–24 months out; constrained supply supports both.
Investment metrics
- 1% rule
- 0.71% ✗
- Cap rate
- 4.73%
- Cash-on-cash
- -5.59%
- DSCR
- 0.75
- GRM
- 11.8
CMA / ARV
No comps found within radius.
Projected returns pro-forma
10.0% appreciation · 3.0% rent growth · sell at horizon
- IRR
- 20.3%
- Equity multiple
- 2.65×
- Total profit
- $130,605
- Equity at exit
- $254,859
- IRR
- 18.5%
- Equity multiple
- 6.09×
- Total profit
- $403,145
- Equity at exit
- $549,612
Cash invested: $79,212 (down + closing). Projections, not guarantees.
Landlord ↔ Tenant lean methodology
- Overall (STATE)
- 15 Strongly Tenant-Friendly
- State New York
- 15 Strongly Tenant-Friendly · D+10
- County
- — inherits STATE
- City
- — inherits STATE
ZIP-level market 13340
- Home prices YoY
- 8.1%
- Active inventory
- 40
- Price-to-rent
- 11.8×
Monthly cashflow live
- Estimated rent
- $2,003 medium interval (Pro) →
- Mortgage (P&I)
- −$1,484
- Tax from tax record
- −$350 /mo · $4,199/yr
- Insurance
- −$118
- HOA
- −$0
- Vacancy / Maint / Mgmt
- −$421
- Net cashflow
- $-369
Break-even live
Sensitivity live
| Price | -10% $-209 | -5% $-289 | +0% $-369 | +5% $-449 | +10% $-529 |
|---|---|---|---|---|---|
| Rent | -10% $-527 | -5% $-448 | +0% $-369 | +5% $-290 | +10% $-211 |
| Rate | -1.0pp $-226 | -0.5pp $-297 | base $-369 | +0.5pp $-442 | +1.0pp $-517 |
UW: 25.0% down · 7.5% · 30yr · 1.5% tax · 5.0% vac · 8.0% maint · 8.0% mgmt
Financing live
Cash to close
- Down payment
- $70,725
- Closing costs
- $8,487
- Reserves months
- —
- Total cash needed
- —
Loan-product check · same deal, 3 products live
Conventional
25% down · 7.5% · 30yr
- Down + closing
- —
- Monthly P&I
- —
- Monthly cashflow
- —
- DSCR
- —
- Eligible?
- —
Personal DTI + credit; lowest rate.
DSCR
20% down · 8.5% · 30yr
- Down + closing
- —
- Monthly P&I
- —
- Monthly cashflow
- —
- DSCR
- —
- Eligible?
- —
No personal income docs; deal must DSCR.
Hard money
10% down · 12.0% · 12mo
- Down + closing
- —
- Monthly P&I
- —
- Monthly cashflow
- —
- DSCR
- —
- Eligible?
- —
Short-term bridge; refi at stabilization.
Listing history 16 events
-
2026-03-20status Pending
-
2026-03-14$282,900 Active
-
2023-08-31historical
-
2023-08-17price $224,900
-
2023-07-29price $230,000
-
2023-06-29status Active
-
2023-06-21historical Continue to Show- Under Contract
-
2023-06-02price $235,000
-
2023-05-20$245,000 Active
-
2017-03-13$159,900
-
2016-06-17$153,900
-
2016-06-11historical
-
2016-03-16$169,900
-
2015-10-19historical
-
2015-06-03$179,900
-
2006-09-14soldstatus $118,000
ⓘ Source: listings_history table (triggers on properties + properties_extension) + one-shot
backfill from property_details.listing_events for pre-trigger history.
Tax reassessment forecast NY · Partial reset (capped growth)
- Current annual tax
- $4,199 · $350/mo
- Projected year-2 tax
- $4,490 · $374/mo
- Expected delta
- +$291/yr (+$24/mo · 6.9%)
ⓘ Screening estimate from a state-policy table — verify with the county assessor before closing.
Climate risk First Street
- Flood 1/10 Low FEMA zone X · 0% chance over 30 yrs
- Wildfire 3/10 Moderate
- Heat 1/10 Low 7 d/yr ≥93°F today · 15 d/yr by 30 yrs out
- Wind 2/10 Low 100% chance of damaging wind over 30 yrs
- Air quality 2/10 Low 0 unhealthy d/yr today · 1 by 30 yrs out
Nearby sold comps map
Loading sold comps map…
Walkable amenities ~0.75 mi
Loading nearby amenities…
Taxation est. · year 1
- Rental income
- $24,037
- − Mortgage interest
- −$15,847
- − Property taxes
- −$4,199
- − Insurance
- −$1,414
- − Repairs & maintenance
- −$1,923
- − Management
- −$1,923
- − Depreciation
- −$8,230
- Taxable loss
- −$9,499
- Est. tax savings @ 24.0%
- +$2,280
- After-tax cash flow
- $-2,147/yr
For passive investors: Depreciation is non-cash, so a rental often shows a tax loss while cash-flowing — sheltering income. Rental losses are passive: they offset passive income freely, and up to $25,000/yr can offset ordinary (W-2) income if you actively participate and your MAGI is under $100k (phasing out to $0 by $150k); unused losses carry forward. On sale, claimed depreciation is recaptured at up to 25%, and gains may owe capital-gains tax (a 1031 exchange can defer both). Figures are a year-1 estimate at your 24.0% rate — not tax advice; consult a CPA.
Schools (NCES district)
- District
- Frankfort-Schuyler Central School District
- NCES district ID
- 3611400
- Math proficiency
- 32% ▼ -12.00%
- Reading proficiency
- 45% ▲ 3.00%
- Median HH income
- $46,499
- Composite
- 32.87/100
- National rank
- #5610
- State rank
- #538 of 590 in NY
Livability — Utica
- Score
- 80/100
- State rank
- #104
- US rank
- #1589
Category grades
Schools grade is shown separately in the Schools card above.
Census & demographics
- City population
- 72,968
- Population (ZIP)
- 7,322
Population outlook (Herkimer County) Hauer SSP2
- Today (2025)
- 59,340 people
- By 2030
- 56,838 · -4.2%
- By 2040
- 51,098 · -13.9%
- By 2050
- 45,080 · -24.0%
- By 2075
- 32,648 · -45.0%
- By 2100
- 22,266 · -62.5%
Race, ethnicity, and origin ACS 2023
- Neighborhood character
- Predominantly White (91%)
- Race & ethnicity
- White 91% Two or more races 4% Black 2% Hispanic / Latino 1%
- Common ancestry
- Romanian 7% Lithuanian 3% American 2%
- Foreign-born
- 8% · Canada
- Languages at home
- 90% English-only · Russian/Polish/Slavic 6% Other Indo-European 2% Spanish 1%
Political lean MEDSL · Herkimer
- 2024 margin
- Solid R (+36.4) · D 31.8% · R 68.2%
- 2008→2024 swing
- -27.1pp toward R · 2008: -9.3pp · 2024: -36.4pp
- All cycles
- 2024: R+36.4 2020: R+30.5 2016: R+34.5 2012: R+8.4 2008: R+9.3
Not yet ingested
- Civics
- —
Market trends
- HPI YoY
- ▲ 25.15%
- Current HPI
- 336.077
- Rent YoY
- —
- Metro
- —
- State GDP YoY
- ▲ 2.60%
- F500 in state
- 92
Industry mix (Fortune 500 HQ in NY)
| Industry | F500 HQs | Revenue |
|---|---|---|
| Financial Services | 10 | $950B |
|
||
| Consumer Goods | 9 | $162B |
|
||
| Insurance | 4 | $225B |
|
||
| Telecommunications | 2 | $144B |
|
||
| Pharmaceuticals | 2 | $112B |
|
||
| Media / Entertainment | 2 | $69B |
|
||
Price history
+139.7% since first listed16 events — show timeline
- 2026-03-20 Pending — CNYIS
- 2026-03-14 Listed $282,900 CNYIS
- 2023-08-31 Listing Removed — CNYIS
- 2023-08-17 Price Changed $224,900 CNYIS
- 2023-07-29 Price Changed $230,000 CNYIS
- 2023-06-29 Relisted — CNYIS
- 2023-06-21 Contingent — CNYIS
- 2023-06-02 Price Changed $235,000 CNYIS
- 2023-05-20 Listed $245,000 CNYIS
- 2017-03-13 Listed $159,900 CNYIS
- 2016-06-17 Listed $153,900 CNYIS
- 2016-06-11 Listing Removed — CNYIS
- 2016-03-16 Listed $169,900 CNYIS
- 2015-10-19 Listing Removed — CNYIS
- 2015-06-03 Listed $179,900 CNYIS
- 2006-09-14 Sold (Public Records) $118,000 Public Records
Property tax history
+2.9%/yrLatest (2025): $4,199 · +0.3% YoY. Source: county tax records.
Cash-flow waterfall
monthlySold comps — $/sqft
last 12 mo · ≤1 miLoading sold comps…