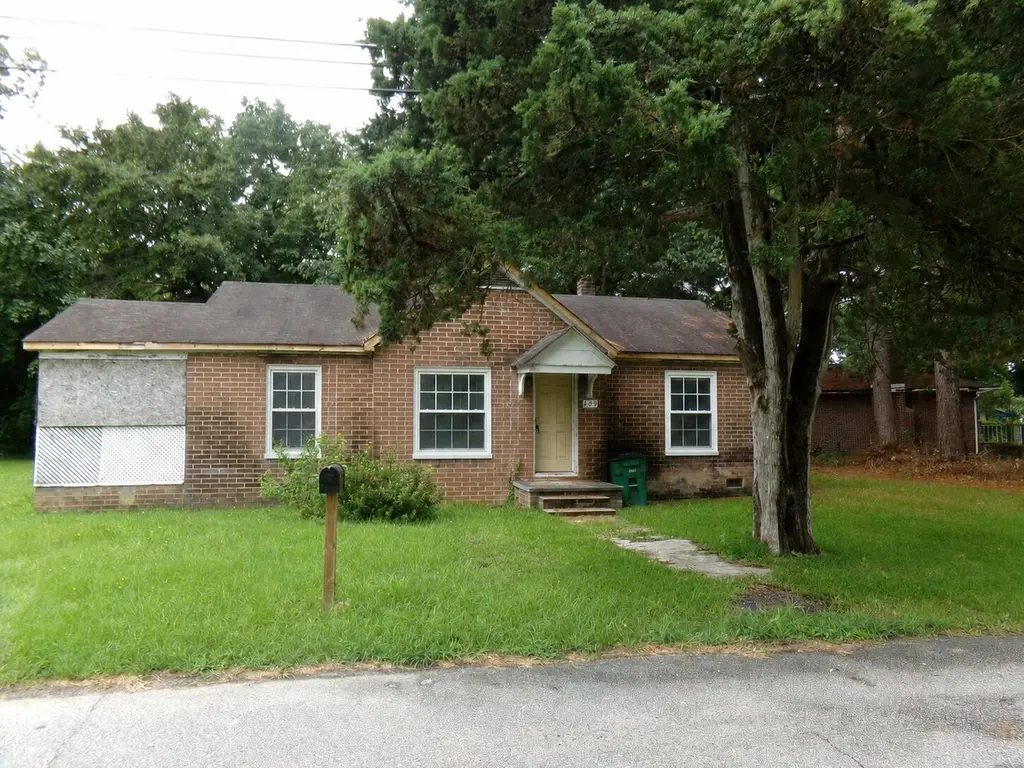
409 Munnerlyn St · Bishopville, SC
Flood risk 1/10 · Minimal
- FEMA flood zone
- X (unshaded)
- Chance of flooding over 30 yrs
- 0.0%
- Est. flood insurance / yr
- $507 – $1,088
Fire risk 4/10 · Minor
- Est. fire insurance / yr
- $783 – $1,453
Heat risk 7/10 · Major
- Hot days now (above 108°F)
- 7 days/yr
- Hot days in 30 yrs
- 16 days/yr
Wind risk 7/10 · Major
- Chance of severe wind over 30 yrs
- 78.0%
Air-quality risk 1/10 · Minimal
- Unhealthy air days now
- 0 days/yr
- Unhealthy air days in 30 yrs
- 0 days/yr
Risk factors via First Street. Map © Google.
Why this score? — see what drove the B grade
The composite is a weighted blend of 9 inputs, each scored 0–100. Each bar is that input's sub-score; the figure is the points it added to the 100-point composite (weight × sub-score).
- Cash flow +30.0/30.0
- 1% rule +10.0/10.0
- DSCR +10.0/10.0
- ARV discount +7.5/15.0
- Appreciation +4.9/10.0
- Livability +2.8/5.0
- Rent growth +2.5/5.0
- Condition / age +2.2/5.0
- Schools +1.3/10.0
$59,000
🖨 Deal sheet (PDF) 📄 Offer letter ✓ Due diligence
Listing remarks
This 3 bed 1 bath home is an investor special. It's perfect for anyone looking for a project. It has new windows, cabinets, appliances, etc. Bring your vision and creativity and make it your own. Sold as is. AI generated image used to portray windows.
Key facts
- New cabinets
- New appliances
- New windows
Tags
Property features AI
Exterior
- Utilities: Public water; Public sewer
- Home design: Single family residence; Residential property
- Construction: Brick and vinyl siding construction; Shingle roof; Crawl space foundation; Built with traditional residential construction
- Exterior features: Side porch; Shingle roof; Brick and vinyl siding
Interior
- Kitchen: Microwave, Oven, Range, Refrigerator
- Flooring: Hardwood; Linoleum
- Bathrooms: 1 full bathroom
- Heating & cooling: No heating; No cooling
- Interior features: Microwave, Oven, Range, Refrigerator; Hardwood and linoleum flooring; Crawl space basement
Neighborhood map
What this means for you Summary
Snapshot
- This is a 3-bed/1.0-bath single-family listed at $59k. Condition is rated fair.
Deal economics
- At list price, monthly cash flow is $385 ($5k/yr) — positive.
- The deal already cash-flows at list — no discount required.
- Meets the 1% rule at list price ($1k rent vs $59k).
- Recommended offer: $58k (1.5% below list) — sets the bar for market timing.
Location & tenants
- Location reads 55/100 on livability (#307 in SC) — a working-class tenant base; expect higher turnover. Strengths: cost of living A+, housing A+; Watch: crime F, amenities F, commute F.
- Lee 01 (rural): math 10% / reading 23% proficiency, ranked #78 of 80 in SC (top 98%) — low school quality limits family demand, transient renter base, plan for 1-2y turnover; 84% free/reduced lunch — lower-income household profile, screen leases tightly.
- Zoned schools: Lee Central Middle (math 2% / reading 17%, grade F, #223 of 229 statewide, top 97%, 358 students, 100% FRL); Lee Central High (math 12% / reading 52%, grade F, #187 of 196 statewide, top 96%, 450 students, 100% FRL) — zoned schools average 100% FRL vs 84% district-wide (16 pts higher); higher-poverty schools than district average — tighter screening recommended.
- Market conditions: 28 active listings in the ZIP; 18 units permitted in Lee County in 2024 (0 in 5+ unit buildings).
Forward outlook
- In year one you build about $302 of equity ($408 loan paydown + $-106 appreciation (-0.2% local appreciation)).
- Lee County population projected at -33% by 2050 — secular population decline; favor cash flow + early exit over multi-decade hold.
- At projected returns (-0.2% appreciation + 3.0% rent growth), your $17k cash investment doubles in ~4 years — after that, you're playing with house money.
Negotiation context
- It's been on market 15 days — a 2% lower offer ($58k) is reasonable based on typical stale-listing flexibility.
Risks & watch-outs
- Watch-outs: built in 1950 — expect roof / HVAC / electrical / plumbing capex.
- Climate carrying-cost: major wind risk, 78% chance of damaging wind over 30y; extreme-heat days projected 7→16/yr by 2055 (HVAC capex compounding) — expect insurance premiums to compound above CPI over the hold.
Questions for the listing agent
- Have any recent inspections been done? Can we get a copy of the seller's disclosures and any deferred-maintenance estimates?
- Built in 1950 — when were the roof, HVAC, electrical panel, plumbing, and water heater last replaced?
- Is there a deadline driving the sale (1031 exchange, divorce, estate, relocation)? That informs how much negotiation room exists.
- Schools are F-rated, which usually means shorter tenancies and higher turnover. Who's the typical renter profile here, and what's been the actual vacancy rate?
- Crime grade is F in this area — have there been break-ins, vandalism, or insurance claims at this property in the last 3 years? What carrier currently insures it and at what premium?
- What's the average days-on-market for RENTAL listings here right now (not sales)? A rising rental-DOM trend means longer vacancies and softer asking-rent achievability than the comps imply.
- What's the recent tenant-quality profile in this submarket — average credit score on applications, eviction rate, late-payment / NSF rate, and stable-employment percentage? A property-management company in the area should have these aggregated.
- How much new for-sale + rental construction is in the pipeline within 1–3 miles? Heavy new supply typically softens prices + rents 12–24 months out; constrained supply supports both.
Investment metrics
- 1% rule
- 1.70% ✓
- Cap rate
- 14.13%
- Cash-on-cash
- 27.98%
- DSCR
- 2.24
- GRM
- 4.9
CMA / ARV
- ARV (on-the-fly)
- $19,108
- Comps found
- 2
Show comp detail 2 sales within ~0.75 mi
| Address | Dist | Beds/Ba | Sqft | Sold | Price | $/sf | Match |
|---|---|---|---|---|---|---|---|
| 506 N Heyward St | 0.13mi | 3/1.0 | 1,178 (+5%) | 1mo | $10,100 | $9 | 85 |
| 316 Munnerlyn St | 0.05mi | 3/1.0 | 960 (-15%) | 4mo | $16,000 | $17 | 70 |
Match score weights: distance 35% · size 25% · config 20% · recency 20%. Top-matched comps best support the ARV.
Projected returns pro-forma
-0.18% appreciation · 3.0% rent growth · sell at horizon
- IRR
- 28.0%
- Equity multiple
- 2.35×
- Total profit
- $22,323
- Equity at exit
- $16,604
- IRR
- 32.0%
- Equity multiple
- 4.53×
- Total profit
- $58,272
- Equity at exit
- $19,542
Cash invested: $16,520 (down + closing). Projections, not guarantees.
Landlord ↔ Tenant lean methodology
- Overall (STATE)
- 90 Strongly Landlord-Friendly
- State South Carolina
- 90 Strongly Landlord-Friendly · R+6
- County
- — inherits STATE
- City
- — inherits STATE
ZIP-level market 29010
- Home prices YoY
- -0.1%
- Active inventory
- 28
- Price-to-rent
- 4.9×
Monthly cashflow live
- Estimated rent
- $1,004 medium interval (Pro) →
- Mortgage (P&I)
- −$309
- Tax est. 1.5%
- −$74 /mo · $885/yr
- Insurance
- −$25
- HOA
- −$0
- Vacancy / Maint / Mgmt
- −$211
- Net cashflow
- $385
Break-even live
Sensitivity live
| Price | -10% $426 | -5% $406 | +0% $385 | +5% $365 | +10% $344 |
|---|---|---|---|---|---|
| Rent | -10% $306 | -5% $346 | +0% $385 | +5% $425 | +10% $464 |
| Rate | -1.0pp $415 | -0.5pp $400 | base $385 | +0.5pp $370 | +1.0pp $354 |
UW: 25.0% down · 7.5% · 30yr · 1.5% tax · 5.0% vac · 8.0% maint · 8.0% mgmt
Financing live
Cash to close
- Down payment
- $14,750
- Closing costs
- $1,770
- Reserves months
- —
- Total cash needed
- —
Loan-product check · same deal, 3 products live
Conventional
25% down · 7.5% · 30yr
- Down + closing
- —
- Monthly P&I
- —
- Monthly cashflow
- —
- DSCR
- —
- Eligible?
- —
Personal DTI + credit; lowest rate.
DSCR
20% down · 8.5% · 30yr
- Down + closing
- —
- Monthly P&I
- —
- Monthly cashflow
- —
- DSCR
- —
- Eligible?
- —
No personal income docs; deal must DSCR.
Hard money
10% down · 12.0% · 12mo
- Down + closing
- —
- Monthly P&I
- —
- Monthly cashflow
- —
- DSCR
- —
- Eligible?
- —
Short-term bridge; refi at stabilization.
Listing history 13 events
-
2026-06-19days on market $59,000 Active 15 DOM
-
2026-06-18days on market $59,000 Active 14 DOM
-
2026-06-17days on market $59,000 Active 13 DOM
-
2026-06-16days on market $59,000 Active 12 DOM
-
2026-06-15days on market $59,000 Active 11 DOM
-
2026-06-14days on market $59,000 Active 9 DOM
-
2026-06-13days on market $59,000 Active 8 DOM
-
2026-06-10days on market $59,000 Active 6 DOM
-
2026-06-09days on market $59,000 Active 5 DOM
-
2026-06-08days on market $59,000 Active 4 DOM
-
2026-06-07days on market $59,000 Active 3 DOM
-
2026-06-05remarks 251-char remark
-
2026-06-05$59,000 Active 1 DOM
ⓘ Source: listings_history table (triggers on properties + properties_extension) + one-shot
backfill from property_details.listing_events for pre-trigger history.
Climate risk First Street
- Flood 1/10 Low FEMA zone X (unshaded) · 0% chance over 30 yrs
- Wildfire 4/10 Moderate
- Heat 7/10 Severe 7 d/yr ≥108°F today · 16 d/yr by 30 yrs out
- Wind 7/10 Severe 78% chance of damaging wind over 30 yrs
- Air quality 1/10 Low 0 unhealthy d/yr today · 0 by 30 yrs out
Nearby sold comps map
Loading sold comps map…
Walkable amenities ~0.75 mi
Loading nearby amenities…
Taxation est. · year 1
- Rental income
- $12,044
- − Mortgage interest
- −$3,305
- − Property taxes
- −$885
- − Insurance
- −$295
- − Repairs & maintenance
- −$964
- − Management
- −$964
- − Depreciation
- −$1,716
- Taxable income
- $3,916
- Est. tax owed @ 24.0%
- −$940
- After-tax cash flow
- $3,682/yr
For passive investors: Depreciation is non-cash, so a rental often shows a tax loss while cash-flowing — sheltering income. Rental losses are passive: they offset passive income freely, and up to $25,000/yr can offset ordinary (W-2) income if you actively participate and your MAGI is under $100k (phasing out to $0 by $150k); unused losses carry forward. On sale, claimed depreciation is recaptured at up to 25%, and gains may owe capital-gains tax (a 1031 exchange can defer both). Figures are a year-1 estimate at your 24.0% rate — not tax advice; consult a CPA.
Condition & rehab AI · 10 photos
This 3-bedroom, 1-bath home requires moderate renovations, including new flooring and painting, to improve its condition and value.
Repairs flagged
- Major kitchen flooring — Exposed subfloor
- Major bath flooring — Exposed subfloor
- Major kitchen walls — Exposed drywall
- Major bath walls — Exposed drywall
Value-add opportunities
- Resale Paint interior walls — Fresh paint enhances curb appeal
- Both Replace kitchen flooring — New flooring improves functionality and aesthetics
- Both Replace bath flooring — New flooring improves functionality and aesthetics
Renovation cost estimate screening
| Repair item | Severity | Est. cost |
|---|---|---|
| kitchen flooring · Exposed subfloor | Major | $15,000–50,000 |
| bath flooring · Exposed subfloor | Major | $15,000–50,000 |
| kitchen walls · Exposed drywall | Major | $15,000–50,000 |
| bath walls · Exposed drywall | Major | $15,000–50,000 |
| Total estimated repair cost · 4 items | $60,000–200,000 |
Value-add ROI direction
- Resale Paint interior walls — Fresh paint enhances curb appeal ↑
- Both Replace kitchen flooring — New flooring improves functionality and aesthetics ↑
- Both Replace bath flooring — New flooring improves functionality and aesthetics ↑
ⓘ Cost ranges are severity-bucket heuristics (US national rule-of-thumb). Get contractor quotes + a written scope before underwriting a rehab budget.
Schools (NCES district)
- District
- Lee 01
- NCES district ID
- 4502670
- Math proficiency
- 10% ▼ -8.00%
- Reading proficiency
- 23% ▼ -1.00%
- Median HH income
- $28,700
- Composite
- 12.93/100
- National rank
- #9583
- State rank
- #78 of 80 in SC
Livability — Bishopville
- Score
- 55/100
- State rank
- #307
- US rank
- #23408
Category grades
Schools grade is shown separately in the Schools card above.
Census & demographics
- Census place
- Bishopville, SC
- Population (ZIP)
- 11,564
Population outlook (Lee County) Hauer SSP2
- Today (2025)
- 15,822 people
- By 2030
- 14,703 · -7.1%
- By 2040
- 12,434 · -21.4%
- By 2050
- 10,603 · -33.0%
- By 2075
- 8,103 · -48.8%
- By 2100
- 6,932 · -56.2%
Race, ethnicity, and origin ACS 2023
- Neighborhood character
- Majority Black (61%)
- Race & ethnicity
- Black 61% White 35% Two or more races 3% Hispanic / Latino 1%
- Common ancestry
- Serbian 2% Slovak 1%
- Foreign-born
- 2% · Canada
- Languages at home
- 96% English-only · Spanish 2%
Political lean MEDSL · Lee
- 2024 margin
- D (+17.7) · D 55.8% · R 38.1% · Other 6.1%
- 2008→2024 swing
- -13.9pp toward R · 2008: 31.5pp · 2024: 17.7pp
- All cycles
- 2024: D+17.7 2020: D+27.5 2016: D+29.4 2012: D+35.3 2008: D+31.5
Not yet ingested
- Civics
- —
Market trends
- HPI YoY
- ▼ -0.18%
- Current HPI
- 120.6432
- Rent YoY
- —
- Metro
- —
- State GDP YoY
- ▲ 4.51%
- F500 in state
- 2
Industry mix (Fortune 500 HQ in SC)
| Industry | F500 HQs | Revenue |
|---|---|---|
| Packaging | 1 | $7B |
|
||
Price history
1 event — show timeline
- 2026-06-04 Listed $59,000 SBOR
Cash-flow waterfall
monthlySold comps — $/sqft
last 12 mo · ≤1 miLoading sold comps…