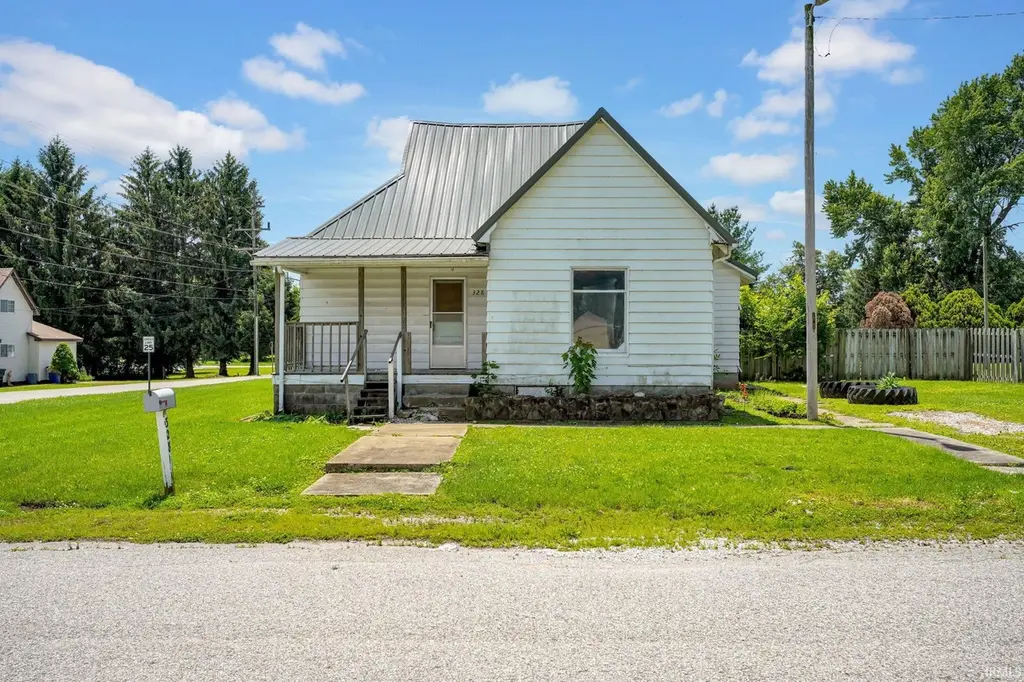
328 Wells Ave · Mitchell, IN
Flood risk 1/10 · Minimal
- FEMA flood zone
- X (unshaded)
- Chance of flooding over 30 yrs
- 0.0%
- Est. flood insurance / yr
- $507 – $1,088
Fire risk 3/10 · Minor
- Est. fire insurance / yr
- $717 – $1,331
Heat risk 4/10 · Minor
- Hot days now (above 104°F)
- 7 days/yr
- Hot days in 30 yrs
- 19 days/yr
Wind risk 2/10 · Minimal
- Chance of severe wind over 30 yrs
- 2.0%
Air-quality risk 2/10 · Minimal
- Unhealthy air days now
- 1 days/yr
- Unhealthy air days in 30 yrs
- 2 days/yr
Risk factors via First Street. Map © Google.
Why this score? — see what drove the C+ grade
The composite is a weighted blend of 9 inputs, each scored 0–100. Each bar is that input's sub-score; the figure is the points it added to the 100-point composite (weight × sub-score).
- Cash flow +20.6/30.0
- ARV discount +13.9/15.0
- DSCR +6.5/10.0
- Appreciation +5.3/10.0
- 1% rule +4.3/10.0
- Livability +3.5/5.0
- Schools +2.7/10.0
- Rent growth +2.5/5.0
- Condition / age +2.5/5.0
$149,000
🖨 Deal sheet 📄 Offer letter ✓ Due diligence
Listing remarks MLS
Near Lehigh and move in ready! New roof in 2019, new heat pumpand new kitchen cabinets all in 2019. All walls were painted in last few years. Nice basement for storage. Nice corner lot and close to Hwy 60. Refrigerator and stove negotiable. There is a concrete pad in back to build a garage on or use for a nice patio area.
Key facts
- Newer roof
- Convenient location
- Corner lot
Tags
Property features AI
Finance
- Other: Residential property listed by Keach & Grove Real Estate, LLC
Exterior
- Parking: Gravel parking
- Utilities: Public water; Public sewer
- Home design: Single-family residence, site-built; One-story
- Construction: Vinyl siding; Block foundation
- Exterior features: Covered porch; Partial wood fencing; Level lot; Lot approximately 100 x 132 (0.3 acres)
Interior
- Kitchen: Refrigerator; Electric range
- Flooring: Hardwood; Carpet; Vinyl
- Bathrooms: One full bathroom on the main level
- Heating & cooling: Natural gas forced-air heating; Central air conditioning
- Interior features: Full unfinished basement; 6 total rooms
- Laundry & utility: Washer hookup on main level; Washer; Dryer; Electric water heater
Neighborhood map
What this means for you Summary
Snapshot
- This is a 3-bed/1.0-bath single-family listed at $149k.
Deal economics
- At list price, monthly cash flow is $198 ($2k/yr) — positive.
- The deal already cash-flows at list — no discount required.
- To meet the 1% rule (rent ≥ 1% of price), the offer needs to be $138k (7.1% below list).
- Recommended offer: $138k (7.1% below list) — sets the bar for 1% rule.
- Cap rate 7.9% vs local median 5.6% in Mitchell — top-decile yield for the area; either an underpriced asset or a hidden risk that comps aren't pricing in. Stress-test before assuming the spread holds.
Location & tenants
- Location reads 69/100 on livability (#187 in IN) — a middle-class / working-renter tenant base. Strengths: cost of living A+, housing A+, crime B; Watch: employment D, amenities F, commute F.
- Mitchell Community Schools (town): math 26% / reading 37% proficiency, ranked #230 of 301 in IN (top 76%) — families likely to look elsewhere, expect single-tenant / working-renter base with shorter leases.
- Zoned schools: Mitchell Jr High School (math 16% / reading 33%, grade F, #251 of 330 statewide, top 77%, 359 students, 61% FRL); Mitchell High School (math 32% / reading 67%, grade D, #123 of 369 statewide, top 36%, 436 students, 51% FRL).
- Market conditions: 61 active listings in the ZIP; 8 units permitted in Lawrence County in 2024 (0 in 5+ unit buildings).
Forward outlook
- In year one you build about $2k of equity ($1k loan paydown + $917 appreciation (0.6% local appreciation)).
- Lawrence County population projected at -14% by 2050 — secular population decline; favor cash flow + early exit over multi-decade hold.
- At projected returns (0.6% appreciation + 3.0% rent growth), your $42k cash investment doubles in ~8 years — after that, you're playing with house money.
Negotiation context
- It's been on market 18 days — a 2% lower offer ($147k) is reasonable based on typical stale-listing flexibility.
- 2 sale attempts since 5y ago with the ask held roughly flat each time — persistent listings suggest the price (not the market) is what's stuck; bring a comps-based counter.
- Current owner paid $99k; list at $149k implies a 51% gain — meaningful room to come down on a strong offer.
Risks & watch-outs
- Watch-outs: built in 1910 — expect roof / HVAC / electrical / plumbing capex.
Questions for the listing agent
- Built in 1910 — when were the roof, HVAC, electrical panel, plumbing, and water heater last replaced?
- Is there a deadline driving the sale (1031 exchange, divorce, estate, relocation)? That informs how much negotiation room exists.
- Schools are D-rated, which usually means shorter tenancies and higher turnover. Who's the typical renter profile here, and what's been the actual vacancy rate?
- What's the average days-on-market for RENTAL listings here right now (not sales)? A rising rental-DOM trend means longer vacancies and softer asking-rent achievability than the comps imply.
- What's the recent tenant-quality profile in this submarket — average credit score on applications, eviction rate, late-payment / NSF rate, and stable-employment percentage? A property-management company in the area should have these aggregated.
- How much new for-sale + rental construction is in the pipeline within 1–3 miles? Heavy new supply typically softens prices + rents 12–24 months out; constrained supply supports both.
Investment metrics
- 1% rule
- 0.93% ✗
- Cap rate
- 7.89%
- Cash-on-cash
- 5.69%
- DSCR
- 1.25
- GRM
- 9.0
CMA / ARV
- ARV (on-the-fly)
- $173,808
- Comps found
- 12
Show comp detail 12 sales within ~0.75 mi
| Address | Dist | Beds/Ba | Sqft | Sold | Price | $/sf | Match |
|---|---|---|---|---|---|---|---|
| 340 S Meridian Rd | 0.08mi | 3/1.5 | 1,228 (+0%) | 21mo | $33,000 | $27 | 76 |
| 503 College Ave | 0.56mi | 3/2.0 | 1,200 (-2%) | 2mo | $220,000 | $183 | 65 |
| 610 W Frank St | 0.61mi | 2/1.5 (-1) | 1,200 (-2%) | 4mo | $174,000 | $145 | 58 |
| 507 College Ave | 0.56mi | 3/2.0 | 1,200 (-2%) | 12mo | $212,000 | $177 | 57 |
| 304 E Vine St | 0.19mi | 2/1.0 (-1) | 1,043 (-15%) | 12mo | $95,000 | $91 | 51 |
| 515 W Vine St | 0.54mi | 3/1.0 | 1,111 (-9%) | 11mo | $80,000 | $72 | 50 |
| 11 South 1st St | 0.36mi | 3/2.0 | 1,380 (+13%) | 10mo | $275,000 | $199 | 50 |
| 120 E Grissom Ave | 0.17mi | 2/1.0 (-1) | 1,060 (-13%) | 18mo | $15,500 | $15 | 50 |
| 105 W Main St | 0.29mi | 2/2.0 (-1) | 1,100 (-10%) | 22mo | $125,000 | $114 | 42 |
| 313 W Warren St | 0.47mi | 2/2.0 (-1) | 1,100 (-10%) | 13mo | $169,000 | $154 | 41 |
| 245 Bartlett Dr | 0.67mi | 3/1.0 | 1,100 (-10%) | 14mo | $156,000 | $142 | 40 |
| 510 S 6th St | 0.62mi | 3/2.0 | 1,318 (+8%) | 18mo | $75,000 | $57 | 39 |
Match score weights: distance 35% · size 25% · config 20% · recency 20%. Top-matched comps best support the ARV.
Projected returns pro-forma
0.62% appreciation · 3.0% rent growth · sell at horizon
- IRR
- 6.1%
- Equity multiple
- 1.30×
- Total profit
- $12,554
- Equity at exit
- $47,909
- IRR
- 10.6%
- Equity multiple
- 2.24×
- Total profit
- $51,531
- Equity at exit
- $61,439
Cash invested: $41,720 (down + closing). Projections, not guarantees.
Landlord ↔ Tenant lean methodology
- Overall (STATE)
- 90 Strongly Landlord-Friendly
- State Indiana
- 90 Strongly Landlord-Friendly · R+11
- County
- — inherits STATE
- City
- — inherits STATE
ZIP-level market 47446
- Home prices YoY
- 0.2%
- Active inventory
- 61
- Price-to-rent
- 9.0×
Monthly cashflow live
- Estimated rent
- $1,385 medium interval (Pro) →
- Mortgage (P&I)
- −$781
- Tax from tax record
- −$52 /mo · $630/yr
- Insurance
- −$62
- HOA
- −$0
- Vacancy / Maint / Mgmt
- −$291
- Net cashflow
- $198
Break-even live
UW: 25.0% down · 7.5% · 30yr · 1.5% tax · 5.0% vac · 8.0% maint · 8.0% mgmt
Financing live
Cash to close
- Down payment
- $37,250
- Closing costs
- $4,470
- Reserves months
- —
- Total cash needed
- —
Loan-product check · same deal, 3 products live
Conventional
25% down · 7.5% · 30yr
- Down + closing
- —
- Monthly P&I
- —
- Monthly cashflow
- —
- DSCR
- —
- Eligible?
- —
Personal DTI + credit; lowest rate.
DSCR
20% down · 8.5% · 30yr
- Down + closing
- —
- Monthly P&I
- —
- Monthly cashflow
- —
- DSCR
- —
- Eligible?
- —
No personal income docs; deal must DSCR.
Hard money
10% down · 12.0% · 12mo
- Down + closing
- —
- Monthly P&I
- —
- Monthly cashflow
- —
- DSCR
- —
- Eligible?
- —
Short-term bridge; refi at stabilization.
Listing history 15 events
-
2026-06-18days on market $149,000 Active 18 DOM
-
2026-06-17days on market $149,000 Active 17 DOM
-
2026-06-16days on market $149,000 Active 16 DOM
-
2026-06-15days on market $149,000 Active 15 DOM
-
2026-06-14days on market $149,000 Active 13 DOM
-
2026-06-12pricedays on market $149,000 Active 12 DOM
-
2026-06-09days on market $155,000 Active 9 DOM
-
2026-06-08days on market $155,000 Active 8 DOM
-
2026-06-07days on market $155,000 Active 7 DOM
-
2026-06-05days on market $155,000 Active 5 DOM
-
2026-06-03days on market $155,000 Active 3 DOM
-
2026-06-02days on market $155,000 Active 2 DOM
-
2026-05-31$155,000 Active 1 DOM
-
2026-05-30remarks 520-char remark
-
2026-05-30$155,000 Active 1 DOM
ⓘ Source: listings_history table (triggers on properties + properties_extension) + one-shot
backfill from property_details.listing_events for pre-trigger history.
Tax reassessment forecast IN · Partial reset (capped growth)
- Current annual tax
- $630 · $52/mo
- Projected year-2 tax
- $948 · $79/mo
- Expected delta
- +$318/yr (+$27/mo · 50.5%)
ⓘ Screening estimate from a state-policy table — verify with the county assessor before closing.
Climate risk First Street
- Flood 1/10 Low FEMA zone X (unshaded) · 0% chance over 30 yrs
- Wildfire 3/10 Moderate
- Heat 4/10 Moderate 7 d/yr ≥104°F today · 19 d/yr by 30 yrs out
- Wind 2/10 Low 2% chance of damaging wind over 30 yrs
- Air quality 2/10 Low 1 unhealthy d/yr today · 2 by 30 yrs out
Nearby sold comps map
Loading sold comps map…
Walkable amenities ~0.75 mi
Loading nearby amenities…
Taxation est. · year 1
- Rental income
- $16,617
- − Mortgage interest
- −$8,346
- − Property taxes
- −$630
- − Insurance
- −$745
- − Repairs & maintenance
- −$1,329
- − Management
- −$1,329
- − Depreciation
- −$4,335
- Taxable loss
- −$98
- Est. tax savings @ 24.0%
- +$24
- After-tax cash flow
- $2,399/yr
For passive investors: Depreciation is non-cash, so a rental often shows a tax loss while cash-flowing — sheltering income. Rental losses are passive: they offset passive income freely, and up to $25,000/yr can offset ordinary (W-2) income if you actively participate and your MAGI is under $100k (phasing out to $0 by $150k); unused losses carry forward. On sale, claimed depreciation is recaptured at up to 25%, and gains may owe capital-gains tax (a 1031 exchange can defer both). Figures are a year-1 estimate at your 24.0% rate — not tax advice; consult a CPA.
Schools (NCES district)
- District
- Mitchell Community Schools
- NCES district ID
- 1806900
- Math proficiency
- 26% ▼ -16.00%
- Reading proficiency
- 37% ▼ -10.00%
- Median HH income
- $43,994
- Composite
- 26.83/100
- National rank
- #7113
- State rank
- #230 of 301 in IN
Livability — Mitchell
- Score
- 69/100
- State rank
- #187
- US rank
- #8606
Category grades
Schools grade is shown separately in the Schools card above.
Census & demographics
- Census place
- Mitchell, IN
- Population (ZIP)
- 9,259
Population outlook (Lawrence County) Hauer SSP2
- Today (2025)
- 44,347 people
- By 2030
- 43,331 · -2.3%
- By 2040
- 40,887 · -7.8%
- By 2050
- 38,297 · -13.6%
- By 2075
- 32,479 · -26.8%
- By 2100
- 26,051 · -41.3%
Race, ethnicity, and origin ACS 2023
- Neighborhood character
- Predominantly White (93%)
- Race & ethnicity
- White 93% Two or more races 4% Asian 2% Hispanic / Latino 1%
- Common ancestry
- Italian 3% Slovak 2% Serbian 1%
- Foreign-born
- 3% · Canada
- Languages at home
- 96% English-only · Other Indo-European 2% Spanish 1%
Political lean MEDSL · Lawrence
- 2024 margin
- Solid R (+51.0) · D 23.6% · R 74.6% · Other 1.7%
- 2008→2024 swing
- -30.5pp toward R · 2008: -20.6pp · 2024: -51.0pp
- All cycles
- 2024: R+51.0 2020: R+50.6 2016: R+51.5 2012: R+32.8 2008: R+20.6
Not yet ingested
- Civics
- —
Market trends
- HPI YoY
- ▲ 0.62%
- Current HPI
- 248.9604
- Rent YoY
- —
- Metro
- —
- State GDP YoY
- ▲ 2.90%
- F500 in state
- 18
Industry mix (Fortune 500 HQ in IN)
| Industry | F500 HQs | Revenue |
|---|---|---|
| Industrial Machinery | 2 | $37B |
|
||
| Healthcare | 1 | $177B |
|
||
| Pharmaceuticals | 1 | $45B |
|
||
| Metals / Steel | 1 | $18B |
|
||
| Agriculture | 1 | $17B |
|
||
| Packaging | 1 | $12B |
|
||
Price history
+56.7% since first listed3 events — show timeline
- 2026-05-30 Listed $155,000 IRMLS
- 2021-10-29 Sold (MLS) $98,900 IRMLS
- 2021-08-18 Listed $98,900 IRMLS
Property tax history
-11.0%/yrLatest (2025): $630 · -12.7% YoY. Source: county tax records.
Cash-flow waterfall
monthlySold comps — $/sqft
last 12 mo · ≤1 miLoading sold comps…