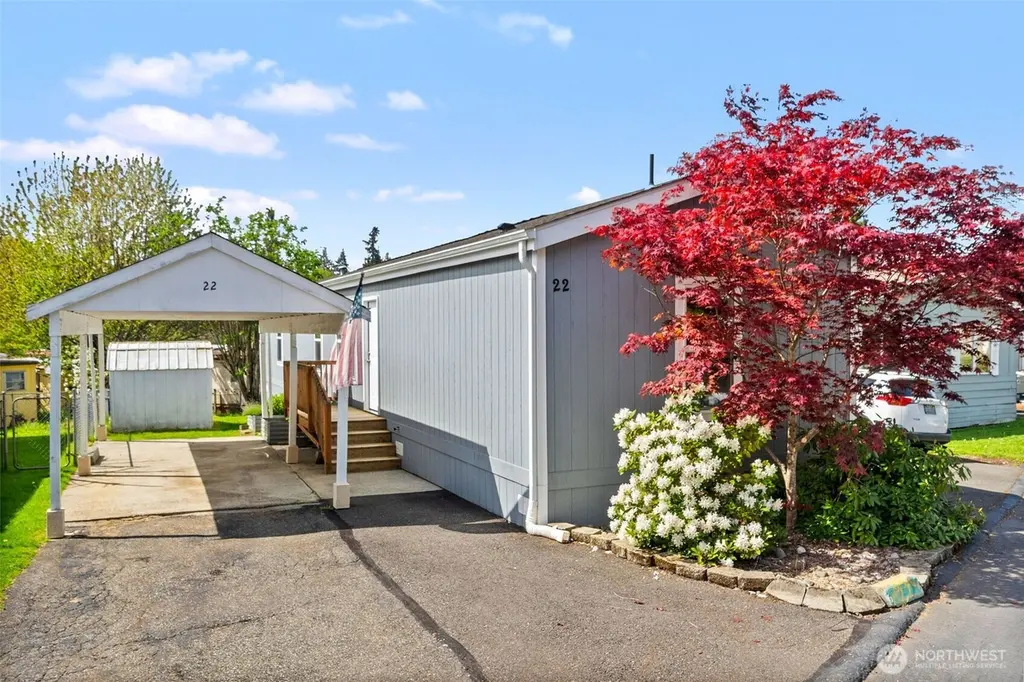
3928 21st Ave SE #22 · Lacey, WA
Flood risk 1/10 · Minimal
- FEMA flood zone
- X (unshaded)
- Chance of flooding over 30 yrs
- 0.0%
- Est. flood insurance / yr
- $507 – $1,088
Fire risk 1/10 · Minimal
- Est. fire insurance / yr
- $604 – $1,122
Heat risk 3/10 · Minor
- Hot days now (above 88°F)
- 7 days/yr
- Hot days in 30 yrs
- 14 days/yr
Wind risk 1/10 · Minimal
- Chance of severe wind over 30 yrs
- —
Air-quality risk 6/10 · Moderate
- Unhealthy air days now
- 7 days/yr
- Unhealthy air days in 30 yrs
- 8 days/yr
Risk factors via First Street. Map © Google.
Why this score? — see what drove the A- grade
The composite is a weighted blend of 9 inputs, each scored 0–100. Each bar is that input's sub-score; the figure is the points it added to the 100-point composite (weight × sub-score).
- Cash flow +30.0/30.0
- ARV discount +15.0/15.0
- 1% rule +10.0/10.0
- DSCR +10.0/10.0
- Schools +5.1/10.0
- Livability +4.2/5.0
- Rent growth +3.4/5.0
- Condition / age +2.5/5.0
- Appreciation +0.0/10.0
$115,000
🖨 Deal sheet 📄 Offer letter ✓ Due diligence
Listing remarks
Welcome to Edge Lake! Step inside to a 2018 Karsten Dream Series 3-bedroom, 1.75-bathroom home in an all-ages community on Chambers Lake! This newer home features an open-concept layout which nicely connects the kitchen space with the living room ideal for guests and entertaining. The primary suite features a large space, attached bathroom, and walk-in closet. Two additional bedrooms offer flexibility for guests, hobbies, or a home office, complemented by a full bathroom for added comfort and convenience. Enjoy year-round comfort on the a newer Ductless AC Unit, plus a partially fenced yard with shed and improved parking with carport and extra wide driveway. All appliances stay! Community
Key facts
- Ductless ac unit
- Open-concept layout
- 3 parking spots
Tags
Property features AI
Finance
- Other: Buyer brokerage compensation: 3%; Cumulative days on market: 12; Calculated living area: 990 (per building plans)
- Financial info: Listing terms: Cash or Conventional
- HOA & community: Land-lease community (park approved for sale); Park name: Edgelake LLC; Approximately 50 homes in the park; Pets allowed — see remarks; Land lease amount: $825
Exterior
- Parking: Carport; Uncovered parking
- Utilities: Electric energy; Community water (Edgelake); Sewer service (Edgelake); Power company: PSE; Electric water heater located in mud room; Internet: Comcast
- Home design: Manufactured single-wide home (Clayton Dream-661N); Residential manufactured home in good condition; One story; Southeast facing; Mobile home remains
- Construction: Wood construction; Composition roof; Tie-down foundation; Manufactured after 6/15/1976
- Exterior features: Wood products exterior; Paved lot; On waterfront — lake; Community amenities: BBQs, clubhouse, common area, community waterfront, high-speed internet available, trails
Interior
- Kitchen: Dishwasher; Microwave; Refrigerator; Stove/Range
- Bedrooms: 3 bedrooms
- Flooring: Laminate; Vinyl; Carpet
- Bathrooms: 1 full bath; 1 three-quarter bath; 1 bathtub; 2 showers
- Heating & cooling: Heat pump (heating and cooling); Forced air; Ductless heating
- Interior features: Water heater; Kitchen with eating space; Living room; Utility room; Bath off primary; Drapes; Patio/porch/deck; Walk-in closet; Double pane windows
- Laundry & utility: Washer; Dryer; Utility room
Neighborhood map
What this means for you Summary
Snapshot
- This is a 3-bed/2.0-bath manufactured listed at $115k.
Deal economics
- At list price, monthly cash flow is $844 ($10k/yr) — positive.
- The deal already cash-flows at list — no discount required.
- Meets the 1% rule at list price ($2k rent vs $115k).
- Recommended offer: $112k (3.0% below list) — sets the bar for market timing.
- Cap rate 15.1% vs local median 3.0% in Lacey — top-decile yield for the area; either an underpriced asset or a hidden risk that comps aren't pricing in. Stress-test before assuming the spread holds.
Location & tenants
- Location reads 85/100 on livability (#33 in WA, #581 nationally) — a professional / high-income tenant draw. Strengths: amenities A+, commute A+, housing A+; Watch: cost of living D+.
- North Thurston Public Schools (suburban): math 51% / reading 62% proficiency, ranked #80 of 291 in WA (top 28%) — acceptable for families but not a draw, mixed tenant base, ~2y average lease.
- Market conditions: Rents rising (+3.6%/yr); 190 active listings in the ZIP; 19 comparable units currently listed for rent nearby; rentals at typical pace (median 21d on market — plan ~3-4 weeks tenant-placement turnaround); solid renter incomes; 1,222 units permitted in Thurston County in 2024 (508 in 5+ unit buildings).
Forward outlook
- Local home prices are declining (-3.0%/yr); year-one equity from $795 of loan paydown is wiped out by about $3k of value loss. Plan a longer hold.
- Thurston County population projected at +27% by 2050 — long-run rental-demand tailwind backs the buy-and-hold thesis.
- At projected returns (-3.0% appreciation + 3.6% rent growth), your $32k cash investment doubles in ~4 years — after that, you're playing with house money.
Negotiation context
- It's been on market 48 days — a 3% lower offer ($112k) is reasonable based on typical stale-listing flexibility.
- 2 sale attempts since 14y ago; this cycle's ask has dropped $10k (8%) from the opening price — seller is motivated, your offer sets the floor, not the list.
- Current owner paid $35k; list at $115k implies a 229% gain — meaningful room to come down on a strong offer.
Questions for the listing agent
- It's been on market 48 days. Have you received any prior offers? Is the seller open to a 3% concession, seller financing, or rate buy-down credit?
- Is there a deadline driving the sale (1031 exchange, divorce, estate, relocation)? That informs how much negotiation room exists.
- Schools are B-rated — typically a magnet for longer-tenancy family renters. What's the average tenant stay here, and is there a school-zone premium baked into asking?
- What's the average days-on-market for RENTAL listings here right now (not sales)? A rising rental-DOM trend means longer vacancies and softer asking-rent achievability than the comps imply.
- What's the recent tenant-quality profile in this submarket — average credit score on applications, eviction rate, late-payment / NSF rate, and stable-employment percentage? A property-management company in the area should have these aggregated.
- How much new for-sale + rental construction is in the pipeline within 1–3 miles? Heavy new supply typically softens prices + rents 12–24 months out; constrained supply supports both.
Investment metrics
- 1% rule
- 1.77% ✓
- Cap rate
- 15.10%
- Cash-on-cash
- 31.47%
- DSCR
- 2.40
- GRM
- 4.7
CMA / ARV
- ARV (median comp)
- $160,000
- List price
- $115,000
- Delta
- -28.12%
- Verdict
- UNDERPRICED
- Comps
- 5 within 2.0 mi
Show comp detail 4 sales within ~0.75 mi
| Address | Dist | Beds/Ba | Sqft | Sold | Price | $/sf | Match |
|---|---|---|---|---|---|---|---|
| 3928 21st Ave SE #66 | 0.04mi | 2/1.0 (-1) | 840 (0%) | 16mo | $74,000 | $88 | 76 |
| 3928 21st Ave SE #75 | 0.10mi | 3/2.0 | 924 (+10%) | 16mo | $48,000 | $52 | 65 |
| 1617 SE Fones Rd | 0.62mi | 2/1.0 (-1) | 784 (-7%) | 14mo | $53,000 | $68 | 39 |
| 1617 Fones Rd SE #78 | 0.69mi | 2/1.0 (-1) | 728 (-13%) | 14mo | $40,000 | $55 | 25 |
Match score weights: distance 35% · size 25% · config 20% · recency 20%. Top-matched comps best support the ARV.
Projected returns pro-forma
-3.0% appreciation · 3.56% rent growth · sell at horizon
- IRR
- 27.0%
- Equity multiple
- 2.13×
- Total profit
- $36,317
- Equity at exit
- $17,147
- IRR
- 34.9%
- Equity multiple
- 4.28×
- Total profit
- $105,727
- Equity at exit
- $9,943
Cash invested: $32,200 (down + closing). Projections, not guarantees.
Landlord ↔ Tenant lean methodology
- Overall (STATE)
- 28 Tenant-Leaning
- State Washington
- 28 Tenant-Leaning · D+8
- County
- — inherits STATE
- City
- — inherits STATE
ZIP-level market 98503
- Rents YoY
- 3.6%
- Active inventory
- 190
- Price-to-rent
- 4.7×
Monthly cashflow live
- Estimated rent
- $2,038 high interval (Pro) →
- Mortgage (P&I)
- −$603
- Tax from tax record
- −$115 /mo · $1,378/yr
- Insurance
- −$48
- HOA
- −$0
- Vacancy / Maint / Mgmt
- −$428
- Net cashflow
- $844
Break-even live
UW: 25.0% down · 7.5% · 30yr · 1.5% tax · 5.0% vac · 8.0% maint · 8.0% mgmt
Financing live
Cash to close
- Down payment
- $28,750
- Closing costs
- $3,450
- Reserves months
- —
- Total cash needed
- —
Loan-product check · same deal, 3 products live
Conventional
25% down · 7.5% · 30yr
- Down + closing
- —
- Monthly P&I
- —
- Monthly cashflow
- —
- DSCR
- —
- Eligible?
- —
Personal DTI + credit; lowest rate.
DSCR
20% down · 8.5% · 30yr
- Down + closing
- —
- Monthly P&I
- —
- Monthly cashflow
- —
- DSCR
- —
- Eligible?
- —
No personal income docs; deal must DSCR.
Hard money
10% down · 12.0% · 12mo
- Down + closing
- —
- Monthly P&I
- —
- Monthly cashflow
- —
- DSCR
- —
- Eligible?
- —
Short-term bridge; refi at stabilization.
Rent comps 19 comps
| Address | Beds | Baths | Sqft | Rent | $/sqft | DOM | Units | Dist |
|---|---|---|---|---|---|---|---|---|
| 1400 Fones Rd SE Olympia, WA | 1.0–2.0 | 1.0–2.0 | 813 | $1,900 | $2.34 | 13d | 6 | 0.43mi |
| 1617 Elizabeth St SE Olympia, WA | 3.0 | 2.0 | 1014 | $2,350 | $2.32 | 13d | 1 | 0.43mi |
| 1219 East St SE Apt 3 Lacey, WA | 2.0 | 1.0 | 850 | $1,615 | $1.90 | 43d | 1 | 0.44mi |
| 4314 14th Way SE Lacey, WA | 2.0 | 1.0 | 938 | $2,500 | $2.67 | 43d | 1 | 0.47mi |
| 1420 Fones Rd SE Olympia, WA | 2.0 | 2.0 | 1040 | $2,062 | $1.98 | 13d | 2 | 0.52mi |
| 1245 Willow St SE Lacey, WA | 2.0 | 1.0 | 676 | $1,695 | $2.51 | 21d | 1 | 0.53mi |
| 3806 12th Ave SE Lacey, WA | 1.0–2.0 | 1.0 | 800 | $1,775 | $2.22 | 13d | 3 | 0.60mi |
| 1224 Willow St SE Lacey, WA | 2.0 | 1.0 | 1000 | $2,000 | $2.00 | 21d | 1 | 0.60mi |
| 1212 Willow St SE Unit 1212-I Olympia, WA | 2.0 | 1.0 | 871 | $1,595 | $1.83 | 21d | 1 | 0.63mi |
| 4410 6th Ave SE Lacey, WA | 1.0–3.0 | 1.0–2.0 | 980 | $2,425 | $2.47 | 13d | 14 | 1.08mi |
| 3307 College St SE Lacey, WA | 2.0 | 1.0 | 865 | $1,700 | $1.97 | 13d | 3 | 1.09mi |
| 3301 College St SE Lacey, WA | 2.0 | 2.0 | 900 | $1,845 | $2.05 | 21d | 1 | 1.10mi |
| 510 Lilly Rd SE Olympia, WA | 1.0–2.0 | 1.0 | 525 | $1,525 | $2.90 | 43d | 2 | 1.15mi |
| 1012 Burr Rd SE Olympia, WA | 2.0–4.0 | 2.0 | 1024 | $1,786 | $1.74 | 13d | 4 | 1.25mi |
| 122 Lilly Rd NE Unit 507 Olympia, WA | 3.0 | 1.0 | 800 | $1,900 | $2.38 | 21d | 1 | 1.28mi |
| 122 Lilly Rd NE Unit 104 Olympia, WA | 2.0 | 1.0 | 750 | $1,700 | $2.27 | 21d | 1 | 1.28mi |
| 2700 Ruddell Rd SE Unit 2740-B Lacey, WA | 2.0 | 1.5 | 1054 | $1,695 | $1.61 | 43d | 1 | 1.40mi |
| 1405 Clearbrook Dr SE Lacey, WA | 1.0–2.0 | 1.0–2.0 | 737 | $1,976 | $2.68 | 43d | 3 | 1.40mi |
| 3724 Ensign Rd NE Olympia, WA | 2.0 | 1.0–2.0 | 920 | $1,849 | $2.01 | 13d | 5 | 1.42mi |
Listing history 19 events
-
2026-06-18days on market $115,000 Active 48 DOM
-
2026-06-17days on market $115,000 Active 47 DOM
-
2026-06-16days on market $115,000 Active 46 DOM
-
2026-06-15days on market $115,000 Active 45 DOM
-
2026-06-14days on market $115,000 Active 43 DOM
-
2026-06-13days on market $115,000 Active 42 DOM
-
2026-06-10days on market $115,000 Active 40 DOM
-
2026-06-09days on market $115,000 Active 39 DOM
-
2026-06-08days on market $115,000 Active 38 DOM
-
2026-06-07days on market $115,000 Active 37 DOM
-
2026-06-03days on market $115,000 Active 33 DOM
-
2026-06-02pricedays on market $115,000 Active 32 DOM
-
2026-06-01days on market $125,000 Active 31 DOM
-
2026-05-31days on market $125,000 Active 30 DOM
-
2026-05-30days on market $125,000 Active 29 DOM
-
2026-05-01$125,000 Active
-
2012-12-21soldstatus $35,000 Sold
-
2012-12-07status Pending Feasibility
-
2012-10-25$39,900 Active
ⓘ Source: listings_history table (triggers on properties + properties_extension) + one-shot
backfill from property_details.listing_events for pre-trigger history.
Tax reassessment forecast WA · Resets to sale price
- Current annual tax
- $1,378 · $115/mo
- Projected year-2 tax
- $1,378 · $115/mo
- Expected delta
- $0/yr ($0/mo · 0.0%)
ⓘ Screening estimate from a state-policy table — verify with the county assessor before closing.
Climate risk First Street
- Flood 1/10 Low FEMA zone X (unshaded) · 0% chance over 30 yrs
- Wildfire 1/10 Low
- Heat 3/10 Moderate 7 d/yr ≥88°F today · 14 d/yr by 30 yrs out
- Wind 1/10 Low
- Air quality 6/10 Major 7 unhealthy d/yr today · 8 by 30 yrs out
Nearby sold comps map
Loading sold comps map…
Walkable amenities ~0.75 mi
Loading nearby amenities…
Taxation est. · year 1
- Rental income
- $24,460
- − Mortgage interest
- −$6,442
- − Property taxes
- −$1,378
- − Insurance
- −$575
- − Repairs & maintenance
- −$1,957
- − Management
- −$1,957
- − Depreciation
- −$3,345
- Taxable income
- $8,806
- Est. tax owed @ 24.0%
- −$2,113
- After-tax cash flow
- $8,020/yr
For passive investors: Depreciation is non-cash, so a rental often shows a tax loss while cash-flowing — sheltering income. Rental losses are passive: they offset passive income freely, and up to $25,000/yr can offset ordinary (W-2) income if you actively participate and your MAGI is under $100k (phasing out to $0 by $150k); unused losses carry forward. On sale, claimed depreciation is recaptured at up to 25%, and gains may owe capital-gains tax (a 1031 exchange can defer both). Figures are a year-1 estimate at your 24.0% rate — not tax advice; consult a CPA.
Schools (NCES district)
- District
- North Thurston Public Schools
- NCES district ID
- 5305850
- Math proficiency
- 51% ▬ 0.00%
- Reading proficiency
- 62% ▬ 0.00%
- Median HH income
- $62,338
- Composite
- 51.09/100
- National rank
- #3798
- State rank
- #80 of 291 in WA
Livability — Lacey
- Score
- 85/100
- State rank
- #33
- US rank
- #581
Category grades
Schools grade is shown separately in the Schools card above.
Census & demographics
- Census place
- Lacey, WA
- County
- Thurston County · 269,345 people
- City population
- 108,850
- Metro
- Olympia-Lacey-Tumwater, WA
- Population (ZIP)
- 41,656
- Household income
- $89,002
- Rent vs Own
- Severe rent burden
- 2195.0
Population outlook (Thurston County) Hauer SSP2
- Today (2025)
- 308,239 people
- By 2030
- 326,483 · +5.9%
- By 2040
- 359,890 · +16.8%
- By 2050
- 391,800 · +27.1%
- By 2075
- 468,024 · +51.8%
- By 2100
- 519,890 · +68.7%
Race, ethnicity, and origin ACS 2023
- Neighborhood character
- Diverse neighborhood (Simpson 0.56)
- Race & ethnicity
- White 65% Two or more races 12% Hispanic / Latino 12% Asian 7% Black 5% Pacific Islander 2% Native American 1%
- Hispanic origin (detail)
- Mexican 8% Puerto Rican 1%
- Common ancestry
- Portuguese 4% Slovak 3% Lithuanian 3%
- Foreign-born
- 10% · Canada, Vietnam, South Korea
- Languages at home
- 82% English-only · Spanish 6% German/W. Germanic 3% Other Asian/Pacific 2%
Political lean MEDSL · Thurston
- 2024 margin
- Strong D (+20.4) · D 58.5% · R 38.1% · Other 3.5%
- 2008→2024 swing
- -1.3pp toward R · 2008: 21.7pp · 2024: 20.4pp
- All cycles
- 2024: D+20.4 2020: D+18.6 2016: D+15.4 2012: D+19.0 2008: D+21.7
Not yet ingested
- Civics
- —
Market trends
- HPI YoY
- ▼ -385.93%
- Current HPI
- 361.0974
- Rent YoY
- ▲ 3.56%
- Metro
- Olympia-Lacey-Tumwater, WA
- State GDP YoY
- ▲ 4.65%
- F500 in state
- 22
Industry mix (Fortune 500 HQ in WA)
| Industry | F500 HQs | Revenue |
|---|---|---|
| Retail | 2 | $269B |
|
||
| Technology / Retail | 1 | $638B |
|
||
| Technology | 1 | $245B |
|
||
| Telecommunications | 1 | $38B |
|
||
| Food / Beverage | 1 | $36B |
|
||
| Automotive / Trucks | 1 | $34B |
|
||
Price history
+188.2% since first listed5 events — show timeline
- 2026-06-01 Price Changed $115,000 NWMLS as Distributed by MLS Grid
- 2026-05-01 Listed $125,000 NWMLS as Distributed by MLS Grid
- 2012-12-21 Sold (MLS) $35,000 NWMLS as Distributed by MLS Grid
- 2012-12-07 Pending — NWMLS as Distributed by MLS Grid
- 2012-10-25 Listed $39,900 NWMLS as Distributed by MLS Grid
Property tax history
+23.7%/yrLatest (2026): $1,378 · +33.8% YoY. Source: county tax records.
Cash-flow waterfall
monthlySold comps — $/sqft
last 12 mo · ≤1 miLoading sold comps…