1833 SW Canal Blvd · Redmond, OR
Flood risk 1/10 · Minimal
- FEMA flood zone
- X (unshaded)
- Chance of flooding over 30 yrs
- 0.0%
- Est. flood insurance / yr
- $507 – $1,088
Fire risk 5/10 · Moderate
- Est. fire insurance / yr
- $498 – $926
Heat risk 3/10 · Minor
- Hot days now (above 92°F)
- 7 days/yr
- Hot days in 30 yrs
- 16 days/yr
Wind risk 1/10 · Minimal
- Chance of severe wind over 30 yrs
- —
Air-quality risk 10/10 · Severe
- Unhealthy air days now
- 22 days/yr
- Unhealthy air days in 30 yrs
- 25 days/yr
Risk factors via First Street. Map © Google.
Why this score? — see what drove the B grade
The composite is a weighted blend of 9 inputs, each scored 0–100. Each bar is that input's sub-score; the figure is the points it added to the 100-point composite (weight × sub-score).
- Cash flow +30.0/30.0
- 1% rule +10.0/10.0
- DSCR +10.0/10.0
- ARV discount +7.5/15.0
- Livability +3.9/5.0
- Rent growth +3.3/5.0
- Schools +2.9/10.0
- Condition / age +2.5/5.0
- Appreciation +0.0/10.0
$65,000
🖨 Deal sheet 📄 Offer letter ✓ Due diligence
Listing remarks MLS
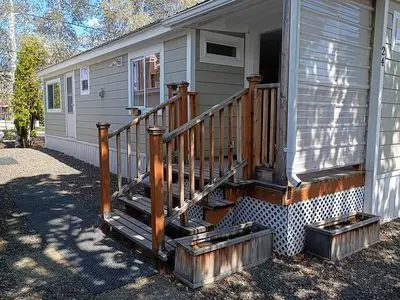
Charming mobile home in a 55 & older park. Close to shopping.
Key facts
- New sheet rock
- New appliances
- New cabinetry
Tags
Neighborhood map
What this means for you Summary
Snapshot
- This is a 1-bed/1.0-bath manufactured listed at $65k.
Deal economics
- At list price, monthly cash flow is $902 ($11k/yr) — positive.
- The deal already cash-flows at list — no discount required.
- Meets the 1% rule at list price ($2k rent vs $65k).
- Recommended offer: $63k (3.0% below list) — sets the bar for market timing.
- Cap rate 22.9% vs local median 2.8% in Redmond — top-decile yield for the area; either an underpriced asset or a hidden risk that comps aren't pricing in. Stress-test before assuming the spread holds.
Location & tenants
- Location reads 78/100 on livability (#68 in OR, #2,715 nationally) — a middle-class / working-renter tenant base. Strengths: housing A+, health & safety A+, amenities A-; Watch: schools C-, commute F.
- Redmond SD 2J (town): math 24% / reading 42% proficiency, ranked #28 of 58 in OR (top 48%) — families likely to look elsewhere, expect single-tenant / working-renter base with shorter leases.
- Market conditions: Rents rising (+3.4%/yr); 731 active listings in the ZIP; 22 comparable units currently listed for rent nearby; rentals at typical pace (median 21d on market — plan ~3-4 weeks tenant-placement turnaround); 45% of comp listings sitting > 30 days — soft ceiling on asking rent; solid renter incomes; 1,624 units permitted in Deschutes County in 2024 (391 in 5+ unit buildings).
Forward outlook
- Local home prices are declining (-3.0%/yr); year-one equity from $449 of loan paydown is wiped out by about $2k of value loss. Plan a longer hold.
- Deschutes County population projected at +38% by 2050 — long-run rental-demand tailwind backs the buy-and-hold thesis.
- At projected returns (-3.0% appreciation + 3.4% rent growth), your $18k cash investment doubles in ~2 years — after that, you're playing with house money.
Negotiation context
- It's been on market 31 days — a 3% lower offer ($63k) is reasonable based on typical stale-listing flexibility.
- 6 sale attempts since 26y ago with the ask held roughly flat each time — persistent listings suggest the price (not the market) is what's stuck; bring a comps-based counter.
- Current owner paid $9k; list at $65k implies a 622% gain — meaningful room to come down on a strong offer.
Risks & watch-outs
- Climate carrying-cost: moderate wildfire risk — expect insurance premiums to compound above CPI over the hold.
Questions for the listing agent
- It's been on market 31 days. Have you received any prior offers? Is the seller open to a 3% concession, seller financing, or rate buy-down credit?
- Built in 1977 — when were the roof, HVAC, electrical panel, plumbing, and water heater last replaced?
- Is there a deadline driving the sale (1031 exchange, divorce, estate, relocation)? That informs how much negotiation room exists.
- What's the average days-on-market for RENTAL listings here right now (not sales)? A rising rental-DOM trend means longer vacancies and softer asking-rent achievability than the comps imply.
- What's the recent tenant-quality profile in this submarket — average credit score on applications, eviction rate, late-payment / NSF rate, and stable-employment percentage? A property-management company in the area should have these aggregated.
- How much new for-sale + rental construction is in the pipeline within 1–3 miles? Heavy new supply typically softens prices + rents 12–24 months out; constrained supply supports both.
Investment metrics
- 1% rule
- 2.63% ✓
- Cap rate
- 22.95%
- Cash-on-cash
- 59.49%
- DSCR
- 3.65
- GRM
- 3.2
CMA / ARV
No comps found within radius.
Projected returns pro-forma
-3.0% appreciation · 3.39% rent growth · sell at horizon
- IRR
- 58.6%
- Equity multiple
- 3.62×
- Total profit
- $47,631
- Equity at exit
- $9,692
- IRR
- 63.6%
- Equity multiple
- 7.50×
- Total profit
- $118,363
- Equity at exit
- $5,620
Cash invested: $18,200 (down + closing). Projections, not guarantees.
Landlord ↔ Tenant lean methodology
- Overall (STATE)
- 28 Tenant-Leaning
- State Oregon
- 28 Tenant-Leaning · D+6
- County
- — inherits STATE
- City
- — inherits STATE
ZIP-level market 97756
- Rents YoY
- 3.4%
- Active inventory
- 731
- Price-to-rent
- 3.2×
Monthly cashflow live
- Estimated rent
- $1,711 high interval (Pro) →
- Mortgage (P&I)
- −$341
- Tax est. 1.5%
- −$81 /mo · $975/yr
- Insurance
- −$27
- HOA
- −$0
- Vacancy / Maint / Mgmt
- −$359
- Net cashflow
- $902
Break-even live
UW: 25.0% down · 7.5% · 30yr · 1.5% tax · 5.0% vac · 8.0% maint · 8.0% mgmt
Financing live
Cash to close
- Down payment
- $16,250
- Closing costs
- $1,950
- Reserves months
- —
- Total cash needed
- —
Loan-product check · same deal, 3 products live
Conventional
25% down · 7.5% · 30yr
- Down + closing
- —
- Monthly P&I
- —
- Monthly cashflow
- —
- DSCR
- —
- Eligible?
- —
Personal DTI + credit; lowest rate.
DSCR
20% down · 8.5% · 30yr
- Down + closing
- —
- Monthly P&I
- —
- Monthly cashflow
- —
- DSCR
- —
- Eligible?
- —
No personal income docs; deal must DSCR.
Hard money
10% down · 12.0% · 12mo
- Down + closing
- —
- Monthly P&I
- —
- Monthly cashflow
- —
- DSCR
- —
- Eligible?
- —
Short-term bridge; refi at stabilization.
Rent comps 22 comps
| Address | Beds | Baths | Sqft | Rent | $/sqft | DOM | Units | Dist |
|---|---|---|---|---|---|---|---|---|
| 1840 SW 15th St Unit 1848-204 Redmond, OR | 2.0 | 2.0 | 976 | $1,795 | $1.84 | 13d | 1 | 0.02mi |
| 1840 SW 15th St Unit 1848-201 Redmond, OR | 2.0 | 2.0 | 976 | $1,795 | $1.84 | 44d | 1 | 0.05mi |
| 1840 SW 15th St Unit 1844-104 Redmond, OR | 2.0 | 2.0 | 976 | $1,825 | $1.87 | 44d | 1 | 0.05mi |
| 1329 SW Pumice Ave Redmond, OR | 1.0–3.0 | 1.0–2.0 | 988 | $1,788 | $1.81 | 13d | 14 | 0.10mi |
| 2120 SW Canyon Dr Unit 3 Redmond, OR | 2.0 | 2.5 | 1038 | $1,695 | $1.63 | 44d | 1 | 0.27mi |
| 1973 SW Canyon Dr Redmond, OR | 2.0 | 1.5 | 1025 | $1,725 | $1.68 | 44d | 1 | 0.28mi |
| 937 SW 11th St Unit 24 Redmond, OR | 2.0 | 1.5 | 925 | $1,495 | $1.62 | 21d | 1 | 0.63mi |
| 2442 SW 23rd St Redmond, OR | 2.0 | 2.0 | 1047 | $1,675 | $1.60 | 44d | 1 | 0.64mi |
| 2121 SW Umatilla Ave Unit 13 Redmond, OR | 2.0 | 2.0 | 900 | $1,495 | $1.66 | 44d | 1 | 0.69mi |
| 1950 SW Umatilla Ave Redmond, OR | 2.0–4.0 | 2.0 | 1064 | $1,493 | $1.40 | 13d | 8 | 0.71mi |
| 2825 SW Umatilla Ave Redmond, OR | 2.0 | 1.5 | 900 | $1,800 | $2.00 | 44d | 1 | 1.04mi |
| 340 SW Rimrock Way Redmond, OR | 2.0 | 1.0 | 662 | $1,380 | $2.08 | 13d | 3 | 1.10mi |
| 1042 SW Black Butte Blvd Unit B Redmond, OR | 2.0 | 1.0 | 800 | $1,150 | $1.44 | 13d | 1 | 1.14mi |
| 136 SW 3rd St Unit 136 Redmond, OR | 2.0 | 1.0 | 782 | $1,395 | $1.78 | 21d | 1 | 1.32mi |
| 217 NW 7th St Redmond, OR | 2.0 | 1.0 | 800 | $1,375 | $1.72 | 44d | 1 | 1.35mi |
| 1510 SW 36th Loop Redmond, OR | 2.0 | 1.0 | 880 | $1,895 | $2.15 | 21d | 1 | 1.37mi |
| 3570 SW Metolius Ave Redmond, OR | 1.0–4.0 | 1.0–2.5 | 1572 | $1,595 | $1.01 | 13d | 22 | 1.40mi |
| 123 W Antler Ave Unit 1 094 Redmond, OR | 2.0 | 1.5 | 1015 | $1,495 | $1.47 | 44d | 1 | 1.41mi |
| 405 NW 17th St #2 Redmond, OR | 2.0 | 1.0 | 975 | $1,450 | $1.49 | 13d | 1 | 1.41mi |
| 438 NW 17th St Unit 04 Redmond, OR | 2.0 | 1.0 | 1000 | $1,350 | $1.35 | 44d | 1 | 1.43mi |
| 423 NW 6th St Unit 17 Redmond, OR | 1.0 | 1.0 | 645 | $1,350 | $2.09 | 21d | 1 | 1.47mi |
| 233 NW Cedar Ave Unit D Redmond, OR | 1.0 | 1.0 | 700 | $2,100 | $3.00 | 21d | 1 | 1.48mi |
Listing history 35 events
-
2026-06-18days on market $65,000 Active 31 DOM
-
2026-06-17days on market $65,000 Active 30 DOM
-
2026-06-16days on market $65,000 Active 29 DOM
-
2026-06-15days on market $65,000 Active 28 DOM
-
2026-06-14days on market $65,000 Active 26 DOM
-
2026-06-13days on market $65,000 Active 25 DOM
-
2026-06-10days on market $65,000 Active 23 DOM
-
2026-06-09days on market $65,000 Active 22 DOM
-
2026-06-08days on market $65,000 Active 21 DOM
-
2026-06-07days on market $65,000 Active 20 DOM
-
2026-06-02days on market $65,000 Active 15 DOM
-
2026-06-01days on market $65,000 Active 14 DOM
-
2026-05-31days on market $65,000 Active 13 DOM
-
2026-05-30days on market $65,000 Active 12 DOM
-
2026-05-19$65,000 Active
-
2014-10-01soldstatus $9,000 67-char remark
Show marketing remark (67 chars)
Charming mobile home in a 55 & older park. Close to shopping.
-
2014-09-12historical 67-char remark
Show marketing remark (67 chars)
Charming mobile home in a 55 & older park. Close to shopping.
-
2014-07-23$11,900 67-char remark
Show marketing remark (67 chars)
Charming mobile home in a 55 & older park. Close to shopping.
-
2013-01-28soldstatus $8,000 224-char remark
Show marketing remark (224 chars)
Charming mobile home in a 55 & older park. This home is light & bright. In very good condition. Neighbor Impact has done extensive repairs and everything is up to date. Close to Fred Meyer, Safeway, Bi Mart, etc.
-
2013-01-23historical 224-char remark
Show marketing remark (224 chars)
Charming mobile home in a 55 & older park. This home is light & bright. In very good condition. Neighbor Impact has done extensive repairs and everything is up to date. Close to Fred Meyer, Safeway, Bi Mart, etc.
-
2012-11-06$12,000 224-char remark
Show marketing remark (224 chars)
Charming mobile home in a 55 & older park. This home is light & bright. In very good condition. Neighbor Impact has done extensive repairs and everything is up to date. Close to Fred Meyer, Safeway, Bi Mart, etc.
-
2012-09-28soldstatus $138,500
-
2007-03-29soldstatus $8,500
-
2007-03-23historical
-
2007-01-24$10,800
-
2005-05-13soldstatus $9,000
-
2005-04-25historical
-
2004-11-01$9,000
-
2002-07-10soldstatus $52,000
-
2000-08-02soldstatus $27,000
-
2000-07-13historical
-
2000-02-14$29,950
-
1996-03-22soldstatus $550,000
-
1993-06-29soldstatus $391,183
-
1992-08-04soldstatus $399,000
ⓘ Source: listings_history table (triggers on properties + properties_extension) + one-shot
backfill from property_details.listing_events for pre-trigger history.
Climate risk First Street
- Flood 1/10 Low FEMA zone X (unshaded) · 0% chance over 30 yrs
- Wildfire 5/10 Major
- Heat 3/10 Moderate 7 d/yr ≥92°F today · 16 d/yr by 30 yrs out
- Wind 1/10 Low
- Air quality 10/10 Extreme 22 unhealthy d/yr today · 25 by 30 yrs out
Nearby sold comps map
Loading sold comps map…
Walkable amenities ~0.75 mi
Loading nearby amenities…
Taxation est. · year 1
- Rental income
- $20,528
- − Mortgage interest
- −$3,641
- − Property taxes
- −$975
- − Insurance
- −$325
- − Repairs & maintenance
- −$1,642
- − Management
- −$1,642
- − Depreciation
- −$1,891
- Taxable income
- $10,412
- Est. tax owed @ 24.0%
- −$2,499
- After-tax cash flow
- $8,328/yr
For passive investors: Depreciation is non-cash, so a rental often shows a tax loss while cash-flowing — sheltering income. Rental losses are passive: they offset passive income freely, and up to $25,000/yr can offset ordinary (W-2) income if you actively participate and your MAGI is under $100k (phasing out to $0 by $150k); unused losses carry forward. On sale, claimed depreciation is recaptured at up to 25%, and gains may owe capital-gains tax (a 1031 exchange can defer both). Figures are a year-1 estimate at your 24.0% rate — not tax advice; consult a CPA.
Schools (NCES district)
- District
- Redmond SD 2J
- NCES district ID
- 4110350
- Math proficiency
- 24% ▼ -19.00%
- Reading proficiency
- 42% ▼ -11.00%
- Median HH income
- $51,027
- Composite
- 28.72/100
- National rank
- #6682
- State rank
- #28 of 58 in OR
Livability — Redmond
- Score
- 78/100
- State rank
- #68
- US rank
- #2715
Category grades
Schools grade is shown separately in the Schools card above.
Census & demographics
- Census place
- Redmond, OR
- County
- Deschutes County · 197,892 people
- City population
- 44,914
- Metro
- Bend, OR
- Population (ZIP)
- 44,914
- Household income
- $87,278
- Rent vs Own
- Severe rent burden
- 1205.0
Population outlook (Deschutes County) Hauer SSP2
- Today (2025)
- 213,908 people
- By 2030
- 232,387 · +8.6%
- By 2040
- 265,858 · +24.3%
- By 2050
- 295,286 · +38.0%
- By 2075
- 353,553 · +65.3%
- By 2100
- 380,293 · +77.8%
Race, ethnicity, and origin ACS 2023
- Neighborhood character
- Predominantly White (82%)
- Race & ethnicity
- White 82% Hispanic / Latino 13% Two or more races 4% Native American 2%
- Hispanic origin (detail)
- Mexican 10%
- Common ancestry
- Italian 5% Portuguese 4% Slovak 4%
- Foreign-born
- 6% · Canada, South Korea
- Languages at home
- 90% English-only · Spanish 8% Russian/Polish/Slavic 1%
Political lean MEDSL · Deschutes
- 2024 margin
- D (+10.1) · D 53.6% · R 43.5% · Other 2.8%
- 2008→2024 swing
- +10.4pp toward D · 2008: -0.3pp · 2024: 10.1pp
- All cycles
- 2024: D+10.1 2020: D+8.2 2016: R+3.8 2012: R+7.3 2008: R+0.3
Not yet ingested
- Civics
- —
Market trends
- HPI YoY
- ▼ -292.28%
- Current HPI
- 385.3027
- Rent YoY
- ▲ 3.39%
- Metro
- Bend, OR
- State GDP YoY
- ▲ 2.05%
- F500 in state
- 2
Industry mix (Fortune 500 HQ in OR)
| Industry | F500 HQs | Revenue |
|---|---|---|
| Consumer Goods | 1 | $51B |
|
||
Price history
-83.7% since first listed21 events — show timeline
- 2026-05-19 Listed $65,000 FSBO.com
- 2014-10-01 Sold (MLS) $9,000 MLSCO
- 2014-09-12 Listing Removed — MLSCO
- 2014-07-23 Listed $11,900 MLSCO
- 2013-01-28 Sold (MLS) $8,000 MLSCO
- 2013-01-23 Listing Removed — MLSCO
- 2012-11-06 Listed $12,000 MLSCO
- 2012-09-28 Sold (Public Records) $138,500 Public Records
- 2007-03-29 Sold (MLS) $8,500 MLSCO
- 2007-03-23 Listing Removed — MLSCO
- 2007-01-24 Listed $10,800 MLSCO
- 2005-05-13 Sold (MLS) $9,000 MLSCO
- 2005-04-25 Listing Removed — MLSCO
- 2004-11-01 Listed $9,000 MLSCO
- 2002-07-10 Sold (Public Records) $52,000 Public Records
- 2000-08-02 Sold (MLS) $27,000 MLSCO
- 2000-07-13 Listing Removed — MLSCO
- 2000-02-14 Listed $29,950 MLSCO
- 1996-03-22 Sold (Public Records) $550,000 Public Records
- 1993-06-29 Sold (Public Records) $391,183 Public Records
- 1992-08-04 Sold (Public Records) $399,000 Public Records
Property tax history
+4.5%/yrLatest (2025): $10,490 · +7.5% YoY. Source: county tax records.
Cash-flow waterfall
monthlySold comps — $/sqft
last 12 mo · ≤1 miLoading sold comps…