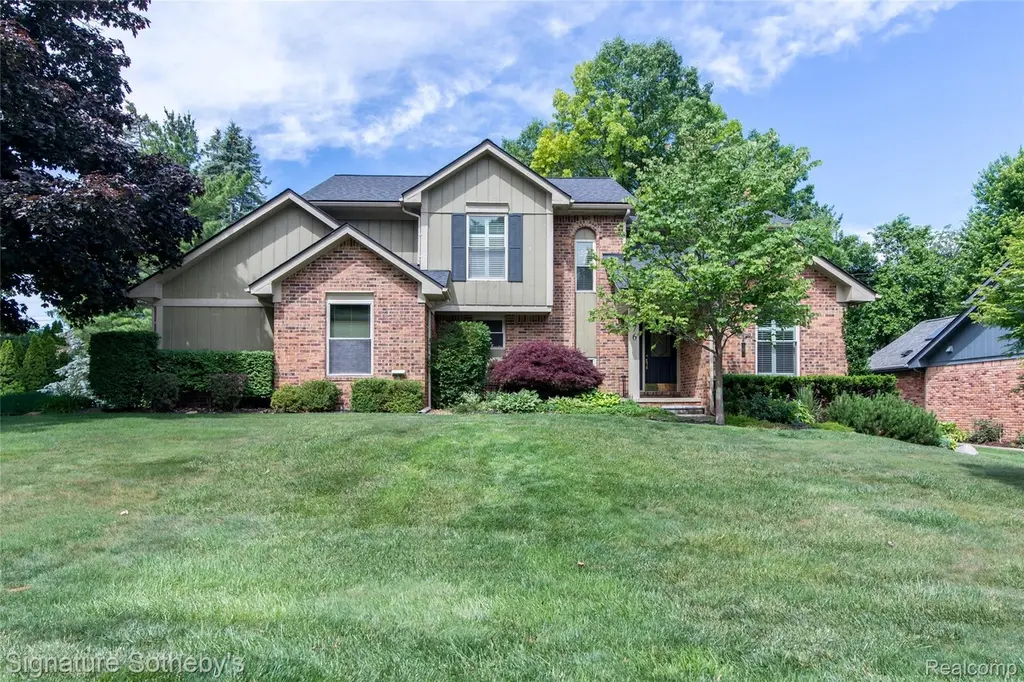
576 Ten Point Dr · Rochester Hills, MI
Flood risk 1/10 · Minimal
- FEMA flood zone
- X (unshaded)
- Chance of flooding over 30 yrs
- 0.0%
- Est. flood insurance / yr
- $507 – $1,088
Fire risk 1/10 · Minimal
- Est. fire insurance / yr
- $784 – $1,456
Heat risk 2/10 · Minimal
- Hot days now (above 97°F)
- 7 days/yr
- Hot days in 30 yrs
- 15 days/yr
Wind risk 2/10 · Minimal
- Chance of severe wind over 30 yrs
- —
Air-quality risk 3/10 · Minor
- Unhealthy air days now
- 2 days/yr
- Unhealthy air days in 30 yrs
- 5 days/yr
Risk factors via First Street. Map © Google.
Why this score? — see what drove the D- grade
The composite is a weighted blend of 9 inputs, each scored 0–100. Each bar is that input's sub-score; the figure is the points it added to the 100-point composite (weight × sub-score).
- Cash flow +12.2/30.0
- Schools +5.9/10.0
- ARV discount +5.3/15.0
- Livability +3.9/5.0
- DSCR +3.6/10.0
- 1% rule +2.9/10.0
- Rent growth +2.5/5.0
- Condition / age +2.5/5.0
- Appreciation +0.0/10.0
$475,000
🖨 Deal sheet 📄 Offer letter ✓ Due diligence
Listing remarks MLS
Welcome to this beautifully maintained 3-bedroom, 2.5-bath, colonial home located on sought-after Ten Point Drive in the desirable Deer Run neighborhood. This brick & wood home offers exceptional curb appeal with a blend of classic design & modern comfort. Step inside to find a spacious & inviting layout perfect for both everyday living & entertaining. The sun-filled Great Room is certainly the hub of the home and centers around the natural brick fireplace with door walls & views of the beautifully designed landscaped yard & rebuilt deck. The home features warm colors, wood floors & an open floor plan. The eat-in Kitchen easily flows from the Great Room & is nicely appointed with ample counter space and cabinets, stainless steel appliances, & access to the deck. Convenient first floor Library/Den, is currently being used as a Dining Room so offers options for the space. Inviting Powder Room & first floor laundry complete the first floor. Upstairs offers 3 generously sized bedrooms, including the primary ensuite, all with double closets & a light-filled main bath featuring a cool skylight. The finished basement provides extra living space including a large family room, recreation room, office, & extra storage area with workbench. Basement is roughed in & plumbed for bathroom. Everything you need! Outside you are surrounded with an extra-large private corner lot, paver walkway to dual deck, perfect for your enjoyment & relaxation. Additional features include a 2.5 car garage, newer windows & a reverse osmosis system. The Deer Run subdivision offers residents access to a scenic neighborhood park complete with walking trails & a tranquil pond, all within walking distance of your front door. Located in the award-winning Rochester Community School District & close to shopping, dining, & expressways, this home combines comfort, convenience, & a prime location. This home is truly turnkey & ready for its next owner. Let the memories begin!
Key facts
- Rebuilt deck
- Colonial home
- Landscaped yard
Tags
Property features AI
Finance
- Other: Subdivision: DEER RUN; Paved road access; Lot dimensions approximately 90 x 144 (0.3 acres); Directions: North off Avon onto Stag Ridge, right onto Ten Point
- HOA & community: Homeowners association with an annual fee of $150 (about $12.50/month)
Exterior
- Parking: Attached garage with direct access and garage door opener; Garage faces side; Approximately 2.5 garage spaces
- Utilities: Public water; Public sewer; Cable available; Underground utilities
- Home design: Single-family residence; Two levels; Ground-level entry with steps; Brick and wood siding construction
- Construction: Built with brick and wood siding; Asphalt roof; Finished below-grade area
- Exterior features: Corner, level lot; Outdoor lighting; Covered porch; Deck; Porch
Interior
- Kitchen: Oven; Convection oven; Self-cleaning oven; Free-standing gas range; Stainless steel appliances; Dishwasher; Disposal; Microwave; Ice maker; Warming drawer; Water purifier (owned); Water softener (owned); Free-standing refrigerator; Gas water heater
- Bedrooms: 9 total rooms (includes bedrooms and living spaces)
- Bathrooms: Two full bathrooms; One half bathroom
- Heating & cooling: Forced-air heating (natural gas); Exhaust fan; Humidifier; Central air; Ceiling fans
- Interior features: Entrance foyer; High-speed internet; Smart thermostat; Wood-burning fireplace in the great room; Finished full basement with bath stubbed and sump pump; Air purifier; Dehumidifier
- Laundry & utility: Laundry room with washer and dryer hookups; Gas dryer hookup; Washer hookup
Neighborhood map
What this means for you Summary
Snapshot
- This is a 3-bed/2.5-bath single-family listed at $475k.
Deal economics
- At list price, monthly cash flow is $-92 ($-1k/yr) — negative.
- To cash-flow at today's rent, offer at most $459k (3.4% below list).
- To meet the 1% rule (rent ≥ 1% of price), the offer needs to be $375k (21.0% below list).
- Recommended offer: $375k (21.0% below list) — sets the bar for 1% rule.
- Cap rate 6.1% vs local median 3.2% in Rochester Hills — top-decile yield for the area; either an underpriced asset or a hidden risk that comps aren't pricing in. Stress-test before assuming the spread holds.
Location & tenants
- Location reads 77/100 on livability (#127 in MI, #3,163 nationally) — a middle-class / working-renter tenant base. Strengths: crime A+, employment A+, housing A+; Watch: health & safety D, amenities F, commute F.
- Rochester Community School District (suburban): math 60% / reading 69% proficiency, ranked #21 of 540 in MI (top 4%) — acceptable for families but not a draw, mixed tenant base, ~2y average lease; only 10% free/reduced lunch — higher-income household profile.
- Market conditions: 149 active listings in the ZIP; 3 comparable units currently listed for rent nearby; rentals at typical pace (median 25d on market — plan ~3-4 weeks tenant-placement turnaround); 2,614 units permitted in Oakland County in 2024 (721 in 5+ unit buildings).
Forward outlook
- Local home prices are declining (-3.0%/yr); year-one equity from $3k of loan paydown is wiped out by about $14k of value loss. Plan a longer hold.
- Oakland County population projected at +10% by 2050 — modest demand growth; plan on rents tracking national, not racing it.
Negotiation context
- Only 2 days on market — expect competitive offers; lowballing is unlikely to land.
- 8 sale attempts since 21y ago with the ask held roughly flat each time — persistent listings suggest the price (not the market) is what's stuck; bring a comps-based counter.
- Current owner paid $222k; list at $475k implies a 114% gain — meaningful room to come down on a strong offer.
Questions for the listing agent
- What do current leases actually rent for vs. the listed asking? Can we see a recent rent roll and the last 12 months of T-12 income?
- What does the HOA fee cover, when was the last increase, and are there any pending special assessments or reserve-fund shortfalls?
- Is there a deadline driving the sale (1031 exchange, divorce, estate, relocation)? That informs how much negotiation room exists.
- Schools are A-rated — typically a magnet for longer-tenancy family renters. What's the average tenant stay here, and is there a school-zone premium baked into asking?
- The area grade is low — what's the realistic commute time and amenity access for the typical tenant pool here? Any planned neighborhood developments (good or bad) we should know about?
- What's the average days-on-market for RENTAL listings here right now (not sales)? A rising rental-DOM trend means longer vacancies and softer asking-rent achievability than the comps imply.
- What's the recent tenant-quality profile in this submarket — average credit score on applications, eviction rate, late-payment / NSF rate, and stable-employment percentage? A property-management company in the area should have these aggregated.
- How much new for-sale + rental construction is in the pipeline within 1–3 miles? Heavy new supply typically softens prices + rents 12–24 months out; constrained supply supports both.
Investment metrics
- 1% rule
- 0.79% ✗
- Cap rate
- 6.06%
- Cash-on-cash
- -0.83%
- DSCR
- 0.96
- GRM
- 10.6
CMA / ARV
- ARV (on-the-fly)
- $453,220
- Comps found
- 12
Show comp detail 12 sales within ~0.75 mi
| Address | Dist | Beds/Ba | Sqft | Sold | Price | $/sf | Match |
|---|---|---|---|---|---|---|---|
| 758 Lake Forest Rd | 0.28mi | 3/2.5 | 2,183 (+4%) | 6mo | $470,000 | $215 | 76 |
| 625 Ten Point Dr | 0.06mi | 4/2.5 (+1) | 2,206 (+5%) | 11mo | $460,000 | $209 | 76 |
| 483 Rochdale Dr S | 0.33mi | 3/1.5 | 2,273 (+8%) | 10mo | $375,000 | $165 | 59 |
| 1811 Ansal Dr | 0.36mi | 3/2.5 | 2,361 (+12%) | 6mo | $471,000 | $199 | 58 |
| 2063 Avoncrest Dr | 0.59mi | 3/1.5 | 2,143 (+2%) | 9mo | $572,500 | $267 | 58 |
| 887 Ravine Terrace Dr | 0.59mi | 4/2.5 (+1) | 2,078 (-1%) | 10mo | $495,000 | $238 | 57 |
| 1726 Black Maple Dr | 0.57mi | 3/2.5 | 2,244 (+6%) | 10mo | $540,000 | $241 | 54 |
| 1430 Stockport Dr | 0.47mi | 3/1.5 | 1,878 (-11%) | 2mo | $329,000 | $175 | 54 |
| 326 Orchardale Dr | 0.37mi | 3/2.5 | 2,411 (+14%) | 11mo | $470,000 | $195 | 50 |
| 800 Ravine Terrace Dr | 0.64mi | 4/2.5 (+1) | 2,340 (+11%) | 1mo | $538,000 | $230 | 46 |
| 2036 Belle Vernon Dr | 0.63mi | 4/2.5 (+1) | 1,910 (-9%) | 11mo | $475,000 | $249 | 41 |
| 2072 Belle Vernon Dr | 0.66mi | 4/2.5 (+1) | 2,414 (+14%) | 8mo | $435,000 | $180 | 34 |
Match score weights: distance 35% · size 25% · config 20% · recency 20%. Top-matched comps best support the ARV.
Projected returns pro-forma
-3.0% appreciation · 3.0% rent growth · sell at horizon
- IRR
- -17.7%
- Equity multiple
- 0.38×
- Total profit
- $-82,881
- Equity at exit
- $70,824
- IRR
- -9.8%
- Equity multiple
- 0.40×
- Total profit
- $-80,014
- Equity at exit
- $41,069
Cash invested: $133,000 (down + closing). Projections, not guarantees.
Landlord ↔ Tenant lean methodology
- Overall (STATE)
- 62 Landlord-Friendly
- State Michigan
- 62 Landlord-Friendly · EVEN
- County
- — inherits STATE
- City
- — inherits STATE
ZIP-level market 48309
- Active inventory
- 149
- Price-to-rent
- 10.6×
Monthly cashflow live
- Estimated rent
- $3,751 medium interval (Pro) →
- Mortgage (P&I)
- −$2,491
- Tax from tax record
- −$353 /mo · $4,238/yr
- Insurance
- −$198
- HOA
- −$13
- Vacancy / Maint / Mgmt
- −$788
- Net cashflow
- $-92
Break-even live
UW: 25.0% down · 7.5% · 30yr · 1.5% tax · 5.0% vac · 8.0% maint · 8.0% mgmt
Financing live
Cash to close
- Down payment
- $118,750
- Closing costs
- $14,250
- Reserves months
- —
- Total cash needed
- —
Loan-product check · same deal, 3 products live
Conventional
25% down · 7.5% · 30yr
- Down + closing
- —
- Monthly P&I
- —
- Monthly cashflow
- —
- DSCR
- —
- Eligible?
- —
Personal DTI + credit; lowest rate.
DSCR
20% down · 8.5% · 30yr
- Down + closing
- —
- Monthly P&I
- —
- Monthly cashflow
- —
- DSCR
- —
- Eligible?
- —
No personal income docs; deal must DSCR.
Hard money
10% down · 12.0% · 12mo
- Down + closing
- —
- Monthly P&I
- —
- Monthly cashflow
- —
- DSCR
- —
- Eligible?
- —
Short-term bridge; refi at stabilization.
Rent comps 3 comps
| Address | Beds | Baths | Sqft | Rent | $/sqft | DOM | Units | Dist |
|---|---|---|---|---|---|---|---|---|
| 1467 Rochdale Pond Ct Rochester Hills, MI | 4.0 | 3.0 | 2510 | $4,375 | $1.74 | 24d | 1 | 0.76mi |
| 709 Denham Ln Rochester Hills, MI | 3.0 | 2.5 | 2252 | $3,000 | $1.33 | 24d | 1 | 1.26mi |
| 112 Walnut Blvd Rochester, MI | 1.0–3.0 | 1.0–2.0 | 1171 | $3,400 | $2.90 | 43d | 3 | 1.48mi |
HOA detail
- Monthly dues
- $13 · $156/yr
Listing history 3 events
-
2026-06-18days on market $475,000 Active 2 DOM
-
2026-06-17remarks 671-char remark
-
2026-06-17$475,000 Active 1 DOM
ⓘ Source: listings_history table (triggers on properties + properties_extension) + one-shot
backfill from property_details.listing_events for pre-trigger history.
Tax reassessment forecast MI · Partial reset (capped growth)
- Current annual tax
- $4,238 · $353/mo
- Projected year-2 tax
- $5,777 · $481/mo
- Expected delta
- +$1,538/yr (+$128/mo · 36.3%)
ⓘ Screening estimate from a state-policy table — verify with the county assessor before closing.
Climate risk First Street
- Flood 1/10 Low FEMA zone X (unshaded) · 0% chance over 30 yrs
- Wildfire 1/10 Low
- Heat 2/10 Low 7 d/yr ≥97°F today · 15 d/yr by 30 yrs out
- Wind 2/10 Low
- Air quality 3/10 Moderate 2 unhealthy d/yr today · 5 by 30 yrs out
Nearby sold comps map
Loading sold comps map…
Walkable amenities ~0.75 mi
Loading nearby amenities…
Taxation est. · year 1
- Rental income
- $45,016
- − Mortgage interest
- −$26,607
- − Property taxes
- −$4,238
- − Insurance
- −$2,375
- − Repairs & maintenance
- −$3,601
- − Management
- −$3,601
- − HOA
- −$156
- − Depreciation
- −$13,818
- Taxable loss
- −$9,381
- Est. tax savings @ 24.0%
- +$2,252
- After-tax cash flow
- $1,154/yr
For passive investors: Depreciation is non-cash, so a rental often shows a tax loss while cash-flowing — sheltering income. Rental losses are passive: they offset passive income freely, and up to $25,000/yr can offset ordinary (W-2) income if you actively participate and your MAGI is under $100k (phasing out to $0 by $150k); unused losses carry forward. On sale, claimed depreciation is recaptured at up to 25%, and gains may owe capital-gains tax (a 1031 exchange can defer both). Figures are a year-1 estimate at your 24.0% rate — not tax advice; consult a CPA.
Schools (NCES district)
- District
- Rochester Community School District
- NCES district ID
- 2629940
- Math proficiency
- 60% ▼ -9.00%
- Reading proficiency
- 69% ▼ -4.00%
- Median HH income
- $89,242
- Composite
- 58.53/100
- National rank
- #994
- State rank
- #21 of 540 in MI
Livability — Rochester Hills
- Score
- 77/100
- State rank
- #127
- US rank
- #3163
Category grades
Schools grade is shown separately in the Schools card above.
Census & demographics
- Census place
- Rochester Hills, MI
- City population
- 44,714
- Population (ZIP)
- 30,254
Population outlook (Oakland County) Hauer SSP2
- Today (2025)
- 1,335,747 people
- By 2030
- 1,375,100 · +2.9%
- By 2040
- 1,435,385 · +7.5%
- By 2050
- 1,469,250 · +10.0%
- By 2075
- 1,531,946 · +14.7%
- By 2100
- 1,450,485 · +8.6%
Race, ethnicity, and origin ACS 2023
- Neighborhood character
- Predominantly White (75%)
- Race & ethnicity
- White 75% Asian 12% Two or more races 6% Hispanic / Latino 4% Black 4%
- Common ancestry
- Romanian 10% Lithuanian 3% Slovak 3%
- Foreign-born
- 19% · Canada, China, South Korea
- Languages at home
- 80% English-only · Other Indo-European 6% Chinese 3% Russian/Polish/Slavic 2%
Political lean MEDSL · Oakland
- 2024 margin
- D (+10.6) · D 54.4% · R 43.8% · Other 1.9%
- 2008→2024 swing
- -3.9pp toward R · 2008: 14.5pp · 2024: 10.6pp
- All cycles
- 2024: D+10.6 2020: D+14.1 2016: D+8.1 2012: D+8.1 2008: D+14.5
Not yet ingested
- Civics
- —
Market trends
- HPI YoY
- ▼ -136.99%
- Current HPI
- 201.9197
- Rent YoY
- —
- Metro
- —
- State GDP YoY
- ▲ 1.37%
- F500 in state
- 28
Industry mix (Fortune 500 HQ in MI)
| Industry | F500 HQs | Revenue |
|---|---|---|
| Automotive Parts | 3 | $48B |
|
||
| Automotive | 2 | $372B |
|
||
| Chemicals | 1 | $45B |
|
||
| Automotive Retail | 1 | $29B |
|
||
| Healthcare / Medical Devices | 1 | $23B |
|
||
| Automotive Technology | 1 | $20B |
|
||
Price history
+388.0% since first listed19 events — show timeline
- 2026-06-16 Listed $475,000 REALCOMP
- 2026-06-16 Listed $475,000 MiRealSource-MiMLS
- 2008-12-16 Sold (Public Records) $221,500 Public Records
- 2008-12-09 Sold (MLS) $221,500 REALCOMP
- 2008-12-09 Sold (MLS) $221,500 MiRealSource-MiMLS
- 2008-11-07 Listing Removed — MiRealSource-MiMLS
- 2008-09-09 Listed $229,900 MiRealSource-MiMLS
- 2008-09-08 Listed $229,900 REALCOMP
- 2005-11-22 Sold (MLS) $289,000 SW Michigan MLS
- 2005-11-22 Sold (MLS) $289,000 REALCOMP
- 2005-11-22 Sold (MLS) $289,000 AAMLS
- 2005-11-22 Sold (MLS) $289,000 MiRealSource-MiMLS
- 2005-10-24 Delisted — AAMLS
- 2005-10-24 Listing Removed — MiRealSource-MiMLS
- 2005-09-19 Listed $289,000 SW Michigan MLS
- 2005-09-19 Listed $289,000 REALCOMP
- 2005-09-19 Listed $289,000 AAMLS
- 2005-09-19 Listed $289,000 MiRealSource-MiMLS
- 1984-07-01 Sold (Public Records) $97,340 Public Records
Property tax history
+1.9%/yrLatest (2025): $4,238 · +4.3% YoY. Source: county tax records.
Cash-flow waterfall
monthlySold comps — $/sqft
last 12 mo · ≤1 miLoading sold comps…