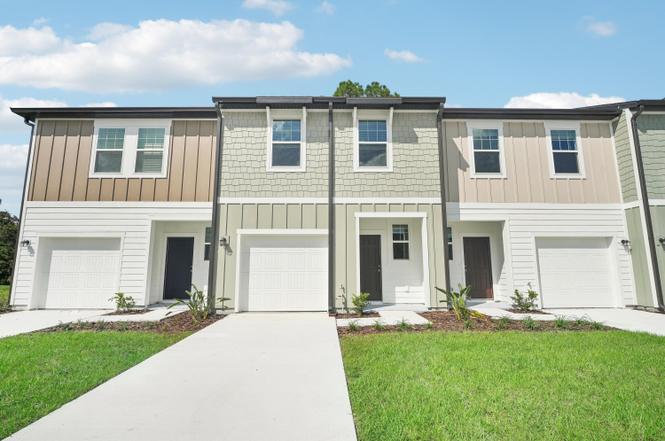
185 Cotton Leaf Blvd · Summerville, SC
Flood risk No data
- FEMA flood zone
- —
- Chance of flooding over 30 yrs
- —
- Est. flood insurance / yr
- —
Fire risk No data
- Est. fire insurance / yr
- —
Heat risk No data
- Hot days now (above threshold)
- —
- Hot days in 30 yrs
- —
Wind risk No data
- Chance of severe wind over 30 yrs
- —
Air-quality risk No data
- Unhealthy air days now
- —
- Unhealthy air days in 30 yrs
- —
Risk factors via First Street. Map © Google.
Why this score? — see what drove the D grade
The composite is a weighted blend of 9 inputs, each scored 0–100. Each bar is that input's sub-score; the figure is the points it added to the 100-point composite (weight × sub-score).
- Cash flow +11.0/30.0
- ARV discount +11.0/15.0
- 1% rule +3.8/10.0
- Schools +3.6/10.0
- DSCR +3.2/10.0
- Rent growth +3.2/5.0
- Livability +3.2/5.0
- Condition / age +2.5/5.0
- Appreciation +0.0/10.0
$265,990
🖨 Deal sheet 📄 Offer letter ✓ Due diligence
Listing remarks
Welcome to Aster Towns! These brand-new townhomes are a part of the master-planned community of Cane Bay. Enjoy the spacious open-concept floorplan, complete with included appliances, and beautiful LVP flooring downstairs. Upstairs, enjoy a spacious owner's suite complete with a full-sized bathroom and large walk-in closet. Right down the hall, you will find 2 guest rooms with a full bathroom. Your ideal lifestyle awaits in these move-in ready townhomes!
Key facts
- $130 HOA
- Garage
- Built 2025
Neighborhood map
What this means for you Summary
Snapshot
- This is a 3-bed/2.5-bath townhouse listed at $266k.
Deal economics
- At list price, monthly cash flow is $-113 ($-1k/yr) — negative.
- To cash-flow at today's rent, offer at most $250k (6.2% below list).
- To meet the 1% rule (rent ≥ 1% of price), the offer needs to be $235k (11.7% below list).
- Recommended offer: $235k (11.7% below list) — sets the bar for 1% rule.
- Cap rate 5.8% vs local median 4.0% in Summerville — top-decile yield for the area; either an underpriced asset or a hidden risk that comps aren't pricing in. Stress-test before assuming the spread holds.
Location & tenants
- Location reads 63/100 on livability (#167 in SC) — a middle-class / working-renter tenant base. Strengths: housing A+, cost of living B+; Watch: amenities F, commute F, health & safety F.
- Berkeley 01 (suburban): math 35% / reading 48% proficiency, ranked #30 of 80 in SC (top 38%) — families likely to look elsewhere, expect single-tenant / working-renter base with shorter leases.
- Zoned schools: Whitesville Elementary (math 34% / reading 39%, grade F, #328 of 597 statewide, top 55%, 1,031 students, 62% FRL); Berkeley Middle (math 19% / reading 32%, grade F, #162 of 229 statewide, top 71%, 1,403 students, 57% FRL); Berkeley High (math 36% / reading 83%, grade C+, #110 of 196 statewide, top 58%, 1,776 students, 50% FRL).
- Market conditions: Rents rising (+2.7%/yr); 1283 active listings in the ZIP; 19 comparable units currently listed for rent nearby; rentals leasing fast (median 3d on market — plan ~1-2 weeks tenant-placement turnaround); solid renter incomes; 3,183 units permitted in Berkeley County in 2024 (580 in 5+ unit buildings).
- This rent runs 31% of the median local income ($90k/yr) — at the standard rent-burdened threshold; future hikes will face affordability resistance.
Forward outlook
- Local home prices are declining (-3.0%/yr); year-one equity from $2k of loan paydown is wiped out by about $8k of value loss. Plan a longer hold.
- Berkeley County population projected at +48% by 2050 — long-run rental-demand tailwind backs the buy-and-hold thesis.
Negotiation context
- Only 9 days on market — expect competitive offers; lowballing is unlikely to land.
Questions for the listing agent
- What do current leases actually rent for vs. the listed asking? Can we see a recent rent roll and the last 12 months of T-12 income?
- What does the HOA fee cover, when was the last increase, and are there any pending special assessments or reserve-fund shortfalls?
- Is there a deadline driving the sale (1031 exchange, divorce, estate, relocation)? That informs how much negotiation room exists.
- Schools are B-rated — typically a magnet for longer-tenancy family renters. What's the average tenant stay here, and is there a school-zone premium baked into asking?
- The area grade is low — what's the realistic commute time and amenity access for the typical tenant pool here? Any planned neighborhood developments (good or bad) we should know about?
- What's the average days-on-market for RENTAL listings here right now (not sales)? A rising rental-DOM trend means longer vacancies and softer asking-rent achievability than the comps imply.
- What's the recent tenant-quality profile in this submarket — average credit score on applications, eviction rate, late-payment / NSF rate, and stable-employment percentage? A property-management company in the area should have these aggregated.
- How much new for-sale + rental construction is in the pipeline within 1–3 miles? Heavy new supply typically softens prices + rents 12–24 months out; constrained supply supports both.
Investment metrics
- 1% rule
- 0.88% ✗
- Cap rate
- 5.78%
- Cash-on-cash
- -1.83%
- DSCR
- 0.92
- GRM
- 9.4
CMA / ARV
- ARV (on-the-fly)
- $288,288
- Comps found
- 12
Show comp detail 12 sales within ~0.75 mi
| Address | Dist | Beds/Ba | Sqft | Sold | Price | $/sf | Match |
|---|---|---|---|---|---|---|---|
| 185 Cotton Leaf Blvd #38 | 0.00mi | 3/2.5 | 1,386 (0%) | 2mo | $260,000 | $188 | 98 |
| 179 Cotton Leaf Blvd | 0.01mi | 3/2.5 | 1,387 (+0%) | 3mo | $286,690 | $207 | 96 |
| 184 Cotton Leaf Blvd | 0.02mi | 3/2.5 | 1,386 (0%) | 4mo | $293,990 | $212 | 96 |
| 175 Cotton Leaf Blvd | 0.02mi | 3/2.5 | 1,386 (0%) | 4mo | $276,490 | $199 | 96 |
| 167 Cotton Leaf Blvd | 0.04mi | 3/2.5 | 1,386 (0%) | 4mo | $299,990 | $216 | 95 |
| 151 Cotton Leaf Blvd #55 | 0.08mi | 3/2.5 | 1,386 (0%) | 2mo | $292,990 | $211 | 94 |
| 158 Cotton Leaf Blvd | 0.06mi | 3/2.5 | 1,386 (0%) | 4mo | $287,990 | $208 | 94 |
| 163 Cotton Leaf Blvd | 0.05mi | 3/2.5 | 1,386 (0%) | 5mo | $284,990 | $206 | 94 |
| 183 Cotton Leaf Blvd | 0.00mi | 2/2.5 (-1) | 1,387 (+0%) | 4mo | $289,000 | $208 | 91 |
| 160 Cotton Leaf Blvd | 0.06mi | 2/2.5 (-1) | 1,386 (0%) | 4mo | $289,990 | $209 | 89 |
| 159 Cotton Leaf Blvd | 0.06mi | 2/2.5 (-1) | 1,387 (+0%) | 4mo | $287,990 | $208 | 89 |
| 205 Cozy Brook Ct | 0.49mi | 3/2.5 | 1,584 (+14%) | 3mo | $312,700 | $197 | 51 |
Match score weights: distance 35% · size 25% · config 20% · recency 20%. Top-matched comps best support the ARV.
Projected returns pro-forma
-3.0% appreciation · 2.67% rent growth · sell at horizon
- IRR
- -19.7%
- Equity multiple
- 0.32×
- Total profit
- $-50,979
- Equity at exit
- $39,660
- IRR
- -13.1%
- Equity multiple
- 0.24×
- Total profit
- $-56,382
- Equity at exit
- $22,998
Cash invested: $74,477 (down + closing). Projections, not guarantees.
Landlord ↔ Tenant lean methodology
- Overall (STATE)
- 90 Strongly Landlord-Friendly
- State South Carolina
- 90 Strongly Landlord-Friendly · R+6
- County
- — inherits STATE
- City
- — inherits STATE
ZIP-level market 29486
- Home prices YoY
- -15.6%
- Rents YoY
- 2.7%
- Active inventory
- 1283
- Price-to-rent
- 9.4×
Monthly cashflow live
- Estimated rent
- $2,348 high interval (Pro) →
- Mortgage (P&I)
- −$1,395
- Tax est. 1.5%
- −$332 /mo · $3,990/yr
- Insurance
- −$111
- HOA
- −$130
- Vacancy / Maint / Mgmt
- −$493
- Net cashflow
- $-113
Break-even live
UW: 25.0% down · 7.5% · 30yr · 1.5% tax · 5.0% vac · 8.0% maint · 8.0% mgmt
Financing live
Cash to close
- Down payment
- $66,498
- Closing costs
- $7,980
- Reserves months
- —
- Total cash needed
- —
Loan-product check · same deal, 3 products live
Conventional
25% down · 7.5% · 30yr
- Down + closing
- —
- Monthly P&I
- —
- Monthly cashflow
- —
- DSCR
- —
- Eligible?
- —
Personal DTI + credit; lowest rate.
DSCR
20% down · 8.5% · 30yr
- Down + closing
- —
- Monthly P&I
- —
- Monthly cashflow
- —
- DSCR
- —
- Eligible?
- —
No personal income docs; deal must DSCR.
Hard money
10% down · 12.0% · 12mo
- Down + closing
- —
- Monthly P&I
- —
- Monthly cashflow
- —
- DSCR
- —
- Eligible?
- —
Short-term bridge; refi at stabilization.
Rent comps 19 comps
| Address | Beds | Baths | Sqft | Rent | $/sqft | DOM | Units | Dist |
|---|---|---|---|---|---|---|---|---|
| 229 Grand View Xing Summerville, SC | 4.0 | 2.0 | 1768 | $2,400 | $1.36 | 14d | 1 | 0.17mi |
| 391 Tiliwa St Summerville, SC | 3.0 | 2.5 | 1786 | $2,295 | $1.28 | 3d | 1 | 0.28mi |
| 402 Tiliwa St Summerville, SC | 3.0 | 2.5 | 1785 | $2,295 | $1.29 | 3d | 1 | 0.32mi |
| 753 Ridgley Dr Summerville, SC | 3.0 | 2.5 | 1786 | $2,295 | $1.28 | 21d | 1 | 0.46mi |
| 755 Ridgley Dr Unit 755 Summerville, SC | 3.0 | 2.5 | 1796 | $2,500 | $1.39 | 3d | 1 | 0.47mi |
| 704 Ladywood Dr Summerville, SC | 3.0 | 2.0 | 1618 | $2,350 | $1.45 | 3d | 1 | 0.50mi |
| 44000 Owl Wood Ln Summerville, SC | 1.0–3.0 | 1.0–2.0 | 1086 | $2,129 | $1.96 | 3d | 14 | 0.69mi |
| 608 Ladywood Dr Summerville, SC | 3.0 | 2.0 | 1618 | $2,200 | $1.36 | 11d | 1 | 0.77mi |
| 108 Haventree Ct Summerville, SC | 4.0 | 2.5 | 1792 | $2,400 | $1.34 | 23d | 1 | 0.78mi |
| 5101 Evado Ln Summerville, SC | 3.0 | 1.0–2.0 | 859 | $2,136 | $2.49 | 2d | 19 | 0.82mi |
| 900 Emblem St Summerville, SC | 1.0–3.0 | 1.0–2.0 | 1086 | $2,159 | $1.99 | 2d | 21 | 0.83mi |
| 130 Lucky Day Dr Summerville, SC | 3.0 | 2.0 | 1547 | $2,100 | $1.36 | 2d | 1 | 0.91mi |
| 844 Lilyford Ln , SC | 3.0 | 2.5 | 1518 | $2,300 | $1.52 | 23d | 1 | 1.00mi |
| 900 Owl Wood Ln Summerville, SC | 2.0 | 2.0 | 1157 | $2,385 | $2.06 | 23d | 1 | 1.23mi |
| 900 Owl Wood Ln Summerville, SC | 3.0 | 2.0 | 1311 | $2,273 | $1.73 | 3d | 1 | 1.23mi |
| 175 Lyra Ln Summerville, SC | 3.0–4.0 | 2.0–3.0 | 2082 | $2,200 | $1.06 | 3d | 3 | 1.25mi |
| 495 Pender Woods Dr Summerville, SC | 3.0 | 2.0 | 1418 | $2,175 | $1.53 | 23d | 1 | 1.39mi |
| 318 Deep River Rd Summerville, SC | 4.0 | 2.0 | 1689 | $2,349 | $1.39 | 14d | 1 | 1.40mi |
| 310 Surfbird Rd Summerville, SC | 3.0 | 2.5 | 1761 | $2,350 | $1.33 | 10d | 1 | 1.40mi |
HOA detail
- Monthly dues
- $130 · $1,560/yr
Listing history 2 events
-
2025-10-27status Pending
-
2025-10-18$265,990 Active
ⓘ Source: listings_history table (triggers on properties + properties_extension) + one-shot
backfill from property_details.listing_events for pre-trigger history.
Nearby sold comps map
Loading sold comps map…
Walkable amenities ~0.75 mi
Loading nearby amenities…
Taxation est. · year 1
- Rental income
- $28,176
- − Mortgage interest
- −$14,900
- − Property taxes
- −$3,990
- − Insurance
- −$1,330
- − Repairs & maintenance
- −$2,254
- − Management
- −$2,254
- − HOA
- −$1,560
- − Depreciation
- −$7,738
- Taxable loss
- −$5,850
- Est. tax savings @ 24.0%
- +$1,404
- After-tax cash flow
- $44/yr
For passive investors: Depreciation is non-cash, so a rental often shows a tax loss while cash-flowing — sheltering income. Rental losses are passive: they offset passive income freely, and up to $25,000/yr can offset ordinary (W-2) income if you actively participate and your MAGI is under $100k (phasing out to $0 by $150k); unused losses carry forward. On sale, claimed depreciation is recaptured at up to 25%, and gains may owe capital-gains tax (a 1031 exchange can defer both). Figures are a year-1 estimate at your 24.0% rate — not tax advice; consult a CPA.
Schools (NCES district)
- District
- Berkeley 01
- NCES district ID
- 4501170
- Math proficiency
- 35% ▼ -8.00%
- Reading proficiency
- 48% ▼ -2.00%
- Median HH income
- $52,724
- Composite
- 35.95/100
- National rank
- #4799
- State rank
- #30 of 80 in SC
Livability — Summerville
- Score
- 63/100
- State rank
- #167
- US rank
- #15058
Category grades
Schools grade is shown separately in the Schools card above.
Census & demographics
- County
- Berkeley County · 198,768 people
- City population
- 171,668
- Metro
- Charleston-North Charleston, SC
- Population (ZIP)
- 53,975
- Household income
- $89,578
- Rent vs Own
- Severe rent burden
- 1017.0
Population outlook (Berkeley County) Hauer SSP2
- Today (2025)
- 254,184 people
- By 2030
- 279,677 · +10.0%
- By 2040
- 329,379 · +29.6%
- By 2050
- 375,557 · +47.8%
- By 2075
- 476,740 · +87.6%
- By 2100
- 535,945 · +110.8%
Race, ethnicity, and origin ACS 2023
- Neighborhood character
- Diverse neighborhood (Simpson 0.56)
- Race & ethnicity
- White 62% Black 19% Two or more races 10% Hispanic / Latino 10% Asian 2%
- Hispanic origin (detail)
- Mexican 4% Puerto Rican 2%
- Common ancestry
- Lithuanian 4% Italian 2% Romanian 2%
- Foreign-born
- 5% · Canada, Jamaica
- Languages at home
- 91% English-only · Spanish 6% German/W. Germanic 1%
Political lean MEDSL · Berkeley
- 2024 margin
- R (+16.3) · D 41.1% · R 57.4% · Other 1.4%
- 2008→2024 swing
- -3.2pp toward R · 2008: -13.1pp · 2024: -16.3pp
- All cycles
- 2024: R+16.3 2020: R+11.7 2016: R+17.4 2012: R+18.9 2008: R+13.1
Not yet ingested
- Civics
- —
Market trends
- HPI YoY
- ▼ -52.74%
- Current HPI
- 285.0567
- Rent YoY
- ▲ 2.67%
- Metro
- Charleston-North Charleston, SC
- State GDP YoY
- ▲ 4.51%
- F500 in state
- 2
Industry mix (Fortune 500 HQ in SC)
| Industry | F500 HQs | Revenue |
|---|---|---|
| Packaging | 1 | $7B |
|
||
Price history
2 events — show timeline
- 2025-10-27 Pending — Charleston Trident MLS
- 2025-10-18 Listed $265,990 Charleston Trident MLS
Cash-flow waterfall
monthlySold comps — $/sqft
last 12 mo · ≤1 miLoading sold comps…