 Duplex
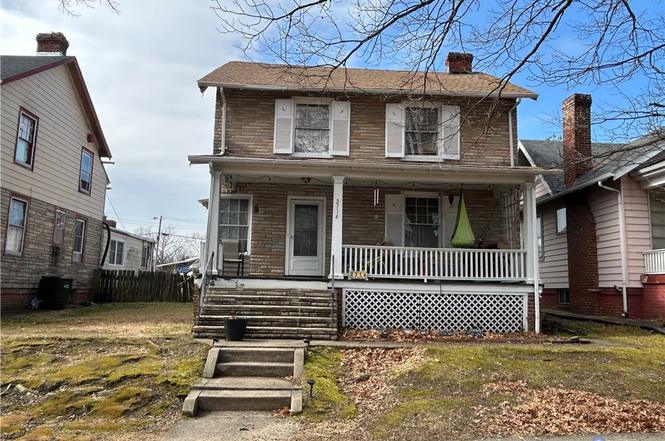
2714 Edgewood Ave · Richmond, VA
Flood risk 1/10 · Minimal
- FEMA flood zone
- X (unshaded)
- Chance of flooding over 30 yrs
- 0.0%
- Est. flood insurance / yr
- $473 – $860
Fire risk 1/10 · Minimal
- Est. fire insurance / yr
- $666 – $1,236
Heat risk 7/10 · Major
- Hot days now (above 105°F)
- 7 days/yr
- Hot days in 30 yrs
- 17 days/yr
Wind risk 6/10 · Moderate
- Chance of severe wind over 30 yrs
- 27.0%
Air-quality risk 2/10 · Minimal
- Unhealthy air days now
- 1 days/yr
- Unhealthy air days in 30 yrs
- 3 days/yr
Risk factors via First Street. Map © Google.
Why this score? — see what drove the B- grade
The composite is a weighted blend of 9 inputs, each scored 0–100. Each bar is that input's sub-score; the figure is the points it added to the 100-point composite (weight × sub-score).
- Cash flow +28.7/30.0
- DSCR +10.0/10.0
- ARV discount +7.5/15.0
- 1% rule +7.3/10.0
- Rent growth +4.4/5.0
- Livability +4.2/5.0
- Schools +3.3/10.0
- Condition / age +2.5/5.0
- Appreciation +0.0/10.0
$265,000
🖨 Deal sheet 📄 Offer letter ✓ Due diligence
Multi-family units
County records classify this as Multi-Family (2-4 Unit). Listing-text estimate: 2 units. confirmed
Listing remarks
Investor Special. Built in 1921, this converted duplex home offers tons of potential in the desirable Battery Park. Property is ready for renovation and restoration. Sold strictly as-is/where is. Lots of great revitalization in the area.
Key facts
- 6,751 sq ft lot
- Garage
- Built 1921
Neighborhood map
What this means for you Summary
Snapshot
- This is a 2 × 3-bed/2.0-bath units multifamily listed at $265k.
Deal economics
- At list price, monthly cash flow is $884 ($11k/yr) — positive. Per door: $442/mo.
- The deal already cash-flows at list — no discount required.
- Meets the 1% rule at list price ($3k rent vs $265k).
- Recommended offer: $257k (3.0% below list) — sets the bar for market timing.
- Cap rate 10.3% vs local median 3.3% in Richmond — top-decile yield for the area; either an underpriced asset or a hidden risk that comps aren't pricing in. Stress-test before assuming the spread holds.
Location & tenants
- Location reads 84/100 on livability (#33 in VA, #793 nationally) — a professional / high-income tenant draw. Strengths: amenities A+, commute A+, health & safety A+; Watch: crime D-.
- Richmond City Public School District (urban): math 32% / reading 47% proficiency, ranked #123 of 131 in VA (top 94%) — families likely to look elsewhere, expect single-tenant / working-renter base with shorter leases; 74% free/reduced lunch — lower-income household profile, screen leases tightly.
- Market conditions: Rents rising fast (+7.4%/yr); 179 active listings in the ZIP; 35 comparable units currently listed for rent nearby; rentals at typical pace (median 24d on market — plan ~3-4 weeks tenant-placement turnaround); 46% of comp listings sitting > 30 days — soft ceiling on asking rent; 2,540 units permitted in Richmond city in 2024 (2,077 in 5+ unit buildings).
- At $3,250/mo this rent would consume 64% of the median local household income ($61k/yr) (locally 1325% of renters already pay >50% of income on rent) — very limited rent-growth headroom before tenants either downsize or default.
Forward outlook
- Local home prices are declining (-3.0%/yr); year-one equity from $2k of loan paydown is wiped out by about $8k of value loss. Plan a longer hold.
- Richmond County population projected at +40% by 2050 — long-run rental-demand tailwind backs the buy-and-hold thesis.
- At projected returns (-3.0% appreciation + 7.4% rent growth), your $74k cash investment doubles in ~7 years — after that, you're playing with house money.
Negotiation context
- It's been on market 33 days — a 3% lower offer ($257k) is reasonable based on typical stale-listing flexibility.
- 2 sale attempts with the ask held roughly flat each time — persistent listings suggest the price (not the market) is what's stuck; bring a comps-based counter.
Risks & watch-outs
- Watch-outs: built in 1921 — expect roof / HVAC / electrical / plumbing capex.
- Climate carrying-cost: major wind risk, 27% chance of damaging wind over 30y; extreme-heat days projected 7→17/yr by 2055 (HVAC capex compounding) — expect insurance premiums to compound above CPI over the hold.
Questions for the listing agent
- It's been on market 33 days. Have you received any prior offers? Is the seller open to a 3% concession, seller financing, or rate buy-down credit?
- Can we see the unit-by-unit rent roll, current vacancy, and any below-market leases? What's the average tenancy length?
- What capital expenditures (roof, boiler, parking lot, exteriors) have been made in the last 5 years, and what's planned in the next 2?
- Built in 1921 — when were the roof, HVAC, electrical panel, plumbing, and water heater last replaced?
- Is there a deadline driving the sale (1031 exchange, divorce, estate, relocation)? That informs how much negotiation room exists.
- Schools are A-rated — typically a magnet for longer-tenancy family renters. What's the average tenant stay here, and is there a school-zone premium baked into asking?
- Crime grade is D in this area — have there been break-ins, vandalism, or insurance claims at this property in the last 3 years? What carrier currently insures it and at what premium?
- What's the average days-on-market for RENTAL listings here right now (not sales)? A rising rental-DOM trend means longer vacancies and softer asking-rent achievability than the comps imply.
- What's the recent tenant-quality profile in this submarket — average credit score on applications, eviction rate, late-payment / NSF rate, and stable-employment percentage? A property-management company in the area should have these aggregated.
- How much new apartment / multifamily construction is in the pipeline within 1–3 miles? Heavy new supply (>2% of stock underway) typically softens rents 12–24 months out; light construction supports rent growth.
Investment metrics
- 1% rule
- 1.23% ✓
- Cap rate
- 10.30%
- Cash-on-cash
- 14.30%
- DSCR
- 1.64
- GRM
- 6.8
CMA / ARV
- ARV (on-the-fly)
- $541,788
- Comps found
- 2
Show comp detail 2 sales within ~0.75 mi
| Address | Dist | Beds/Ba | Sqft | Sold | Price | $/sf | Match |
|---|---|---|---|---|---|---|---|
| 2714 Edgewood Ave | 0.00mi | 3/2.0 | 1,812 (0%) | 0mo | $255,000 | $141 | 100 |
| 3015 Moss Side Ave | 0.33mi | 4/3.0 (+1) | 1,889 (+4%) | 0mo | $565,000 | $299 | 68 |
Match score weights: distance 35% · size 25% · config 20% · recency 20%. Top-matched comps best support the ARV.
Projected returns pro-forma
-3.0% appreciation · 7.43% rent growth · sell at horizon
- IRR
- 9.3%
- Equity multiple
- 1.38×
- Total profit
- $28,476
- Equity at exit
- $39,512
- IRR
- 21.7%
- Equity multiple
- 3.23×
- Total profit
- $165,207
- Equity at exit
- $22,912
Cash invested: $74,200 (down + closing). Projections, not guarantees.
Landlord ↔ Tenant lean methodology
- Overall (STATE)
- 55 Moderately Landlord-Leaning
- State Virginia
- 55 Moderately Landlord-Leaning · D+2
- County
- — inherits STATE
- City
- — inherits STATE
ZIP-level market 23222
- Rents YoY
- 7.4%
- Active inventory
- 179
- Price-to-rent
- 13.6×
Monthly cashflow live
- Estimated rent
- $3,250 high interval (Pro) →
- Mortgage (P&I)
- −$1,390
- Tax from tax record
- −$183 /mo · $2,196/yr
- Insurance
- −$110
- HOA
- −$0
- Vacancy / Maint / Mgmt
- −$682
- Net cashflow
- $884
Break-even live
2-unit breakdown (identical units grouped — click to expand)
| Units | Beds | Baths | Est. rent |
|---|---|---|---|
| 2× units | 3 | 2 | $3,250 |
| #1 | 3 | 2 | $1,625 |
| #2 | 3 | 2 | $1,625 |
| Total (2 units) | $3,250 | ||
UW: 25.0% down · 7.5% · 30yr · 1.5% tax · 5.0% vac · 8.0% maint · 8.0% mgmt
Financing live
Cash to close
- Down payment
- $66,250
- Closing costs
- $7,950
- Reserves months
- —
- Total cash needed
- —
Loan-product check · same deal, 3 products live
Conventional
25% down · 7.5% · 30yr
- Down + closing
- —
- Monthly P&I
- —
- Monthly cashflow
- —
- DSCR
- —
- Eligible?
- —
Personal DTI + credit; lowest rate.
DSCR
20% down · 8.5% · 30yr
- Down + closing
- —
- Monthly P&I
- —
- Monthly cashflow
- —
- DSCR
- —
- Eligible?
- —
No personal income docs; deal must DSCR.
Hard money
10% down · 12.0% · 12mo
- Down + closing
- —
- Monthly P&I
- —
- Monthly cashflow
- —
- DSCR
- —
- Eligible?
- —
Short-term bridge; refi at stabilization.
Rent comps 35 comps
| Address | Beds | Baths | Sqft | Rent | $/sqft | DOM | Units | Dist |
|---|---|---|---|---|---|---|---|---|
| 2807 Edgewood Ave Richmond, VA | 3.0 | 1.0 | 1320 | $1,750 | $1.33 | 43d | 1 | 0.09mi |
| 3007 Moss Side Ave Richmond, VA | 3.0 | 2.5 | 1772 | $2,495 | $1.41 | 23d | 1 | 0.32mi |
| 2701 Northumberland Ave Richmond, VA | 3.0 | 3.0 | 2310 | $2,630 | $1.14 | 4d | 1 | 0.46mi |
| 3204 North Ave Richmond, VA | 3.0 | 2.5 | 1626 | $2,395 | $1.47 | 4d | 1 | 0.60mi |
| 207 Welford St Richmond, VA | 3.0 | 1.5 | 1348 | $1,850 | $1.37 | 23d | 1 | 0.79mi |
| 1801 Monteiro Ave Unit 1 Richmond, VA | 2.0 | 2.0 | 1500 | $1,550 | $1.03 | 4d | 1 | 0.82mi |
| 3200 Brook Rd Richmond, VA | 1.0–2.0 | 1.0–2.5 | 968 | $2,633 | $2.72 | 2d | 20 | 0.84mi |
| 3311 Cliff Ave Richmond, VA | 2.0 | 1.5 | 1567 | $2,000 | $1.28 | 43d | 1 | 0.88mi |
| 2435 Ownby Ln Richmond, VA | 3.0 | 2.5 | 2516 | $3,500 | $1.39 | 43d | 1 | 0.98mi |
| 1500 W Moore St Unit B Richmond, VA | 3.0 | 2.5 | 2500 | $3,700 | $1.48 | 43d | 1 | 0.99mi |
| 2402 Ownby Ln Richmond, VA | 3.0 | 2.5 | 2253 | $3,488 | $1.55 | 1d | 4 | 1.03mi |
| 1013 N Lombardy St Unit B Richmond, VA | 3.0 | 2.5 | 2460 | $3,030 | $1.23 | 43d | 1 | 1.06mi |
| 1601 Overbrook Rd Richmond, VA | 1.0–3.0 | 1.0–2.0 | 922 | $3,172 | $3.44 | 1d | 25 | 1.09mi |
| 1417 W Leigh St Richmond, VA | 4.0 | 3.0 | 1512 | $2,600 | $1.72 | 43d | 1 | 1.10mi |
| 3211 Maryland Ave Richmond, VA | 4.0 | 1.5 | 1344 | $1,871 | $1.39 | 43d | 1 | 1.15mi |
| 3324 Meadowbridge Rd Richmond, VA | 4.0 | 2.5 | 1667 | $2,175 | $1.30 | 17d | 1 | 1.16mi |
| 900 N Allen Ave Richmond, VA | 1.0–3.0 | 1.0–3.0 | 1286 | $3,800 | $2.95 | 1d | 30 | 1.16mi |
| 800 Catherine St Richmond, VA | 4.0 | 2.5 | 1251 | $2,062 | $1.65 | 43d | 1 | 1.17mi |
| 800 W Clay St Unit A Richmond, VA | 2.0 | 1.0 | 1475 | $1,650 | $1.12 | 43d | 1 | 1.21mi |
| 3202 1st Ave Richmond, VA | 3.0 | 2.5 | 1440 | $2,062 | $1.43 | 21d | 1 | 1.24mi |
| 1128 W Marshall St Richmond, VA | 4.0 | 3.0 | 1658 | $3,000 | $1.81 | 23d | 1 | 1.25mi |
| 3501 Meadowbridge Rd Richmond, VA | 3.0 | 1.0 | 1383 | $1,495 | $1.08 | 23d | 1 | 1.25mi |
| 3501 Meadowbridge Rd Richmond, VA | 3.0 | 1.0 | 1383 | $1,495 | $1.08 | 19d | 1 | 1.25mi |
| 1128 W Marshall St Unit Na Richmond, VA | 4.0 | 3.0 | 1658 | $3,000 | $1.81 | 43d | 1 | 1.25mi |
| 3007 3rd Ave Richmond, VA | 3.0 | 3.0 | 2036 | $2,295 | $1.13 | 43d | 1 | 1.25mi |
| 724 N 1st St Richmond, VA | 3.0 | 2.5 | 1704 | $3,000 | $1.76 | 43d | 1 | 1.27mi |
| 3017 Dill Ave Richmond, VA | 4.0 | 2.0 | 1578 | $1,895 | $1.20 | 3d | 1 | 1.28mi |
| 3103 Dill Ave Richmond, VA | 3.0 | 1.5 | 1380 | $2,050 | $1.49 | 23d | 1 | 1.34mi |
| 412 W Marshall St Richmond, VA | 3.0 | 2.0 | 1650 | $2,375 | $1.44 | 14d | 1 | 1.35mi |
| 209 W Clay St Richmond, VA | 2.0 | 1.5 | 2375 | $2,800 | $1.18 | 43d | 1 | 1.36mi |
| 3425 Carolina Ave Unit A Richmond, VA | 3.0 | 1.0 | 1300 | $1,400 | $1.08 | 43d | 1 | 1.39mi |
| 3425 Carolina Ave Unit B Richmond, VA | 3.0 | 1.0 | 1300 | $1,400 | $1.08 | 23d | 1 | 1.40mi |
| 3615 Missouri Ave Richmond, VA | 3.0 | 2.0 | 1758 | $2,150 | $1.22 | 43d | 1 | 1.44mi |
| 1103 W Franklin St Unit A Richmond, VA | 3.0 | 1.5 | 1250 | $1,695 | $1.36 | 23d | 1 | 1.49mi |
| 2034 W Grace St Unit A Richmond, VA | 4.0 | 2.0 | 2450 | $2,950 | $1.20 | 43d | 1 | 1.50mi |
Listing history 4 events
-
2026-04-08status Pending
-
2026-03-18status Active
-
2026-03-12status Pending
-
2026-02-27$265,000 Active
ⓘ Source: listings_history table (triggers on properties + properties_extension) + one-shot
backfill from property_details.listing_events for pre-trigger history.
Tax reassessment forecast VA · Resets to sale price
- Current annual tax
- $2,196 · $183/mo
- Projected year-2 tax
- $2,196 · $183/mo
- Expected delta
- $0/yr ($0/mo · 0.0%)
ⓘ Screening estimate from a state-policy table — verify with the county assessor before closing.
Climate risk First Street
- Flood 1/10 Low FEMA zone X (unshaded) · 0% chance over 30 yrs
- Wildfire 1/10 Low
- Heat 7/10 Severe 7 d/yr ≥105°F today · 17 d/yr by 30 yrs out
- Wind 6/10 Major 27% chance of damaging wind over 30 yrs
- Air quality 2/10 Low 1 unhealthy d/yr today · 3 by 30 yrs out
Nearby sold comps map
Loading sold comps map…
Walkable amenities ~0.75 mi
Loading nearby amenities…
Taxation est. · year 1
- Rental income
- $39,000
- − Mortgage interest
- −$14,844
- − Property taxes
- −$2,196
- − Insurance
- −$1,325
- − Repairs & maintenance
- −$3,120
- − Management
- −$3,120
- − Depreciation
- −$7,709
- Taxable income
- $6,686
- Est. tax owed @ 24.0%
- −$1,605
- After-tax cash flow
- $9,008/yr
For passive investors: Depreciation is non-cash, so a rental often shows a tax loss while cash-flowing — sheltering income. Rental losses are passive: they offset passive income freely, and up to $25,000/yr can offset ordinary (W-2) income if you actively participate and your MAGI is under $100k (phasing out to $0 by $150k); unused losses carry forward. On sale, claimed depreciation is recaptured at up to 25%, and gains may owe capital-gains tax (a 1031 exchange can defer both). Figures are a year-1 estimate at your 24.0% rate — not tax advice; consult a CPA.
Schools (NCES district)
- District
- Richmond City Public School District
- NCES district ID
- 5103240
- Math proficiency
- 32% ▼ -24.00%
- Reading proficiency
- 47% ▼ -9.00%
- Median HH income
- $40,276
- Composite
- 33.09/100
- National rank
- #5564
- State rank
- #123 of 131 in VA
Livability — Richmond
- Score
- 84/100
- State rank
- #33
- US rank
- #793
Category grades
Schools grade is shown separately in the Schools card above.
Census & demographics
- Census place
- Richmond, VA
- County
- Richmond City · 178,280 people
- City population
- 287,109
- Metro
- Richmond, VA
- Population (ZIP)
- 26,322
- Household income
- $61,345
- Rent vs Own
- Severe rent burden
- 1325.0
Population outlook (Richmond County) Hauer SSP2
- Today (2025)
- 262,263 people
- By 2030
- 284,503 · +8.5%
- By 2040
- 327,353 · +24.8%
- By 2050
- 367,946 · +40.3%
- By 2075
- 449,560 · +71.4%
- By 2100
- 500,301 · +90.8%
Race, ethnicity, and origin ACS 2023
- Neighborhood character
- Predominantly Black (70%)
- Race & ethnicity
- Black 70% White 21% Two or more races 4% Hispanic / Latino 3% Asian 2%
- Common ancestry
- Lithuanian 1% Italian 1% Serbian 1%
- Foreign-born
- 5% · Canada
- Languages at home
- 95% English-only · Spanish 2% Other Indo-European 1%
Political lean MEDSL · Richmond
- 2024 margin
- Solid D (+66.3) · D 82.0% · R 15.8% · Other 2.2%
- 2008→2024 swing
- +7.2pp toward D · 2008: 59.1pp · 2024: 66.3pp
- All cycles
- 2024: D+66.3 2020: D+68.0 2016: D+63.8 2012: D+55.7 2008: D+59.1
Not yet ingested
- Civics
- —
Market trends
- HPI YoY
- ▼ -288.72%
- Current HPI
- 428.4029
- Rent YoY
- ▲ 7.43%
- Metro
- Richmond, VA
- State GDP YoY
- ▲ 2.40%
- F500 in state
- 50
Industry mix (Fortune 500 HQ in VA)
| Industry | F500 HQs | Revenue |
|---|---|---|
| Aerospace / Defense | 4 | $236B |
|
||
| Technology / Defense | 3 | $32B |
|
||
| Financial Services | 2 | $176B |
|
||
| Utilities | 2 | $27B |
|
||
| Insurance | 2 | $25B |
|
||
| Technology | 2 | $15B |
|
||
Price history
4 events — show timeline
- 2026-04-08 Pending — CVRMLS
- 2026-03-18 Relisted — CVRMLS
- 2026-03-12 Pending — CVRMLS
- 2026-02-27 Listed $265,000 CVRMLS
Property tax history
-2.5%/yrLatest (2022): $2,196 · -22.4% YoY. Source: county tax records.
Cash-flow waterfall
monthlySold comps — $/sqft
last 12 mo · ≤1 miLoading sold comps…