 Triplex
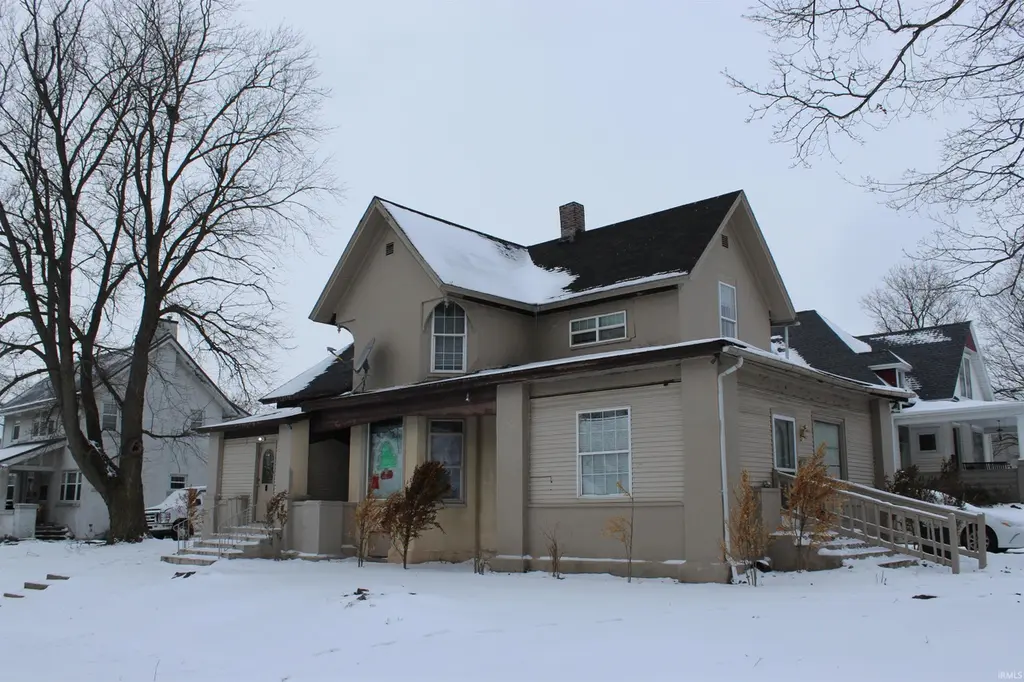
403 N Main St St · Kendallville, IN
Flood risk 1/10 · Minimal
- FEMA flood zone
- X (unshaded)
- Chance of flooding over 30 yrs
- 0.0%
- Est. flood insurance / yr
- $507 – $1,088
Fire risk 1/10 · Minimal
- Est. fire insurance / yr
- $717 – $1,331
Heat risk 3/10 · Minor
- Hot days now (above 99°F)
- 7 days/yr
- Hot days in 30 yrs
- 16 days/yr
Wind risk 2/10 · Minimal
- Chance of severe wind over 30 yrs
- —
Air-quality risk 2/10 · Minimal
- Unhealthy air days now
- 1 days/yr
- Unhealthy air days in 30 yrs
- 1 days/yr
Risk factors via First Street. Map © Google.
Why this score? — see what drove the C grade
The composite is a weighted blend of 9 inputs, each scored 0–100. Each bar is that input's sub-score; the figure is the points it added to the 100-point composite (weight × sub-score).
- Cash flow +27.3/30.0
- DSCR +9.5/10.0
- 1% rule +8.0/10.0
- Livability +3.3/5.0
- Schools +2.8/10.0
- Rent growth +2.5/5.0
- Condition / age +2.5/5.0
- ARV discount +0.0/15.0
- Appreciation +0.0/10.0
$229,000
🖨 Deal sheet 📄 Offer letter ✓ Due diligence
Multi-family units
County records classify this as Multi-Family (2-4 Unit). Listing-text estimate: 3 units. confirmed
Listing remarks MLS
Triplex on corner lot with off street parking. Tenant pays electric. Seller pays water-sewer & garbage.
Key facts
- Off street parking
- Corner lot
- 8,052 sq ft lot
Tags
Neighborhood map
What this means for you Summary
Snapshot
- This is a 3 × 2-bed/1.0-bath units multifamily listed at $229k.
Deal economics
- At list price, monthly cash flow is $661 ($8k/yr) — positive. Per door: $220/mo.
- The deal already cash-flows at list — no discount required.
- Meets the 1% rule at list price ($3k rent vs $229k).
- Recommended offer: $202k (12.0% below list) — sets the bar for market timing.
- Cap rate 9.8% vs local median 3.6% in Kendallville — top-decile yield for the area; either an underpriced asset or a hidden risk that comps aren't pricing in. Stress-test before assuming the spread holds.
Location & tenants
- Location reads 66/100 on livability (#305 in IN) — a middle-class / working-renter tenant base. Strengths: cost of living A+, housing A+, crime A-; Watch: employment D+, schools D, amenities F.
- East Noble School Corporation (town): math 32% / reading 32% proficiency, ranked #216 of 301 in IN (top 72%) — families likely to look elsewhere, expect single-tenant / working-renter base with shorter leases.
- Market conditions: 103 active listings in the ZIP; 131 units permitted in Noble County in 2024 (0 in 5+ unit buildings).
Forward outlook
- Local home prices are declining (-3.0%/yr); year-one equity from $2k of loan paydown is wiped out by about $7k of value loss. Plan a longer hold.
- Noble County population projected to shrink 8% by 2050 — rents likely to lag national; underwrite the cash flow, not the appreciation.
- At projected returns (-3.0% appreciation + 3.0% rent growth), your $64k cash investment doubles in ~10 years — after that, you're playing with house money.
Negotiation context
- It's been on market 166 days — a 12% lower offer ($202k) is reasonable based on typical stale-listing flexibility.
- 3 sale attempts since 2y ago with the ask held roughly flat each time — persistent listings suggest the price (not the market) is what's stuck; bring a comps-based counter.
Risks & watch-outs
- Watch-outs: built in 1910 — expect roof / HVAC / electrical / plumbing capex.
Questions for the listing agent
- It's been on market 166 days. Have you received any prior offers? Is the seller open to a 12% concession, seller financing, or rate buy-down credit?
- Can we see the unit-by-unit rent roll, current vacancy, and any below-market leases? What's the average tenancy length?
- What capital expenditures (roof, boiler, parking lot, exteriors) have been made in the last 5 years, and what's planned in the next 2?
- Built in 1910 — when were the roof, HVAC, electrical panel, plumbing, and water heater last replaced?
- Why hasn't it sold? Are there any deal-killer items the seller is aware of (foundation, flood, title, zoning, code violations)?
- Is there a deadline driving the sale (1031 exchange, divorce, estate, relocation)? That informs how much negotiation room exists.
- Schools are D-rated, which usually means shorter tenancies and higher turnover. Who's the typical renter profile here, and what's been the actual vacancy rate?
- What's the average days-on-market for RENTAL listings here right now (not sales)? A rising rental-DOM trend means longer vacancies and softer asking-rent achievability than the comps imply.
- What's the recent tenant-quality profile in this submarket — average credit score on applications, eviction rate, late-payment / NSF rate, and stable-employment percentage? A property-management company in the area should have these aggregated.
- How much new apartment / multifamily construction is in the pipeline within 1–3 miles? Heavy new supply (>2% of stock underway) typically softens rents 12–24 months out; light construction supports rent growth.
Investment metrics
- 1% rule
- 1.30% ✓
- Cap rate
- 9.76%
- Cash-on-cash
- 12.37%
- DSCR
- 1.55
- GRM
- 6.4
CMA / ARV
- ARV (median comp)
- $170,467
- List price
- $229,000
- Delta
- 34.34%
- Verdict
- OVERPRICED
- Comps
- 12 within 1.0 mi
Projected returns pro-forma
-3.0% appreciation · 3.0% rent growth · sell at horizon
- IRR
- 2.1%
- Equity multiple
- 1.08×
- Total profit
- $5,109
- Equity at exit
- $34,145
- IRR
- 11.7%
- Equity multiple
- 1.92×
- Total profit
- $59,135
- Equity at exit
- $19,800
Cash invested: $64,120 (down + closing). Projections, not guarantees.
Landlord ↔ Tenant lean methodology
- Overall (STATE)
- 90 Strongly Landlord-Friendly
- State Indiana
- 90 Strongly Landlord-Friendly · R+11
- County
- — inherits STATE
- City
- — inherits STATE
ZIP-level market 46755
- Home prices YoY
- -12.8%
- Active inventory
- 103
- Price-to-rent
- 19.2×
Monthly cashflow live
- Estimated rent
- $2,988 high interval (Pro) →
- Mortgage (P&I)
- −$1,201
- Tax from tax record
- −$403 /mo · $4,838/yr
- Insurance
- −$95
- HOA
- −$0
- Vacancy / Maint / Mgmt
- −$627
- Net cashflow
- $661
Break-even live
3-unit breakdown (identical units grouped — click to expand)
| Units | Beds | Baths | Est. rent |
|---|---|---|---|
| 3× units | 2 | 1 | $2,988 |
| #1 | 2 | 1 | $996 |
| #2 | 2 | 1 | $996 |
| #3 | 2 | 1 | $996 |
| Total (3 units) | $2,988 | ||
UW: 25.0% down · 7.5% · 30yr · 1.5% tax · 5.0% vac · 8.0% maint · 8.0% mgmt
Financing live
Cash to close
- Down payment
- $57,250
- Closing costs
- $6,870
- Reserves months
- —
- Total cash needed
- —
Loan-product check · same deal, 3 products live
Conventional
25% down · 7.5% · 30yr
- Down + closing
- —
- Monthly P&I
- —
- Monthly cashflow
- —
- DSCR
- —
- Eligible?
- —
Personal DTI + credit; lowest rate.
DSCR
20% down · 8.5% · 30yr
- Down + closing
- —
- Monthly P&I
- —
- Monthly cashflow
- —
- DSCR
- —
- Eligible?
- —
No personal income docs; deal must DSCR.
Hard money
10% down · 12.0% · 12mo
- Down + closing
- —
- Monthly P&I
- —
- Monthly cashflow
- —
- DSCR
- —
- Eligible?
- —
Short-term bridge; refi at stabilization.
Listing history 19 events
-
2026-06-18days on market $229,000 Active 166 DOM
-
2026-06-17days on market $229,000 Active 165 DOM
-
2026-06-16days on market $229,000 Active 164 DOM
-
2026-06-15days on market $229,000 Active 163 DOM
-
2026-06-13days on market $229,000 Active 161 DOM
-
2026-06-12days on market $229,000 Active 160 DOM
-
2026-06-09days on market $229,000 Active 157 DOM
-
2026-06-08days on market $229,000 Active 156 DOM
-
2026-06-07days on market $229,000 Active 155 DOM
-
2026-06-04days on market $229,000 Active 151 DOM
-
2026-06-02days on market $229,000 Active 150 DOM
-
2026-06-01days on market $229,000 Active 149 DOM
-
2026-05-31days on market $229,000 Active 148 DOM
-
2026-05-31days on market $229,000 Active 147 DOM
-
2026-01-03$229,000 Active 109-char remark
Show marketing remark (109 chars)
Triplex on corner lot with off street parking. Tenant pays electric. Seller pays water-sewer & garbage.
-
2025-04-08price $205,000
-
2025-02-12$215,000 Active
-
2024-04-30price $209,000
-
2024-04-04$219,000 Active
ⓘ Source: listings_history table (triggers on properties + properties_extension) + one-shot
backfill from property_details.listing_events for pre-trigger history.
Tax reassessment forecast IN · Partial reset (capped growth)
- Current annual tax
- $4,838 · $403/mo
- Projected year-2 tax
- $4,838 · $403/mo
- Expected delta
- $0/yr ($0/mo · 0.0%)
ⓘ Screening estimate from a state-policy table — verify with the county assessor before closing.
Climate risk First Street
- Flood 1/10 Low FEMA zone X (unshaded) · 0% chance over 30 yrs
- Wildfire 1/10 Low
- Heat 3/10 Moderate 7 d/yr ≥99°F today · 16 d/yr by 30 yrs out
- Wind 2/10 Low
- Air quality 2/10 Low 1 unhealthy d/yr today · 1 by 30 yrs out
Nearby sold comps map
Loading sold comps map…
Walkable amenities ~0.75 mi
Loading nearby amenities…
Taxation est. · year 1
- Rental income
- $35,856
- − Mortgage interest
- −$12,828
- − Property taxes
- −$4,838
- − Insurance
- −$1,145
- − Repairs & maintenance
- −$2,868
- − Management
- −$2,868
- − Depreciation
- −$6,662
- Taxable income
- $4,646
- Est. tax owed @ 24.0%
- −$1,115
- After-tax cash flow
- $6,817/yr
For passive investors: Depreciation is non-cash, so a rental often shows a tax loss while cash-flowing — sheltering income. Rental losses are passive: they offset passive income freely, and up to $25,000/yr can offset ordinary (W-2) income if you actively participate and your MAGI is under $100k (phasing out to $0 by $150k); unused losses carry forward. On sale, claimed depreciation is recaptured at up to 25%, and gains may owe capital-gains tax (a 1031 exchange can defer both). Figures are a year-1 estimate at your 24.0% rate — not tax advice; consult a CPA.
Schools (NCES district)
- District
- East Noble School Corporation
- NCES district ID
- 1802970
- Math proficiency
- 32% ▼ -8.00%
- Reading proficiency
- 32% ▼ -8.00%
- Median HH income
- $47,954
- Composite
- 27.67/100
- National rank
- #6916
- State rank
- #216 of 301 in IN
Livability — Kendallville
- Score
- 66/100
- State rank
- #305
- US rank
- #12100
Category grades
Schools grade is shown separately in the Schools card above.
Census & demographics
- Census place
- Kendallville, IN
- City population
- 15,528
- Population (ZIP)
- 15,528
Population outlook (Noble County) Hauer SSP2
- Today (2025)
- 48,321 people
- By 2030
- 47,945 · -0.8%
- By 2040
- 46,521 · -3.7%
- By 2050
- 44,501 · -7.9%
- By 2075
- 38,962 · -19.4%
- By 2100
- 31,846 · -34.1%
Race, ethnicity, and origin ACS 2023
- Neighborhood character
- Predominantly White (88%)
- Race & ethnicity
- White 88% Hispanic / Latino 8% Two or more races 6% Asian 1%
- Hispanic origin (detail)
- Mexican 6%
- Common ancestry
- Italian 11% Romanian 4% Lithuanian 2%
- Foreign-born
- 7% · Canada, Vietnam
- Languages at home
- 90% English-only · Spanish 5% Arabic 4%
Political lean MEDSL · Noble
- 2024 margin
- Solid R (+51.4) · D 23.5% · R 74.9% · Other 1.5%
- 2008→2024 swing
- -36.0pp toward R · 2008: -15.4pp · 2024: -51.4pp
- All cycles
- 2024: R+51.4 2020: R+49.7 2016: R+49.1 2012: R+33.6 2008: R+15.4
Not yet ingested
- Civics
- —
Market trends
- HPI YoY
- ▼ -36.00%
- Current HPI
- 245.3292
- Rent YoY
- —
- Metro
- —
- State GDP YoY
- ▲ 2.90%
- F500 in state
- 18
Industry mix (Fortune 500 HQ in IN)
| Industry | F500 HQs | Revenue |
|---|---|---|
| Industrial Machinery | 2 | $37B |
|
||
| Healthcare | 1 | $177B |
|
||
| Pharmaceuticals | 1 | $45B |
|
||
| Metals / Steel | 1 | $18B |
|
||
| Agriculture | 1 | $17B |
|
||
| Packaging | 1 | $12B |
|
||
Price history
+4.6% since first listed5 events — show timeline
- 2026-01-03 Listed $229,000 IRMLS
- 2025-04-08 Price Changed $205,000 IRMLS
- 2025-02-12 Listed $215,000 IRMLS
- 2024-04-30 Price Changed $209,000 IRMLS
- 2024-04-04 Listed $219,000 IRMLS
Property tax history
+2.0%/yrLatest (2024): $4,838 · +13.8% YoY. Source: county tax records.
Cash-flow waterfall
monthlySold comps — $/sqft
last 12 mo · ≤1 miLoading sold comps…