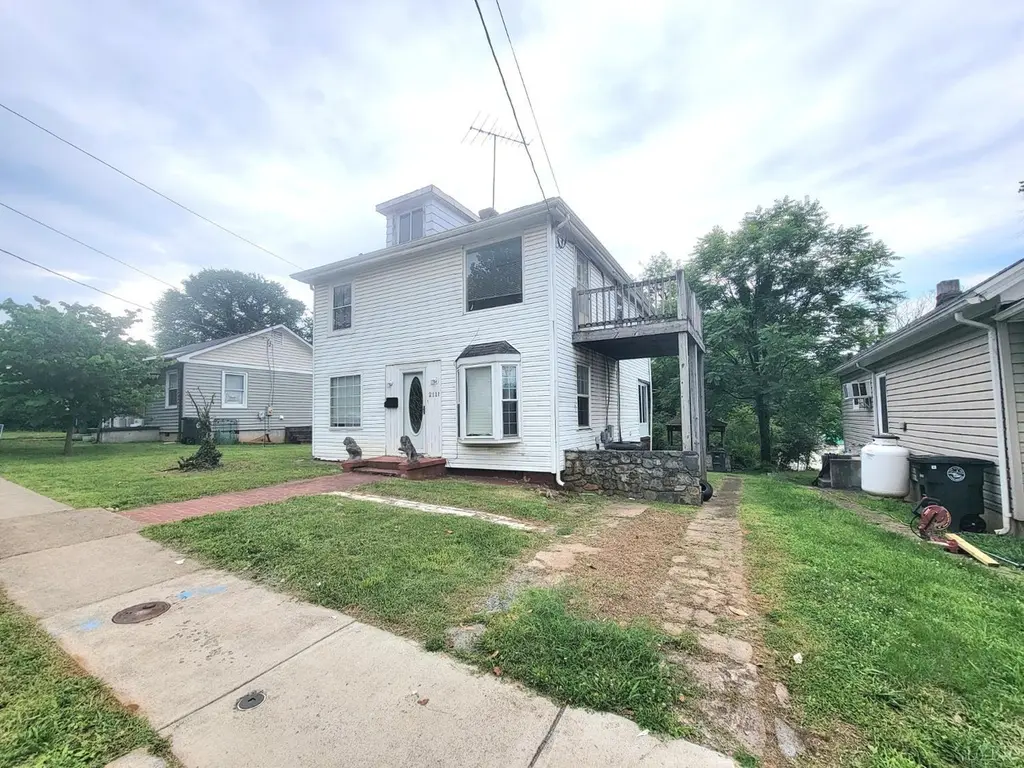
2111 Bedford Ave · Lynchburg, VA
Flood risk 1/10 · Minimal
- FEMA flood zone
- X (unshaded)
- Chance of flooding over 30 yrs
- 0.0%
- Est. flood insurance / yr
- $507 – $1,088
Fire risk 1/10 · Minimal
- Est. fire insurance / yr
- $666 – $1,236
Heat risk 6/10 · Moderate
- Hot days now (above 102°F)
- 7 days/yr
- Hot days in 30 yrs
- 19 days/yr
Wind risk 2/10 · Minimal
- Chance of severe wind over 30 yrs
- 2.0%
Air-quality risk 2/10 · Minimal
- Unhealthy air days now
- 0 days/yr
- Unhealthy air days in 30 yrs
- 1 days/yr
Risk factors via First Street. Map © Google.
Why this score? — see what drove the C+ grade
The composite is a weighted blend of 9 inputs, each scored 0–100. Each bar is that input's sub-score; the figure is the points it added to the 100-point composite (weight × sub-score).
- Cash flow +21.3/30.0
- ARV discount +15.0/15.0
- DSCR +6.8/10.0
- 1% rule +4.5/10.0
- Livability +4.5/5.0
- Schools +4.0/10.0
- Rent growth +2.5/5.0
- Condition / age +2.5/5.0
- Appreciation +0.0/10.0
$159,900
🖨 Deal sheet 📄 Offer letter ✓ Due diligence
Listing remarks
This 3BR/2BA home awaits the next owner. After being used as a long term investment property, home is ready to either continue being a rental, or would be a heck of an investment property to hold or flip! This home offers a two-zone heat pump, 200 amp electrical, & a kitchen that has been updated within the last 3 years, off-street parking, plenty of backyard space, & much more! Main level offers an over-sized living room, separate dining area with a kitchen off of it, as well as a pantry/storage area, a full bathroom, & a separate laundry room. The 2nd level offers a large master bedroom with it's own private patio. Two additional bedrooms, & another full bathroom. Home
Key facts
- 200 amp electrical
- Private patio
- Updated kitchen
Tags
Property features AI
Exterior
- Parking: Off-street parking
- Security: Smoke detector(s)
- Utilities: Public water; Public sewer; Cable available
- Home design: Single family residence; 2 stories
- Construction: Vinyl siding; Shingle roof; Crawl space foundation; Built area above grade: 1,550
- Exterior features: Garden; Deck; Patio; Porch; Storm doors; Exterior storage
Interior
- Kitchen: Dishwasher; Electric range; Refrigerator; Microwave; Oven
- Flooring: Ceramic tile; Concrete; Laminate; Vinyl
- Bathrooms: 2 full bathrooms
- Heating & cooling: Heat pump; Zoned heating; Zoned cooling
- Interior features: Pantry; Smoke detectors
- Laundry & utility: Main level laundry room; Washer hookup; Electric water heater
Neighborhood map
What this means for you Summary
Snapshot
- This is a 3-bed/2.0-bath single-family listed at $160k.
Deal economics
- At list price, monthly cash flow is $235 ($3k/yr) — positive.
- The deal already cash-flows at list — no discount required.
- To meet the 1% rule (rent ≥ 1% of price), the offer needs to be $152k (4.7% below list).
- Recommended offer: $152k (4.7% below list) — sets the bar for 1% rule.
- Cap rate 8.1% vs local median 4.0% in Lynchburg — top-decile yield for the area; either an underpriced asset or a hidden risk that comps aren't pricing in. Stress-test before assuming the spread holds.
Location & tenants
- Location reads 91/100 on livability (#1 in VA, #58 nationally) — a professional / high-income tenant draw. Strengths: amenities A+, commute A+, cost of living A+; Watch: crime C-, employment D+.
- Lynchburg City Public School District (urban): math 36% / reading 61% proficiency, ranked #104 of 131 in VA (top 79%) — families likely to look elsewhere, expect single-tenant / working-renter base with shorter leases; 61% free/reduced lunch — lower-income household profile, screen leases tightly.
- Zoned schools: Paul Munro Elementary (math 72% / reading 82%, grade A, #171 of 1,108 statewide, top 17%, 369 students, 98% FRL); Linkhorne Middle (math 36% / reading 64%, grade C, #231 of 342 statewide, top 69%, 586 students, 95% FRL); E.C. Glass High (math 42% / reading 84%, grade B-, #223 of 319 statewide, top 70%, 1,325 students, 92% FRL) — zoned schools average 95% FRL vs 61% district-wide (34 pts higher); higher-poverty schools than district average — tighter screening recommended.
- Zoned-school proficiency averages 63% at this address vs 48% district-wide (+15 pts) — the actual schools serving this property are materially stronger than the Lynchburg City Public School District average implies; a family-tenant draw the district grade alone would hide.
- Market conditions: 174 active listings in the ZIP; 10 comparable units currently listed for rent nearby; rentals at typical pace (median 21d on market — plan ~3-4 weeks tenant-placement turnaround); solid renter incomes; 472 units permitted in Lynchburg city in 2024 (240 in 5+ unit buildings).
Forward outlook
- Local home prices are declining (-3.0%/yr); year-one equity from $1k of loan paydown is wiped out by about $5k of value loss. Plan a longer hold.
- Lynchburg County population projected at +37% by 2050 — long-run rental-demand tailwind backs the buy-and-hold thesis.
Negotiation context
- It's been on market 17 days — a 2% lower offer ($158k) is reasonable based on typical stale-listing flexibility.
- 2 sale attempts since 9y ago with the ask held roughly flat each time — persistent listings suggest the price (not the market) is what's stuck; bring a comps-based counter.
- Current owner paid $30k; list at $160k implies a 435% gain — meaningful room to come down on a strong offer.
Risks & watch-outs
- Watch-outs: built in 1929 — expect roof / HVAC / electrical / plumbing capex.
- Climate carrying-cost: extreme-heat days projected 7→19/yr by 2055 (HVAC capex compounding) — expect insurance premiums to compound above CPI over the hold.
Questions for the listing agent
- Built in 1929 — when were the roof, HVAC, electrical panel, plumbing, and water heater last replaced?
- Is there a deadline driving the sale (1031 exchange, divorce, estate, relocation)? That informs how much negotiation room exists.
- Schools are A-rated — typically a magnet for longer-tenancy family renters. What's the average tenant stay here, and is there a school-zone premium baked into asking?
- What's the average days-on-market for RENTAL listings here right now (not sales)? A rising rental-DOM trend means longer vacancies and softer asking-rent achievability than the comps imply.
- What's the recent tenant-quality profile in this submarket — average credit score on applications, eviction rate, late-payment / NSF rate, and stable-employment percentage? A property-management company in the area should have these aggregated.
- How much new for-sale + rental construction is in the pipeline within 1–3 miles? Heavy new supply typically softens prices + rents 12–24 months out; constrained supply supports both.
Investment metrics
- 1% rule
- 0.95% ✗
- Cap rate
- 8.05%
- Cash-on-cash
- 6.29%
- DSCR
- 1.28
- GRM
- 8.7
CMA / ARV
- ARV (on-the-fly)
- $214,480
- Comps found
- 12
Show comp detail 12 sales within ~0.75 mi
| Address | Dist | Beds/Ba | Sqft | Sold | Price | $/sf | Match |
|---|---|---|---|---|---|---|---|
| 315 Cork St. St | 0.12mi | 3/2.0 | 1,477 (-4%) | 8mo | $311,550 | $211 | 82 |
| 539 Elmwood Ave | 0.34mi | 3/2.0 | 1,485 (-3%) | 4mo | $269,000 | $181 | 75 |
| 1340 Bedford Ave | 0.50mi | 3/2.0 | 1,500 (-2%) | 2mo | $209,900 | $140 | 71 |
| 1614 Early St | 0.35mi | 3/2.0 | 1,645 (+7%) | 5mo | $150,000 | $91 | 67 |
| 1720 Monsview Pl | 0.30mi | 3/2.0 | 1,341 (-12%) | 11mo | $35,000 | $26 | 56 |
| 1019 Dearing St | 0.72mi | 3/1.5 | 1,591 (+4%) | 3mo | $70,000 | $44 | 56 |
| 1344 Bedford Ave | 0.49mi | 4/2.0 (+1) | 1,675 (+9%) | 2mo | $223,000 | $133 | 54 |
| 1109 Dearing St | 0.69mi | 3/2.0 | 1,582 (+3%) | 12mo | $199,900 | $126 | 52 |
| 1455 Yancey St | 0.57mi | 3/2.0 | 1,744 (+14%) | 2mo | $245,000 | $140 | 49 |
| 228 Arlington St | 0.54mi | 3/1.0 | 1,385 (-10%) | 10mo | $244,000 | $176 | 46 |
| 309 Warwick Ln | 0.63mi | 4/2.0 (+1) | 1,689 (+10%) | 11mo | $340,000 | $201 | 40 |
| 313 Arlington St | 0.61mi | 2/1.0 (-1) | 1,343 (-12%) | 7mo | $245,000 | $182 | 36 |
Match score weights: distance 35% · size 25% · config 20% · recency 20%. Top-matched comps best support the ARV.
Projected returns pro-forma
-3.0% appreciation · 3.0% rent growth · sell at horizon
- IRR
- -6.7%
- Equity multiple
- 0.75×
- Total profit
- $-11,033
- Equity at exit
- $23,842
- IRR
- 2.9%
- Equity multiple
- 1.21×
- Total profit
- $9,382
- Equity at exit
- $13,825
Cash invested: $44,772 (down + closing). Projections, not guarantees.
Landlord ↔ Tenant lean methodology
- Overall (STATE)
- 55 Moderately Landlord-Leaning
- State Virginia
- 55 Moderately Landlord-Leaning · D+2
- County
- — inherits STATE
- City
- — inherits STATE
ZIP-level market 24503
- Active inventory
- 174
- Price-to-rent
- 8.7×
Monthly cashflow live
- Estimated rent
- $1,524 high interval (Pro) →
- Mortgage (P&I)
- −$839
- Tax from tax record
- −$65 /mo · $775/yr
- Insurance
- −$67
- HOA
- −$0
- Vacancy / Maint / Mgmt
- −$320
- Net cashflow
- $235
Break-even live
UW: 25.0% down · 7.5% · 30yr · 1.5% tax · 5.0% vac · 8.0% maint · 8.0% mgmt
Financing live
Cash to close
- Down payment
- $39,975
- Closing costs
- $4,797
- Reserves months
- —
- Total cash needed
- —
Loan-product check · same deal, 3 products live
Conventional
25% down · 7.5% · 30yr
- Down + closing
- —
- Monthly P&I
- —
- Monthly cashflow
- —
- DSCR
- —
- Eligible?
- —
Personal DTI + credit; lowest rate.
DSCR
20% down · 8.5% · 30yr
- Down + closing
- —
- Monthly P&I
- —
- Monthly cashflow
- —
- DSCR
- —
- Eligible?
- —
No personal income docs; deal must DSCR.
Hard money
10% down · 12.0% · 12mo
- Down + closing
- —
- Monthly P&I
- —
- Monthly cashflow
- —
- DSCR
- —
- Eligible?
- —
Short-term bridge; refi at stabilization.
Rent comps 10 comps
| Address | Beds | Baths | Sqft | Rent | $/sqft | DOM | Units | Dist |
|---|---|---|---|---|---|---|---|---|
| 2202 Hollins Mill Rd Lynchburg, VA | 3.0 | 1.0 | 1800 | $1,400 | $0.78 | 21d | 1 | 0.03mi |
| 2021 Rivermont Ave Unit A Lynchburg, VA | 2.0 | 2.0 | 1700 | $1,800 | $1.06 | 21d | 1 | 0.17mi |
| 1808 Rivermont Ave Apt B Lynchburg, VA | 3.0 | 1.0 | 1100 | $995 | $0.90 | 21d | 1 | 0.32mi |
| 1348 Bedford Ave Lynchburg, VA | 2.0 | 1.0 | 1089 | $895 | $0.82 | 13d | 1 | 0.50mi |
| 1014 Landon Ct Lynchburg, VA | 3.0 | 2.5 | 2168 | $2,495 | $1.15 | 13d | 1 | 0.75mi |
| 18 West Princeton Cir Lynchburg, VA | 1.0–3.0 | 1.0–3.0 | 974 | $1,160 | $1.19 | 13d | 4 | 0.79mi |
| 507 Victoria Ave Unit 507 Lynchburg, VA | 4.0 | 2.0 | 1480 | $1,700 | $1.15 | 21d | 1 | 1.00mi |
| 431 Riverside Dr Lynchburg, VA | 3.0 | 1.5 | 1486 | $1,995 | $1.34 | 44d | 1 | 1.03mi |
| 1705 1st St Unit A Lynchburg, VA | 2.0 | 1.0 | 1100 | $1,395 | $1.27 | 21d | 1 | 1.39mi |
| 512 Polk St Lynchburg, VA | 3.0 | 1.0 | 1340 | $1,295 | $0.97 | 21d | 1 | 1.48mi |
Listing history 14 events
-
2026-06-19days on market $159,900 Active 17 DOM
-
2026-06-18price $159,900 Active 16 DOM
-
2026-06-18days on market $169,900 Active 16 DOM
-
2026-06-17days on market $169,900 Active 15 DOM
-
2026-06-16days on market $169,900 Active 14 DOM
-
2026-06-15days on market $169,900 Active 13 DOM
-
2026-06-14days on market $169,900 Active 11 DOM
-
2026-06-13days on market $169,900 Active 10 DOM
-
2026-06-10days on market $169,900 Active 8 DOM
-
2026-06-09days on market $169,900 Active 7 DOM
-
2026-06-08days on market $169,900 Active 6 DOM
-
2026-06-07days on market $169,900 Active 5 DOM
-
2026-06-03remarks 683-char remark
-
2026-06-03$169,900 Active 1 DOM
ⓘ Source: listings_history table (triggers on properties + properties_extension) + one-shot
backfill from property_details.listing_events for pre-trigger history.
Tax reassessment forecast VA · Resets to sale price
- Current annual tax
- $775 · $65/mo
- Projected year-2 tax
- $1,311 · $109/mo
- Expected delta
- +$536/yr (+$45/mo · 69.1%)
ⓘ Screening estimate from a state-policy table — verify with the county assessor before closing.
Climate risk First Street
- Flood 1/10 Low FEMA zone X (unshaded) · 0% chance over 30 yrs
- Wildfire 1/10 Low
- Heat 6/10 Major 7 d/yr ≥102°F today · 19 d/yr by 30 yrs out
- Wind 2/10 Low 2% chance of damaging wind over 30 yrs
- Air quality 2/10 Low 0 unhealthy d/yr today · 1 by 30 yrs out
Nearby sold comps map
Loading sold comps map…
Walkable amenities ~0.75 mi
Loading nearby amenities…
Taxation est. · year 1
- Rental income
- $18,293
- − Mortgage interest
- −$8,957
- − Property taxes
- −$775
- − Insurance
- −$800
- − Repairs & maintenance
- −$1,463
- − Management
- −$1,463
- − Depreciation
- −$4,652
- Taxable income
- $183
- Est. tax owed @ 24.0%
- −$44
- After-tax cash flow
- $2,770/yr
For passive investors: Depreciation is non-cash, so a rental often shows a tax loss while cash-flowing — sheltering income. Rental losses are passive: they offset passive income freely, and up to $25,000/yr can offset ordinary (W-2) income if you actively participate and your MAGI is under $100k (phasing out to $0 by $150k); unused losses carry forward. On sale, claimed depreciation is recaptured at up to 25%, and gains may owe capital-gains tax (a 1031 exchange can defer both). Figures are a year-1 estimate at your 24.0% rate — not tax advice; consult a CPA.
Schools (NCES district)
- District
- Lynchburg City Public School District
- NCES district ID
- 5102340
- Math proficiency
- 36% ▼ -38.00%
- Reading proficiency
- 61% ▼ -8.00%
- Median HH income
- $39,097
- Composite
- 40.4/100
- National rank
- #3730
- State rank
- #104 of 131 in VA
Livability — Lynchburg
- Score
- 91/100
- State rank
- #1
- US rank
- #58
Category grades
Schools grade is shown separately in the Schools card above.
Census & demographics
- Census place
- Lynchburg, VA
- County
- Lynchburg City · 97,036 people
- City population
- 97,036
- Metro
- Lynchburg, VA
- Population (ZIP)
- 20,419
- Household income
- $89,137
- Rent vs Own
- Severe rent burden
- 506.0
Population outlook (Lynchburg County) Hauer SSP2
- Today (2025)
- 87,977 people
- By 2030
- 93,626 · +6.4%
- By 2040
- 106,145 · +20.7%
- By 2050
- 120,783 · +37.3%
- By 2075
- 162,249 · +84.4%
- By 2100
- 191,358 · +117.5%
Race, ethnicity, and origin ACS 2023
- Neighborhood character
- Predominantly White (79%)
- Race & ethnicity
- White 79% Black 12% Two or more races 5% Hispanic / Latino 4%
- Common ancestry
- Italian 4% Slovak 2% Lithuanian 2%
- Foreign-born
- 3% · Canada, China
- Languages at home
- 96% English-only · Spanish 2% Other Indo-European 1%
Political lean MEDSL · Lynchburg
- 2024 margin
- Lean R (+7.9) · D 45.4% · R 53.3% · Other 1.3%
- 2008→2024 swing
- -3.9pp toward R · 2008: -4.0pp · 2024: -7.9pp
- All cycles
- 2024: R+7.9 2020: D+2.6 2016: R+9.0 2012: R+10.6 2008: R+4.0
Not yet ingested
- Civics
- —
Market trends
- HPI YoY
- ▼ -220.75%
- Current HPI
- 227.1443
- Rent YoY
- —
- Metro
- Lynchburg, VA
- State GDP YoY
- ▲ 2.40%
- F500 in state
- 50
Industry mix (Fortune 500 HQ in VA)
| Industry | F500 HQs | Revenue |
|---|---|---|
| Aerospace / Defense | 4 | $236B |
|
||
| Technology / Defense | 3 | $32B |
|
||
| Financial Services | 2 | $176B |
|
||
| Utilities | 2 | $27B |
|
||
| Insurance | 2 | $25B |
|
||
| Technology | 2 | $15B |
|
||
Price history
+468.2% since first listed4 events — show timeline
- 2026-06-02 Price Changed $169,900 LMLS
- 2026-06-02 Listed $160,000 LMLS
- 2017-04-05 Listed $48,000 LMLS
- 1992-06-02 Sold (Public Records) $29,900 Public Records
Property tax history
+2.6%/yrLatest (2025): $775 · +17.9% YoY. Source: county tax records.
Cash-flow waterfall
monthlySold comps — $/sqft
last 12 mo · ≤1 miLoading sold comps…