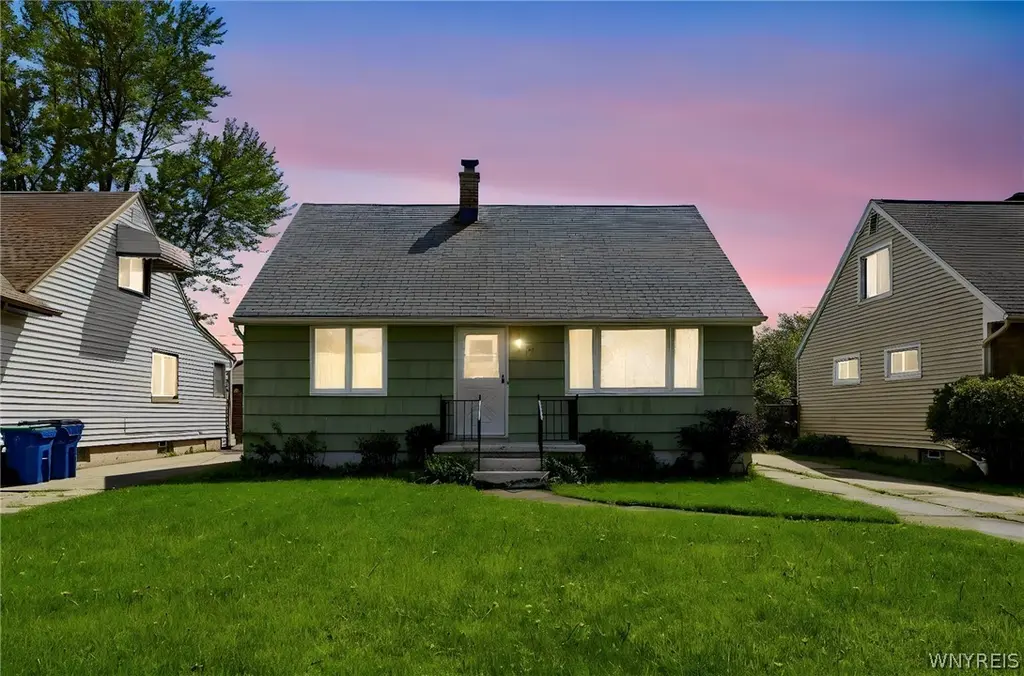
157 Margaret Rd · Eggertsville, NY
Flood risk 5/10 · Moderate
- FEMA flood zone
- X (unshaded)
- Chance of flooding over 30 yrs
- 0.47%
- Est. flood insurance / yr
- $473 – $860
Fire risk 1/10 · Minimal
- Est. fire insurance / yr
- $691 – $1,283
Heat risk 3/10 · Minor
- Hot days now (above 92°F)
- 7 days/yr
- Hot days in 30 yrs
- 15 days/yr
Wind risk 1/10 · Minimal
- Chance of severe wind over 30 yrs
- —
Air-quality risk 3/10 · Minor
- Unhealthy air days now
- 2 days/yr
- Unhealthy air days in 30 yrs
- 3 days/yr
Risk factors via First Street. Map © Google.
Why this score? — see what drove the B grade
The composite is a weighted blend of 9 inputs, each scored 0–100. Each bar is that input's sub-score; the figure is the points it added to the 100-point composite (weight × sub-score).
- Cash flow +30.0/30.0
- DSCR +10.0/10.0
- 1% rule +9.6/10.0
- ARV discount +7.5/15.0
- Rent growth +4.8/5.0
- Schools +4.5/10.0
- Livability +4.2/5.0
- Condition / age +2.5/5.0
- Appreciation +0.0/10.0
$149,900
🖨 Deal sheet 📄 Offer letter ✓ Due diligence
Listing remarks
Welcome to 157 Margaret Rd! Proudly owned by just one owner since the day it was built, this well cared for home is full of opportunity and ready for its next chapter. Featuring 3 bedrooms and 1 full bathroom, this home offers a functional layout with comfortable living space throughout. Original hardwood floors run throughout the home and are in great condition, adding timeless character and charm. Recent updates include the furnace, hot water tank, and bathroom, giving peace of mind to the next owner. Conveniently located just minutes from the Boulevard, you’ll have quick access to shopping, restaurants, and everyday conveniences. The basement features a bonus room, perfect for a ho
Key facts
- Recent updates
- Bonus room
- Prime location
Tags
Property features AI
Exterior
- Parking: No garage
- Utilities: Public water (connected); Sewer connected
- Home design: 2-story house; Existing construction; Facing unspecified
- Construction: Shake siding; Wood siding; Asphalt roof; Poured foundation
- Exterior features: Concrete driveway; Rectangular residential lot (45 x 112)
Interior
- Kitchen: Dishwasher; Gas cooktop; Microwave; Refrigerator
- Bedrooms: 2 main-level bedrooms
- Flooring: Hardwood; Tile; Vinyl; Varies
- Bathrooms: 1 full bathroom (on main level)
- Heating & cooling: Gas forced-air heating; Central air conditioning
- Interior features: Eat-in kitchen; Separate/formal living room; Bedroom on main level; Full, partially finished basement
- Laundry & utility: Gas water heater
Neighborhood map
What this means for you Summary
Snapshot
- This is a 3-bed/1.0-bath single-family listed at $150k.
Deal economics
- At list price, monthly cash flow is $625 ($8k/yr) — positive.
- The deal already cash-flows at list — no discount required.
- Meets the 1% rule at list price ($2k rent vs $150k).
- Cap rate 11.3% vs local median 4.5% in Eggertsville — top-decile yield for the area; either an underpriced asset or a hidden risk that comps aren't pricing in. Stress-test before assuming the spread holds.
Location & tenants
- Location reads 85/100 on livability (#34 in NY, #534 nationally) — a professional / high-income tenant draw. Strengths: commute A+, housing A+, health & safety A+; Watch: crime C-, amenities C-.
- Sweet Home Central School District (suburban): math 46% / reading 59% proficiency, ranked #342 of 590 in NY (top 58%) — acceptable for families but not a draw, mixed tenant base, ~2y average lease.
- Market conditions: Rents rising fast (+9.0%/yr); 143 active listings in the ZIP; 13 comparable units currently listed for rent nearby; rentals at typical pace (median 17d on market — plan ~3-4 weeks tenant-placement turnaround); solid renter incomes; 1,244 units permitted in Erie County in 2024 (563 in 5+ unit buildings).
- This rent runs 31% of the median local income ($84k/yr) — at the standard rent-burdened threshold; future hikes will face affordability resistance.
Forward outlook
- Local home prices are declining (-3.0%/yr); year-one equity from $1k of loan paydown is wiped out by about $4k of value loss. Plan a longer hold.
- At projected returns (-3.0% appreciation + 8.0% rent growth), your $42k cash investment doubles in ~6 years — after that, you're playing with house money.
Negotiation context
- Only 8 days on market — expect competitive offers; lowballing is unlikely to land.
Risks & watch-outs
- Watch-outs: built in 1957 — expect roof / HVAC / electrical / plumbing capex.
- Climate carrying-cost: moderate flood risk — expect insurance premiums to compound above CPI over the hold.
Questions for the listing agent
- Built in 1957 — when were the roof, HVAC, electrical panel, plumbing, and water heater last replaced?
- Is there a deadline driving the sale (1031 exchange, divorce, estate, relocation)? That informs how much negotiation room exists.
- Schools are B-rated — typically a magnet for longer-tenancy family renters. What's the average tenant stay here, and is there a school-zone premium baked into asking?
- What's the average days-on-market for RENTAL listings here right now (not sales)? A rising rental-DOM trend means longer vacancies and softer asking-rent achievability than the comps imply.
- What's the recent tenant-quality profile in this submarket — average credit score on applications, eviction rate, late-payment / NSF rate, and stable-employment percentage? A property-management company in the area should have these aggregated.
- How much new for-sale + rental construction is in the pipeline within 1–3 miles? Heavy new supply typically softens prices + rents 12–24 months out; constrained supply supports both.
Investment metrics
- 1% rule
- 1.46% ✓
- Cap rate
- 11.30%
- Cash-on-cash
- 17.88%
- DSCR
- 1.80
- GRM
- 5.7
CMA / ARV
- ARV (median comp)
- $300,201
- List price
- $149,900
- Delta
- -50.07%
- Verdict
- UNDERPRICED
- Comps
- 20 within 1.0 mi
Show comp detail 12 sales within ~0.75 mi
| Address | Dist | Beds/Ba | Sqft | Sold | Price | $/sf | Match |
|---|---|---|---|---|---|---|---|
| 652 Moore Ave | 0.45mi | 3/1.5 | 1,182 (-2%) | 2mo | $265,000 | $224 | 72 |
| 511 Capen Blvd | 0.44mi | 4/1.0 (+1) | 1,260 (+4%) | 1mo | $260,504 | $207 | 66 |
| 244 Kettering Dr | 0.33mi | 3/1.0 | 1,056 (-13%) | 2mo | $170,000 | $161 | 62 |
| 206 Lamont Dr | 0.55mi | 4/1.5 (+1) | 1,188 (-2%) | 4mo | $300,000 | $253 | 61 |
| 130 Stevenson Blvd | 0.73mi | 3/1.5 | 1,232 (+2%) | 1mo | $347,000 | $282 | 60 |
| 12 Delta Rd | 0.28mi | 3/1.5 | 1,374 (+14%) | 4mo | $260,000 | $189 | 59 |
| 624 Moore Ave | 0.51mi | 3/1.5 | 1,103 (-9%) | 0mo | $285,000 | $258 | 59 |
| 329 Springville Ave | 0.64mi | 3/2.0 | 1,306 (+8%) | 0mo | $322,040 | $247 | 52 |
| 414 Longmeadow Rd | 0.68mi | 3/1.0 | 1,111 (-8%) | 3mo | $270,000 | $243 | 52 |
| 51 Conant Dr | 0.68mi | 3/1.0 | 1,097 (-9%) | 2mo | $225,000 | $205 | 51 |
| 15 Kelvin Dr | 0.72mi | 3/1.0 | 1,076 (-11%) | 0mo | $93,000 | $86 | 48 |
| 39 Hartford Rd | 0.73mi | 3/1.0 | 1,060 (-12%) | 1mo | $265,000 | $250 | 44 |
Match score weights: distance 35% · size 25% · config 20% · recency 20%. Top-matched comps best support the ARV.
Projected returns pro-forma
-3.0% appreciation · 8.0% rent growth · sell at horizon
- IRR
- 15.2%
- Equity multiple
- 1.65×
- Total profit
- $27,130
- Equity at exit
- $22,351
- IRR
- 27.4%
- Equity multiple
- 4.04×
- Total profit
- $127,662
- Equity at exit
- $12,961
Cash invested: $41,972 (down + closing). Projections, not guarantees.
Landlord ↔ Tenant lean methodology
- Overall (STATE)
- 15 Strongly Tenant-Friendly
- State New York
- 15 Strongly Tenant-Friendly · D+10
- County
- — inherits STATE
- City
- — inherits STATE
ZIP-level market 14226
- Rents YoY
- 9.0%
- Active inventory
- 143
- Price-to-rent
- 5.7×
Monthly cashflow live
- Estimated rent
- $2,182 high interval (Pro) →
- Mortgage (P&I)
- −$786
- Tax from tax record
- −$250 /mo · $2,995/yr
- Insurance
- −$62
- HOA
- −$0
- Vacancy / Maint / Mgmt
- −$458
- Net cashflow
- $625
Break-even live
UW: 25.0% down · 7.5% · 30yr · 1.5% tax · 5.0% vac · 8.0% maint · 8.0% mgmt
Financing live
Cash to close
- Down payment
- $37,475
- Closing costs
- $4,497
- Reserves months
- —
- Total cash needed
- —
Loan-product check · same deal, 3 products live
Conventional
25% down · 7.5% · 30yr
- Down + closing
- —
- Monthly P&I
- —
- Monthly cashflow
- —
- DSCR
- —
- Eligible?
- —
Personal DTI + credit; lowest rate.
DSCR
20% down · 8.5% · 30yr
- Down + closing
- —
- Monthly P&I
- —
- Monthly cashflow
- —
- DSCR
- —
- Eligible?
- —
No personal income docs; deal must DSCR.
Hard money
10% down · 12.0% · 12mo
- Down + closing
- —
- Monthly P&I
- —
- Monthly cashflow
- —
- DSCR
- —
- Eligible?
- —
Short-term bridge; refi at stabilization.
Rent comps 13 comps
| Address | Beds | Baths | Sqft | Rent | $/sqft | DOM | Units | Dist |
|---|---|---|---|---|---|---|---|---|
| 4765 N Bailey Ave Buffalo, NY | 2.0 | 1.0 | 900 | $2,100 | $2.33 | 43d | 1 | 0.64mi |
| 182 Woodcrest Dr Amherst, NY | 3.0 | 1.5 | 1380 | $2,300 | $1.67 | 19d | 1 | 0.74mi |
| 348 Capen Blvd Buffalo, NY | 3.0 | 1.5 | 1424 | $2,200 | $1.54 | 1d | 1 | 0.77mi |
| 780 Millersport Hwy Unit 1 Buffalo, NY | 2.0 | 1.0 | 850 | $1,395 | $1.64 | 43d | 1 | 0.85mi |
| 1257 Brighton Rd Tonawanda, NY | 4.0 | 1.0 | 1268 | $2,500 | $1.97 | 15d | 1 | 1.00mi |
| 1257 Brighton Rd Tonawanda, NY | 4.0 | 1.0 | 1268 | $2,500 | $1.97 | 3d | 1 | 1.00mi |
| 212 Dellwood Rd Buffalo, NY | 4.0 | 4.0 | 1209 | $3,400 | $2.81 | 1d | 2 | 1.01mi |
| 151 Lamson Rd Buffalo, NY | 4.0 | 2.0 | 1382 | $2,350 | $1.70 | 16d | 1 | 1.10mi |
| 63 Garnet Rd Buffalo, NY | 2.0 | 1.0 | 800 | $1,350 | $1.69 | 43d | 1 | 1.19mi |
| 79 Rosemont Dr Buffalo, NY | 2.0 | 1.0 | 1071 | $2,200 | $2.05 | 43d | 1 | 1.23mi |
| 2776 Eggert Rd #2 Tonawanda, NY | 3.0 | 1.0 | 972 | $1,600 | $1.65 | 23d | 1 | 1.35mi |
| 33 Tillotson Pl Buffalo, NY | 3.0 | 1.0 | 1143 | $2,095 | $1.83 | 14d | 1 | 1.45mi |
| 626 Englewood Ave Buffalo, NY | 2.0 | 1.0 | 850 | $1,550 | $1.82 | 1d | 1 | 1.47mi |
Listing history 1 events
-
2026-05-11$149,900 Active 908-char remark
ⓘ Source: listings_history table (triggers on properties + properties_extension) + one-shot
backfill from property_details.listing_events for pre-trigger history.
Tax reassessment forecast NY · Partial reset (capped growth)
- Current annual tax
- $2,995 · $250/mo
- Projected year-2 tax
- $2,995 · $250/mo
- Expected delta
- $0/yr ($0/mo · 0.0%)
ⓘ Screening estimate from a state-policy table — verify with the county assessor before closing.
Climate risk First Street
- Flood 5/10 Major FEMA zone X (unshaded) · 47% chance over 30 yrs
- Wildfire 1/10 Low
- Heat 3/10 Moderate 7 d/yr ≥92°F today · 15 d/yr by 30 yrs out
- Wind 1/10 Low
- Air quality 3/10 Moderate 2 unhealthy d/yr today · 3 by 30 yrs out
Nearby sold comps map
Loading sold comps map…
Walkable amenities ~0.75 mi
Loading nearby amenities…
Taxation est. · year 1
- Rental income
- $26,178
- − Mortgage interest
- −$8,397
- − Property taxes
- −$2,995
- − Insurance
- −$750
- − Repairs & maintenance
- −$2,094
- − Management
- −$2,094
- − Depreciation
- −$4,361
- Taxable income
- $5,487
- Est. tax owed @ 24.0%
- −$1,317
- After-tax cash flow
- $6,186/yr
For passive investors: Depreciation is non-cash, so a rental often shows a tax loss while cash-flowing — sheltering income. Rental losses are passive: they offset passive income freely, and up to $25,000/yr can offset ordinary (W-2) income if you actively participate and your MAGI is under $100k (phasing out to $0 by $150k); unused losses carry forward. On sale, claimed depreciation is recaptured at up to 25%, and gains may owe capital-gains tax (a 1031 exchange can defer both). Figures are a year-1 estimate at your 24.0% rate — not tax advice; consult a CPA.
Schools (NCES district)
- District
- Sweet Home Central School District
- NCES district ID
- 3628500
- Math proficiency
- 46% ▼ -12.00%
- Reading proficiency
- 59% ▲ 4.00%
- Median HH income
- $48,509
- Composite
- 44.67/100
- National rank
- #2765
- State rank
- #342 of 590 in NY
Livability — Eggertsville
- Score
- 85/100
- State rank
- #34
- US rank
- #534
Category grades
Schools grade is shown separately in the Schools card above.
Census & demographics
- Census place
- Eggertsville, NY
- County
- Erie County · 714,559 people
- City population
- 29,482
- Metro
- Buffalo-Cheektowaga, NY
- Population (ZIP)
- 29,159
- Household income
- $84,325
- Rent vs Own
- Severe rent burden
- 856.0
Population outlook (Erie County) Hauer SSP2
- Today (2025)
- 933,037 people
- By 2030
- 935,181 · +0.2%
- By 2040
- 928,531 · -0.5%
- By 2050
- 905,725 · -2.9%
- By 2075
- 834,037 · -10.6%
- By 2100
- 708,033 · -24.1%
Race, ethnicity, and origin ACS 2023
- Neighborhood character
- Predominantly White (74%)
- Race & ethnicity
- White 74% Black 10% Asian 7% Two or more races 6% Hispanic / Latino 5%
- Common ancestry
- Romanian 7% Lithuanian 2% Slovak 1%
- Foreign-born
- 13% · Canada, China, India
- Languages at home
- 87% English-only · Other Indo-European 4% Spanish 2% Arabic 1%
Political lean MEDSL · Erie
- 2024 margin
- Lean D (+9.7) · D 54.8% · R 45.2%
- 2008→2024 swing
- -7.9pp toward R · 2008: 17.5pp · 2024: 9.7pp
- All cycles
- 2024: D+9.7 2020: D+14.7 2016: D+4.8 2012: D+15.6 2008: D+17.5
Not yet ingested
- Civics
- —
Market trends
- HPI YoY
- ▼ -270.71%
- Current HPI
- 331.1929
- Rent YoY
- ▲ 9.01%
- Metro
- Buffalo-Cheektowaga, NY
- State GDP YoY
- ▲ 2.60%
- F500 in state
- 92
Industry mix (Fortune 500 HQ in NY)
| Industry | F500 HQs | Revenue |
|---|---|---|
| Financial Services | 10 | $950B |
|
||
| Consumer Goods | 9 | $162B |
|
||
| Insurance | 4 | $225B |
|
||
| Telecommunications | 2 | $144B |
|
||
| Pharmaceuticals | 2 | $112B |
|
||
| Media / Entertainment | 2 | $69B |
|
||
Price history
2 events — show timeline
- 2026-05-19 Pending — WNYREIS
- 2026-05-11 Listed $149,900 WNYREIS
Property tax history
+7.1%/yrLatest (2025): $2,995 · -20.3% YoY. Source: county tax records.
Cash-flow waterfall
monthlySold comps — $/sqft
last 12 mo · ≤1 miLoading sold comps…