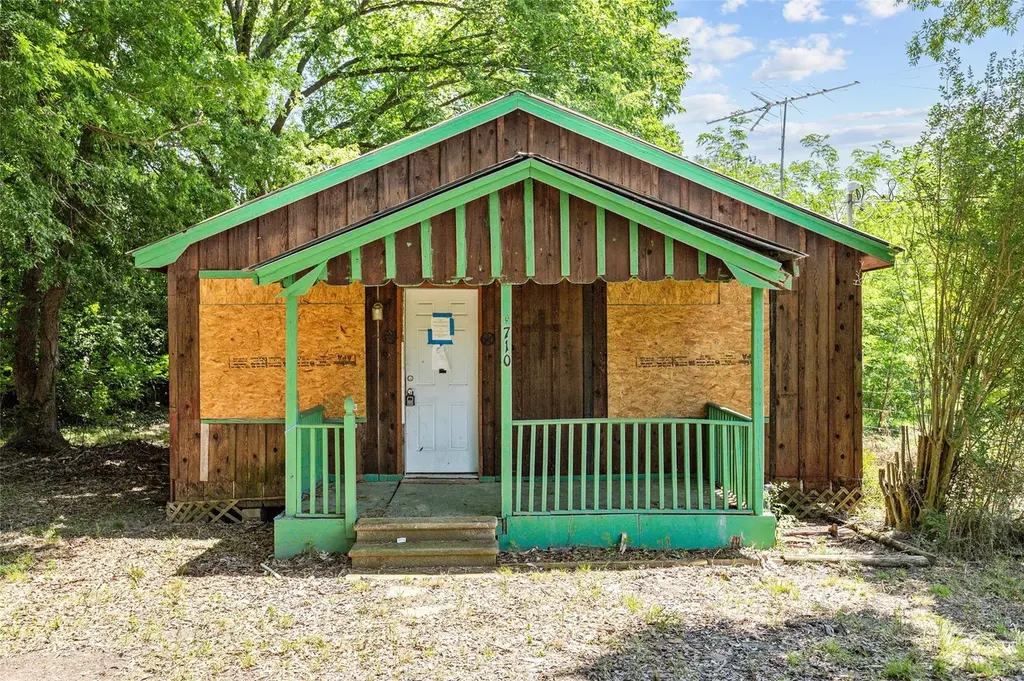
710 Black St · Jasper, TX
Flood risk 1/10 · Minimal
- FEMA flood zone
- X (unshaded)
- Chance of flooding over 30 yrs
- 0.0%
- Est. flood insurance / yr
- $507 – $1,088
Fire risk 3/10 · Minor
- Est. fire insurance / yr
- $1,222 – $2,270
Heat risk 8/10 · Major
- Hot days now (above 111°F)
- 7 days/yr
- Hot days in 30 yrs
- 22 days/yr
Wind risk 8/10 · Major
- Chance of severe wind over 30 yrs
- 98.0%
Air-quality risk 1/10 · Minimal
- Unhealthy air days now
- 0 days/yr
- Unhealthy air days in 30 yrs
- 0 days/yr
Risk factors via First Street. Map © Google.
Why this score? — see what drove the B- grade
The composite is a weighted blend of 9 inputs, each scored 0–100. Each bar is that input's sub-score; the figure is the points it added to the 100-point composite (weight × sub-score).
- Cash flow +30.0/30.0
- 1% rule +10.0/10.0
- DSCR +10.0/10.0
- ARV discount +7.5/15.0
- Livability +2.9/5.0
- Rent growth +2.5/5.0
- Condition / age +2.5/5.0
- Schools +2.0/10.0
- Appreciation +0.0/10.0
$34,900
🖨 Deal sheet (PDF) 📄 Offer letter ✓ Due diligence
Listing remarks
This property presents a prime opportunity for investors, renovators, or buyers looking to add value through improvements. This property offers strong potential with a functional layout and sits on a spacious lot in an established area of Jasper. The home is in need of repairs and updates throughout, making it an ideal fixer-upper project with room to customize and modernize to your vision. Whether you are looking for a rental investment, resale project, or a personal renovation, and upside potential. Conveniently located near local schools, shopping, and major roadways, the property combines small-town living with accessibility. Sold as-is, this is a great opportunity to bring new life to
Key facts
- Major roadways
- Spacious lot
- Local schools
Tags
Property features AI
Finance
- Other: Total building area approximately 775
- Financial info: Lease not considered
- HOA & community: No HOA information provided
Exterior
- Parking: Parking details not specified
- Security: No security details provided
- Utilities: Public water; Public sewer
- Home design: Residential property; Built in 1941
- Construction: Wood siding exterior; Block foundation; Metal roof
- Exterior features: Lot approximately 0.25 acre (10,890 sq ft); Other lot features
Interior
- Kitchen: Kitchen details not specified
- Bedrooms: Number of bedrooms not specified
- Flooring: Flooring details not specified
- Bathrooms: 1 full bathroom
- Heating & cooling: Window-unit heating; Window-unit cooling
- Interior features: 6 total rooms
- Laundry & utility: Laundry details not specified
Neighborhood map
What this means for you Summary
Snapshot
- This is a 2-bed/1.0-bath single-family listed at $35k.
Deal economics
- At list price, monthly cash flow is $561 ($7k/yr) — positive.
- The deal already cash-flows at list — no discount required.
- Meets the 1% rule at list price ($1k rent vs $35k).
- Recommended offer: $34k (1.5% below list) — sets the bar for market timing.
- Cap rate 25.6% vs local median 4.7% in Jasper — top-decile yield for the area; either an underpriced asset or a hidden risk that comps aren't pricing in. Stress-test before assuming the spread holds.
Location & tenants
- Location reads 58/100 on livability (#1,225 in TX) — a working-class tenant base; expect higher turnover. Strengths: cost of living A+, housing A; Watch: crime C-, amenities F, commute F.
- Jasper ISD (town): math 22% / reading 26% proficiency, ranked #734 of 826 in TX (top 89%) — low school quality limits family demand, transient renter base, plan for 1-2y turnover; 66% free/reduced lunch — lower-income household profile, screen leases tightly.
- Zoned schools: Jean C Few Pri (math 8% / reading 17%, grade F, #4,180 of 4,322 statewide, top 97%, 699 students, 91% FRL); Jasper J H (math 27% / reading 24%, grade F, #1,236 of 1,662 statewide, top 76%, 493 students, 83% FRL); Jasper H S (math 24% / reading 40%, grade F, #1,044 of 1,632 statewide, top 66%, 681 students, 76% FRL) — zoned schools average 83% FRL vs 66% district-wide (17 pts higher); higher-poverty schools than district average — tighter screening recommended.
- Market conditions: 308 active listings in the ZIP; 45 units permitted in Jasper County in 2024 (0 in 5+ unit buildings).
Forward outlook
- Local home prices are declining (-3.0%/yr); year-one equity from $241 of loan paydown is wiped out by about $1k of value loss. Plan a longer hold.
- Jasper County population projected at -15% by 2050 — secular population decline; favor cash flow + early exit over multi-decade hold.
- At projected returns (-3.0% appreciation + 3.0% rent growth), your $10k cash investment doubles in ~2 years — after that, you're playing with house money.
Negotiation context
- It's been on market 30 days — a 2% lower offer ($34k) is reasonable based on typical stale-listing flexibility.
Risks & watch-outs
- Watch-outs: built in 1941 — expect roof / HVAC / electrical / plumbing capex.
- Climate carrying-cost: severe wind risk, 98% chance of damaging wind over 30y; extreme-heat days projected 7→22/yr by 2055 (HVAC capex compounding) — expect insurance premiums to compound above CPI over the hold.
Questions for the listing agent
- Built in 1941 — when were the roof, HVAC, electrical panel, plumbing, and water heater last replaced?
- Is there a deadline driving the sale (1031 exchange, divorce, estate, relocation)? That informs how much negotiation room exists.
- Schools are F-rated, which usually means shorter tenancies and higher turnover. Who's the typical renter profile here, and what's been the actual vacancy rate?
- What's the average days-on-market for RENTAL listings here right now (not sales)? A rising rental-DOM trend means longer vacancies and softer asking-rent achievability than the comps imply.
- What's the recent tenant-quality profile in this submarket — average credit score on applications, eviction rate, late-payment / NSF rate, and stable-employment percentage? A property-management company in the area should have these aggregated.
- How much new for-sale + rental construction is in the pipeline within 1–3 miles? Heavy new supply typically softens prices + rents 12–24 months out; constrained supply supports both.
Investment metrics
- 1% rule
- 2.97% ✓
- Cap rate
- 25.57%
- Cash-on-cash
- 68.85%
- DSCR
- 4.06
- GRM
- 2.8
CMA / ARV
No comps found within radius.
Projected returns pro-forma
-3.0% appreciation · 3.0% rent growth · sell at horizon
- IRR
- 68.3%
- Equity multiple
- 4.08×
- Total profit
- $30,080
- Equity at exit
- $5,204
- IRR
- 72.5%
- Equity multiple
- 8.40×
- Total profit
- $72,279
- Equity at exit
- $3,018
Cash invested: $9,772 (down + closing). Projections, not guarantees.
Landlord ↔ Tenant lean methodology
- Overall (STATE)
- 87 Strongly Landlord-Friendly
- State Texas
- 87 Strongly Landlord-Friendly · R+5
- County
- — inherits STATE
- City
- — inherits STATE
ZIP-level market 75951
- Active inventory
- 308
- Price-to-rent
- 2.8×
Monthly cashflow live
- Estimated rent
- $1,036 medium interval (Pro) →
- Mortgage (P&I)
- −$183
- Tax from tax record
- −$60 /mo · $720/yr
- Insurance
- −$15
- HOA
- −$0
- Vacancy / Maint / Mgmt
- −$218
- Net cashflow
- $561
Break-even live
Sensitivity live
| Price | -10% $580 | -5% $571 | +0% $561 | +5% $551 | +10% $541 |
|---|---|---|---|---|---|
| Rent | -10% $479 | -5% $520 | +0% $561 | +5% $602 | +10% $642 |
| Rate | -1.0pp $578 | -0.5pp $570 | base $561 | +0.5pp $552 | +1.0pp $542 |
UW: 25.0% down · 7.5% · 30yr · 1.5% tax · 5.0% vac · 8.0% maint · 8.0% mgmt
Financing live
Cash to close
- Down payment
- $8,725
- Closing costs
- $1,047
- Reserves months
- —
- Total cash needed
- —
Loan-product check · same deal, 3 products live
Conventional
25% down · 7.5% · 30yr
- Down + closing
- —
- Monthly P&I
- —
- Monthly cashflow
- —
- DSCR
- —
- Eligible?
- —
Personal DTI + credit; lowest rate.
DSCR
20% down · 8.5% · 30yr
- Down + closing
- —
- Monthly P&I
- —
- Monthly cashflow
- —
- DSCR
- —
- Eligible?
- —
No personal income docs; deal must DSCR.
Hard money
10% down · 12.0% · 12mo
- Down + closing
- —
- Monthly P&I
- —
- Monthly cashflow
- —
- DSCR
- —
- Eligible?
- —
Short-term bridge; refi at stabilization.
Listing history 22 events
-
2026-06-18days on market $34,900 Active 30 DOM
-
2026-06-17days on market $34,900 Active 29 DOM
-
2026-06-16days on market $34,900 Active 28 DOM
-
2026-06-15days on market $34,900 Active 27 DOM
-
2026-06-14days on market $34,900 Active 25 DOM
-
2026-06-13days on market $34,900 Active 24 DOM
-
2026-06-10days on market $34,900 Active 22 DOM
-
2026-06-09days on market $34,900 Active 21 DOM
-
2026-06-08days on market $34,900 Active 20 DOM
-
2026-06-07days on market $34,900 Active 19 DOM
-
2026-06-05days on market $34,900 Active 16 DOM
-
2026-06-03days on market $34,900 Active 15 DOM
-
2026-06-02days on market $34,900 Active 14 DOM
-
2026-06-01days on market $34,900 Active 13 DOM
-
2026-05-31days on market $34,900 Active 12 DOM
-
2026-05-31days on market $34,900 Active 11 DOM
-
2026-05-19$34,900 Active
-
2025-06-05soldstatus
-
2023-03-31soldstatus
-
2022-03-22soldstatus
-
2021-08-20soldstatus
-
2020-08-21soldstatus
ⓘ Source: listings_history table (triggers on properties + properties_extension) + one-shot
backfill from property_details.listing_events for pre-trigger history.
Tax reassessment forecast TX · Resets to sale price
- Current annual tax
- $720 · $60/mo
- Projected year-2 tax
- $720 · $60/mo
- Expected delta
- $0/yr ($0/mo · 0.0%)
ⓘ Screening estimate from a state-policy table — verify with the county assessor before closing.
Climate risk First Street
- Flood 1/10 Low FEMA zone X (unshaded) · 0% chance over 30 yrs
- Wildfire 3/10 Moderate
- Heat 8/10 Severe 7 d/yr ≥111°F today · 22 d/yr by 30 yrs out
- Wind 8/10 Severe 98% chance of damaging wind over 30 yrs
- Air quality 1/10 Low 0 unhealthy d/yr today · 0 by 30 yrs out
Nearby sold comps map
Loading sold comps map…
Walkable amenities ~0.75 mi
Loading nearby amenities…
Taxation est. · year 1
- Rental income
- $12,429
- − Mortgage interest
- −$1,955
- − Property taxes
- −$720
- − Insurance
- −$174
- − Repairs & maintenance
- −$994
- − Management
- −$994
- − Depreciation
- −$1,015
- Taxable income
- $6,576
- Est. tax owed @ 24.0%
- −$1,578
- After-tax cash flow
- $5,150/yr
For passive investors: Depreciation is non-cash, so a rental often shows a tax loss while cash-flowing — sheltering income. Rental losses are passive: they offset passive income freely, and up to $25,000/yr can offset ordinary (W-2) income if you actively participate and your MAGI is under $100k (phasing out to $0 by $150k); unused losses carry forward. On sale, claimed depreciation is recaptured at up to 25%, and gains may owe capital-gains tax (a 1031 exchange can defer both). Figures are a year-1 estimate at your 24.0% rate — not tax advice; consult a CPA.
Schools (NCES district)
- District
- Jasper ISD
- NCES district ID
- 4824630
- Math proficiency
- 22% ▼ -12.00%
- Reading proficiency
- 26% ▼ -8.00%
- Median HH income
- $36,286
- Composite
- 19.91/100
- National rank
- #8684
- State rank
- #734 of 826 in TX
Livability — Jasper
- Score
- 58/100
- State rank
- #1225
- US rank
- #21385
Category grades
Schools grade is shown separately in the Schools card above.
Census & demographics
- Census place
- Jasper, TX
- Population (ZIP)
- 15,267
Population outlook (Jasper County) Hauer SSP2
- Today (2025)
- 33,986 people
- By 2030
- 32,965 · -3.0%
- By 2040
- 30,908 · -9.1%
- By 2050
- 28,893 · -15.0%
- By 2075
- 24,828 · -26.9%
- By 2100
- 19,987 · -41.2%
Race, ethnicity, and origin ACS 2023
- Neighborhood character
- Diverse neighborhood (Simpson 0.56)
- Race & ethnicity
- White 60% Black 28% Two or more races 7% Hispanic / Latino 6%
- Hispanic origin (detail)
- Mexican 6%
- Common ancestry
- Lithuanian 1% Slovak 1% Iranian 1%
- Foreign-born
- 3% · Canada
- Languages at home
- 93% English-only · Spanish 5% Tagalog/Filipino 1%
Political lean MEDSL · Jasper
- 2024 margin
- Solid R (+66.6) · D 16.5% · R 83.1%
- 2008→2024 swing
- -24.6pp toward R · 2008: -42.0pp · 2024: -66.6pp
- All cycles
- 2024: R+66.6 2020: R+61.4 2016: R+59.9 2012: R+48.4 2008: R+42.0
Not yet ingested
- Civics
- —
Market trends
- HPI YoY
- ▼ -83.56%
- Current HPI
- 136.7972
- Rent YoY
- —
- Metro
- —
- State GDP YoY
- ▲ 3.95%
- F500 in state
- 110
Industry mix (Fortune 500 HQ in TX)
| Industry | F500 HQs | Revenue |
|---|---|---|
| Energy | 16 | $1,198B |
|
||
| Technology | 5 | $198B |
|
||
| Engineering / Construction | 4 | $72B |
|
||
| Energy Services | 3 | $60B |
|
||
| Utilities | 3 | $41B |
|
||
| Healthcare | 2 | $330B |
|
||
Price history
6 events — show timeline
- 2026-05-19 Listed $34,900 HARMLS
- 2025-06-05 Sold (Public Records) — Public Records
- 2023-03-31 Sold (Public Records) — Public Records
- 2022-03-22 Sold (Public Records) — Public Records
- 2021-08-20 Sold (Public Records) — Public Records
- 2020-08-21 Sold (Public Records) — Public Records
Property tax history
+10.6%/yrLatest (2025): $720 · +5.2% YoY. Source: county tax records.
Cash-flow waterfall
monthlySold comps — $/sqft
last 12 mo · ≤1 miLoading sold comps…