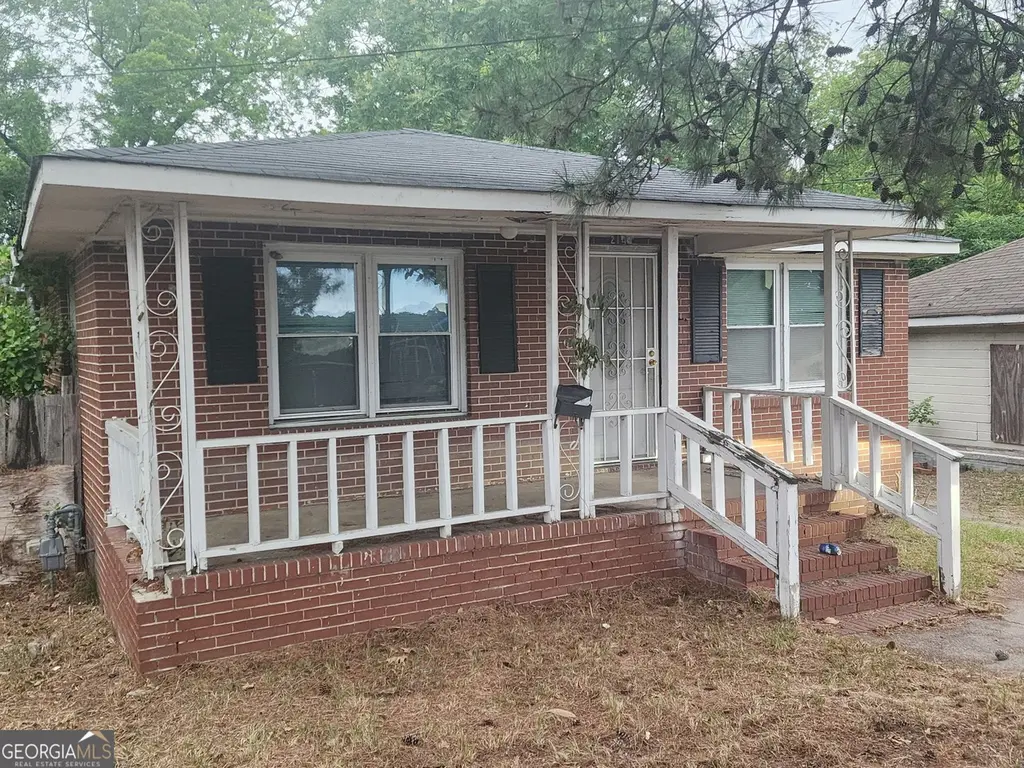
2149 Mercer University Dr · Macon-Bibb County, GA
Flood risk 1/10 · Minimal
- FEMA flood zone
- X (unshaded)
- Chance of flooding over 30 yrs
- 0.0%
- Est. flood insurance / yr
- $473 – $860
Fire risk 1/10 · Minimal
- Est. fire insurance / yr
- $963 – $1,789
Heat risk 7/10 · Major
- Hot days now (above 108°F)
- 7 days/yr
- Hot days in 30 yrs
- 17 days/yr
Wind risk 6/10 · Moderate
- Chance of severe wind over 30 yrs
- 65.0%
Air-quality risk 3/10 · Minor
- Unhealthy air days now
- 3 days/yr
- Unhealthy air days in 30 yrs
- 4 days/yr
Risk factors via First Street. Map © Google.
Why this score? — see what drove the B grade
The composite is a weighted blend of 9 inputs, each scored 0–100. Each bar is that input's sub-score; the figure is the points it added to the 100-point composite (weight × sub-score).
- Cash flow +30.0/30.0
- ARV discount +12.3/15.0
- 1% rule +10.0/10.0
- DSCR +10.0/10.0
- Rent growth +3.7/5.0
- Livability +2.5/5.0
- Condition / age +2.5/5.0
- Schools +1.2/10.0
- Appreciation +0.0/10.0
$69,000
🖨 Deal sheet 📄 Offer letter ✓ Due diligence
Listing remarks MLS
Great Speculative Buy! Investors this is a property that is a stone throw from I-75, very close vicinity to the Mercer University educational institution. Located next door to another property on the market for sale. It awaits a buyer with a vision of multi-housing, commercial probabilities, etc.
Key facts
- 0.24 acre lot
- Built 1961
- Listed 51 days
Property features AI
Finance
- Other: Property condition: Fixer; Lot size approximately 0.24 acres; Approximate living area 1,120 (public records); Subdivision: Pio Nono Heights; Address: 2149 Mercer University Dr, Macon, GA 31204
- HOA & community: No HOA
Exterior
- Parking: Off-street parking
- Utilities: Public water; Public sewer; Electricity available; Natural gas available; High-speed internet available; Cable available; Phone available; Sewer connected; Water available
- Home design: Single-family house; Residential property; Built in 1961; One story
- Construction: Brick construction; Composition roof; Crawl space foundation
- Exterior features: City lot; Property has a view
Interior
- Kitchen: No kitchen appliance details provided
- Bedrooms: 2 bedrooms on the main level
- Flooring: Other flooring
- Bathrooms: 2 full bathrooms on the main level
- Heating & cooling: Central heating; Cooling system: Other
- Interior features: One-level living; Den; Crawl space basement
- Laundry & utility: Laundry area (other)
Neighborhood map
What this means for you Summary
Snapshot
- This is a 2-bed/2.0-bath single-family listed at $69k.
Deal economics
- At list price, monthly cash flow is $439 ($5k/yr) — positive.
- The deal already cash-flows at list — no discount required.
- Meets the 1% rule at list price ($1k rent vs $69k).
- Recommended offer: $67k (3.0% below list) — sets the bar for market timing.
- Cap rate 13.9% vs local median 5.4% in Macon-Bibb County — top-decile yield for the area; either an underpriced asset or a hidden risk that comps aren't pricing in. Stress-test before assuming the spread holds.
Location & tenants
- Location reads: area grade B — affects rentability + tenant quality, not the cash-flow math above.
- Bibb County (urban): math 11% / reading 18% proficiency, ranked #161 of 174 in GA (top 92%) — low school quality limits family demand, transient renter base, plan for 1-2y turnover; 75% free/reduced lunch — lower-income household profile, screen leases tightly.
- Zoned schools: Hartley Elementary School (math 2% / reading 2%, grade F, #1,204 of 1,228 statewide, top 100%, 438 students, 100% FRL); Southwest High School (math 2% / reading 17%, grade F, #365 of 424 statewide, top 88%, 800 students, 100% FRL) — zoned schools average 100% FRL vs 75% district-wide (25 pts higher); higher-poverty schools than district average — tighter screening recommended.
- Market conditions: Rents rising fast (+4.6%/yr); 255 active listings in the ZIP; 40 comparable units currently listed for rent nearby; rentals at typical pace (median 21d on market — plan ~3-4 weeks tenant-placement turnaround); 48% of comp listings sitting > 30 days — soft ceiling on asking rent; lower-income renter base — watch delinquency; 154 units permitted in Bibb County in 2024 (0 in 5+ unit buildings).
- This rent runs 34% of the median local income ($39k/yr) — at the standard rent-burdened threshold; future hikes will face affordability resistance.
Forward outlook
- Local home prices are declining (-3.0%/yr); year-one equity from $477 of loan paydown is wiped out by about $2k of value loss. Plan a longer hold.
- Bibb County population projected at -12% by 2050 — secular population decline; favor cash flow + early exit over multi-decade hold.
- At projected returns (-3.0% appreciation + 4.6% rent growth), your $19k cash investment doubles in ~5 years — after that, you're playing with house money.
Negotiation context
- It's been on market 52 days — a 3% lower offer ($67k) is reasonable based on typical stale-listing flexibility.
- 6 sale attempts since 6y ago with the ask held roughly flat each time — persistent listings suggest the price (not the market) is what's stuck; bring a comps-based counter.
- Current owner paid $25k; list at $69k implies a 176% gain — meaningful room to come down on a strong offer.
Risks & watch-outs
- Climate carrying-cost: major wind risk, 65% chance of damaging wind over 30y; extreme-heat days projected 7→17/yr by 2055 (HVAC capex compounding) — expect insurance premiums to compound above CPI over the hold.
Questions for the listing agent
- It's been on market 52 days. Have you received any prior offers? Is the seller open to a 3% concession, seller financing, or rate buy-down credit?
- Built in 1961 — when were the roof, HVAC, electrical panel, plumbing, and water heater last replaced?
- Is there a deadline driving the sale (1031 exchange, divorce, estate, relocation)? That informs how much negotiation room exists.
- What's the average days-on-market for RENTAL listings here right now (not sales)? A rising rental-DOM trend means longer vacancies and softer asking-rent achievability than the comps imply.
- What's the recent tenant-quality profile in this submarket — average credit score on applications, eviction rate, late-payment / NSF rate, and stable-employment percentage? A property-management company in the area should have these aggregated.
- How much new for-sale + rental construction is in the pipeline within 1–3 miles? Heavy new supply typically softens prices + rents 12–24 months out; constrained supply supports both.
Investment metrics
- 1% rule
- 1.59% ✓
- Cap rate
- 13.94%
- Cash-on-cash
- 27.29%
- DSCR
- 2.21
- GRM
- 5.2
CMA / ARV
- ARV (median comp)
- $77,175
- List price
- $69,000
- Delta
- -10.59%
- Verdict
- UNDERPRICED
- Comps
- 20 within 1.0 mi
Show comp detail 12 sales within ~0.75 mi
| Address | Dist | Beds/Ba | Sqft | Sold | Price | $/sf | Match |
|---|---|---|---|---|---|---|---|
| 670 Poppy Ave | 0.35mi | 3/2.0 (+1) | 1,056 (-6%) | 1mo | $30,000 | $28 | 69 |
| 2586 Dubose St | 0.33mi | 3/1.0 (+1) | 1,129 (+1%) | 10mo | $29,000 | $26 | 66 |
| 1191 Carroll St | 0.48mi | 3/1.0 (+1) | 1,131 (+1%) | 6mo | $70,000 | $62 | 62 |
| 1448 Oakland Ave | 0.51mi | 2/1.0 | 1,116 (-0%) | 14mo | $77,000 | $69 | 60 |
| 549 Straight St | 0.59mi | 2/2.0 | 1,066 (-5%) | 9mo | $50,000 | $47 | 57 |
| 1355 Harris St | 0.59mi | 3/1.0 (+1) | 1,102 (-2%) | 9mo | $102,000 | $93 | 53 |
| 146 Moseley Ave | 0.26mi | 3/2.0 (+1) | 1,230 (+10%) | 18mo | $87,500 | $71 | 51 |
| 2017 Lowe St | 0.39mi | 3/1.0 (+1) | 1,025 (-8%) | 10mo | $47,000 | $46 | 50 |
| 2132 Jasamine Ave | 0.42mi | 2/1.0 | 1,004 (-10%) | 16mo | $54,999 | $55 | 46 |
| 2380 Napier Ave | 0.69mi | 3/1.0 (+1) | 1,260 (+12%) | 1mo | $45,000 | $36 | 37 |
| 853 Grayson Ave | 0.69mi | 3/1.0 (+1) | 984 (-12%) | 4mo | $38,000 | $39 | 35 |
| 1349 Holt Ave | 0.62mi | 3/1.0 (+1) | 1,278 (+14%) | 14mo | $95,998 | $75 | 27 |
Match score weights: distance 35% · size 25% · config 20% · recency 20%. Top-matched comps best support the ARV.
Projected returns pro-forma
-3.0% appreciation · 4.61% rent growth · sell at horizon
- IRR
- 23.0%
- Equity multiple
- 1.96×
- Total profit
- $18,605
- Equity at exit
- $10,288
- IRR
- 31.9%
- Equity multiple
- 4.10×
- Total profit
- $59,868
- Equity at exit
- $5,966
Cash invested: $19,320 (down + closing). Projections, not guarantees.
Landlord ↔ Tenant lean methodology
- Overall (STATE)
- 90 Strongly Landlord-Friendly
- State Georgia
- 90 Strongly Landlord-Friendly · R+3
- County
- — inherits STATE
- City
- — inherits STATE
ZIP-level market 31204
- Rents YoY
- 4.6%
- Active inventory
- 255
- Price-to-rent
- 5.2×
Monthly cashflow live
- Estimated rent
- $1,100 high interval (Pro) →
- Mortgage (P&I)
- −$362
- Tax from tax record
- −$39 /mo · $468/yr
- Insurance
- −$29
- HOA
- −$0
- Vacancy / Maint / Mgmt
- −$231
- Net cashflow
- $439
Break-even live
UW: 25.0% down · 7.5% · 30yr · 1.5% tax · 5.0% vac · 8.0% maint · 8.0% mgmt
Financing live
Cash to close
- Down payment
- $17,250
- Closing costs
- $2,070
- Reserves months
- —
- Total cash needed
- —
Loan-product check · same deal, 3 products live
Conventional
25% down · 7.5% · 30yr
- Down + closing
- —
- Monthly P&I
- —
- Monthly cashflow
- —
- DSCR
- —
- Eligible?
- —
Personal DTI + credit; lowest rate.
DSCR
20% down · 8.5% · 30yr
- Down + closing
- —
- Monthly P&I
- —
- Monthly cashflow
- —
- DSCR
- —
- Eligible?
- —
No personal income docs; deal must DSCR.
Hard money
10% down · 12.0% · 12mo
- Down + closing
- —
- Monthly P&I
- —
- Monthly cashflow
- —
- DSCR
- —
- Eligible?
- —
Short-term bridge; refi at stabilization.
Rent comps 40 comps
| Address | Beds | Baths | Sqft | Rent | $/sqft | DOM | Units | Dist |
|---|---|---|---|---|---|---|---|---|
| 424 Pansy Ave Macon, GA | 2.0 | 1.0 | 810 | $850 | $1.05 | 43d | 1 | 0.39mi |
| 1460 Brentwood Ave Macon, GA | 3.0 | 2.0 | 1148 | $1,250 | $1.09 | 21d | 1 | 0.57mi |
| 1463 Bankston Ave Macon, GA | 2.0 | 1.0 | 960 | $950 | $0.99 | 43d | 1 | 0.72mi |
| 2154 Napier Ave Macon, GA | 3.0 | 1.0 | 1344 | $1,400 | $1.04 | 21d | 1 | 0.74mi |
| 2445 Lowe St Macon, GA | 2.0 | 1.0 | 940 | $890 | $0.95 | 43d | 1 | 0.74mi |
| 1249 Duncan Ave Unit C Macon, GA | 2.0 | 2.0 | 900 | $795 | $0.88 | 43d | 1 | 0.83mi |
| 1249 Duncan Ave Unit B Macon, GA | 2.0 | 2.0 | 700 | $1,095 | $1.56 | 43d | 1 | 0.83mi |
| 806 Armory Dr Unit B Macon, GA | 3.0 | 1.0 | 1100 | $975 | $0.89 | 43d | 1 | 0.84mi |
| 3034 Churchill St Macon, GA | 2.0 | 1.0 | 872 | $900 | $1.03 | 21d | 1 | 0.91mi |
| 771 Harold St Macon, GA | 2.0 | 1.0 | 950 | $1,250 | $1.32 | 13d | 1 | 0.92mi |
| 1268 College St Unit 1 Macon, GA | 2.0 | 2.0 | 1500 | $1,730 | $1.15 | 43d | 1 | 0.95mi |
| 672 Bowden St Macon, GA | 2.0 | 1.0 | 1076 | $900 | $0.84 | 21d | 1 | 0.97mi |
| 1575 Winston Dr Macon, GA | 3.0 | 2.0 | 1215 | $1,350 | $1.11 | 21d | 1 | 1.02mi |
| 1232 Shamrock St Macon, GA | 3.0 | 2.0 | 1282 | $1,700 | $1.33 | 13d | 1 | 1.02mi |
| 663 Williams St Macon, GA | 3.0 | 1.0 | 911 | $980 | $1.08 | 43d | 1 | 1.05mi |
| 1227 Calhoun St Macon, GA | 2.0 | 1.5 | 1212 | $1,200 | $0.99 | 43d | 1 | 1.08mi |
| 1347 Jackson St Macon, GA | 3.0 | 2.0 | 1435 | $1,300 | $0.91 | 43d | 1 | 1.09mi |
| 738 Liberty St Unit 738 Macon, GA | 2.0 | 1.0 | 1378 | $989 | $0.72 | 21d | 1 | 1.10mi |
| 738 Liberty St Unit 730 Macon, GA | 2.0 | 1.0 | 1376 | $680 | $0.49 | 21d | 1 | 1.10mi |
| 1528 Wellworth Ave Macon, GA | 3.0 | 1.0 | 1126 | $1,000 | $0.89 | 21d | 1 | 1.10mi |
| 832 Elm St Macon, GA | 3.0 | 2.0 | 1121 | $1,175 | $1.05 | 43d | 1 | 1.10mi |
| 1089 Brisbane St Macon, GA | 3.0 | 1.0 | 816 | $1,075 | $1.32 | 13d | 1 | 1.19mi |
| 1635 2nd St Macon, GA | 3.0 | 2.0 | 1159 | $1,500 | $1.29 | 43d | 1 | 1.20mi |
| 1020 Radio Dr Macon, GA | 2.0 | 1.0 | 850 | $889 | $1.05 | 43d | 1 | 1.20mi |
| 1596 Burton Ave Macon, GA | 3.0 | 1.0 | 1117 | $895 | $0.80 | 13d | 1 | 1.21mi |
| 2350 English Ave Apt 3D Macon, GA | 3.0 | 1.5 | 980 | $1,095 | $1.12 | 43d | 1 | 1.21mi |
| 1121 Columbus St Unit A Macon, GA | 1.0 | 1.0 | 900 | $1,250 | $1.39 | 13d | 1 | 1.22mi |
| 185 Oak Haven Ave Apt A4 Macon, GA | 3.0 | 2.0 | 1100 | $1,200 | $1.09 | 21d | 1 | 1.28mi |
| 1782 Eveline Ave Macon, GA | 3.0 | 1.0 | 900 | $1,050 | $1.17 | 43d | 1 | 1.29mi |
| 3080 Rice Mill Rd Macon, GA | 3.0 | 1.0 | 1100 | $950 | $0.86 | 43d | 1 | 1.29mi |
| 3080 Rice Mill Rd Unit C-1 Macon, GA | 3.0 | 1.5 | 1100 | $925 | $0.84 | 21d | 1 | 1.29mi |
| 3080 Rice Mill Rd Unit M-5 Macon, GA | 1.0 | 1.0 | 875 | $750 | $0.86 | 43d | 1 | 1.29mi |
| 1975 Vineville Ave Apt F3 Macon, GA | 1.0 | 1.0 | 950 | $700 | $0.74 | 13d | 1 | 1.32mi |
| 1975 Vineville Ave Macon, GA | 1.0–3.0 | 1.0 | 1050 | $825 | $0.79 | 21d | 5 | 1.33mi |
| 2063 Vineville Ave Unit N5 Macon, GA | 3.0 | 2.0 | 1169 | $1,200 | $1.03 | 21d | 1 | 1.33mi |
| 569 Colquitt St Macon, GA | 1.0 | 1.0 | 1330 | $650 | $0.49 | 43d | 1 | 1.34mi |
| 957 New St Macon, GA | 2.0 | 1.5 | 1200 | $1,050 | $0.88 | 13d | 1 | 1.34mi |
| 1196 Mimosa Dr Macon, GA | 3.0 | 2.0 | 1200 | $1,300 | $1.08 | 21d | 1 | 1.37mi |
| 132 Oak Haven Ave Macon, GA | 2.0 | 1.0 | 720 | $975 | $1.35 | 43d | 1 | 1.37mi |
| 455 Pursley St Apt B15 Macon, GA | 1.0 | 1.0 | 850 | $650 | $0.76 | 13d | 1 | 1.37mi |
Listing history 25 events
-
2026-06-19days on market $69,000 Active 52 DOM
-
2026-06-18days on market $69,000 Active 51 DOM
-
2026-06-17days on market $69,000 Active 50 DOM
-
2026-06-16days on market $69,000 Active 49 DOM
-
2026-06-15days on market $69,000 Active 48 DOM
-
2026-06-14days on market $69,000 Active 46 DOM
-
2026-06-13days on market $69,000 Active 45 DOM
-
2026-06-10days on market $69,000 Active 43 DOM
-
2026-06-09days on market $69,000 Active 42 DOM
-
2026-06-09days on market $69,000 Active 41 DOM
-
2026-06-07days on market $69,000 Active 40 DOM
-
2026-06-03days on market $69,000 Active 36 DOM
-
2026-06-02days on market $69,000 Active 35 DOM
-
2026-06-01days on market $69,000 Active 34 DOM
-
2026-05-31days on market $69,000 Active 33 DOM
-
2026-05-30days on market $69,000 Active 32 DOM
-
2026-04-30$69,000 Active 297-char remark
Show marketing remark (297 chars)
Great Speculative Buy! Investors this is a property that is a stone throw from I-75, very close vicinity to the Mercer University educational institution. Located next door to another property on the market for sale. It awaits a buyer with a vision of multi-housing, commercial probabilities, etc.
-
2026-04-27$69,000 New 302-char remark
-
2026-04-21historical
-
2026-02-24$149,900 New
-
2023-12-29historical
-
2021-12-13$100,000 New
-
2021-09-22historical
-
2020-09-21$100,000 Active
-
1999-07-09soldstatus $25,000
ⓘ Source: listings_history table (triggers on properties + properties_extension) + one-shot
backfill from property_details.listing_events for pre-trigger history.
Tax reassessment forecast GA · Resets to sale price
- Current annual tax
- $468 · $39/mo
- Projected year-2 tax
- $635 · $53/mo
- Expected delta
- +$166/yr (+$14/mo · 35.5%)
ⓘ Screening estimate from a state-policy table — verify with the county assessor before closing.
Climate risk First Street
- Flood 1/10 Low FEMA zone X (unshaded) · 0% chance over 30 yrs
- Wildfire 1/10 Low
- Heat 7/10 Severe 7 d/yr ≥108°F today · 17 d/yr by 30 yrs out
- Wind 6/10 Major 65% chance of damaging wind over 30 yrs
- Air quality 3/10 Moderate 3 unhealthy d/yr today · 4 by 30 yrs out
Nearby sold comps map
Loading sold comps map…
Walkable amenities ~0.75 mi
Loading nearby amenities…
Taxation est. · year 1
- Rental income
- $13,201
- − Mortgage interest
- −$3,865
- − Property taxes
- −$468
- − Insurance
- −$345
- − Repairs & maintenance
- −$1,056
- − Management
- −$1,056
- − Depreciation
- −$2,007
- Taxable income
- $4,403
- Est. tax owed @ 24.0%
- −$1,057
- After-tax cash flow
- $4,217/yr
For passive investors: Depreciation is non-cash, so a rental often shows a tax loss while cash-flowing — sheltering income. Rental losses are passive: they offset passive income freely, and up to $25,000/yr can offset ordinary (W-2) income if you actively participate and your MAGI is under $100k (phasing out to $0 by $150k); unused losses carry forward. On sale, claimed depreciation is recaptured at up to 25%, and gains may owe capital-gains tax (a 1031 exchange can defer both). Figures are a year-1 estimate at your 24.0% rate — not tax advice; consult a CPA.
Schools (NCES district)
- District
- Bibb County
- NCES district ID
- 1300420
- Math proficiency
- 11% ▼ -14.00%
- Reading proficiency
- 18% ▼ -11.00%
- Median HH income
- $37,426
- Composite
- 12.13/100
- National rank
- #9654
- State rank
- #161 of 174 in GA
Livability — Macon-Bibb County
No livability data for this city. (Only ~50 U.S. cities are tracked.)
Census & demographics
- Census place
- Macon-Bibb County, GA
- County
- Bibb County · 164,332 people
- City population
- 143,186
- Metro
- Macon-Bibb County, GA
- Population (ZIP)
- 32,421
- Household income
- $38,784
- Rent vs Own
- Severe rent burden
- 2674.0
Population outlook (Bibb County) Hauer SSP2
- Today (2025)
- 148,772 people
- By 2030
- 145,904 · -1.9%
- By 2040
- 139,404 · -6.3%
- By 2050
- 131,603 · -11.5%
- By 2075
- 111,050 · -25.4%
- By 2100
- 83,346 · -44.0%
Race, ethnicity, and origin ACS 2023
- Neighborhood character
- Predominantly Black (65%)
- Race & ethnicity
- Black 65% White 28% Hispanic / Latino 3% Two or more races 2% Asian 1%
- Common ancestry
- Serbian 2% Slovak 1% Lithuanian 1%
- Foreign-born
- 2% · Canada
- Languages at home
- 96% English-only · Spanish 2% French/Haitian/Cajun 1%
Political lean MEDSL · Bibb
- 2024 margin
- Strong D (+22.4) · D 61.0% · R 38.5%
- 2008→2024 swing
- +4.4pp toward D · 2008: 18.0pp · 2024: 22.4pp
- All cycles
- 2024: D+22.4 2020: D+23.8 2016: D+20.2 2012: D+20.0 2008: D+18.0
Not yet ingested
- Civics
- —
Market trends
- HPI YoY
- ▼ -135.44%
- Current HPI
- 194.5459
- Rent YoY
- ▲ 4.61%
- Metro
- Macon-Bibb County, GA
- State GDP YoY
- ▲ 2.66%
- F500 in state
- 28
Industry mix (Fortune 500 HQ in GA)
| Industry | F500 HQs | Revenue |
|---|---|---|
| Paper / Packaging | 2 | $29B |
|
||
| Retail | 1 | $160B |
|
||
| Transportation / Logistics | 1 | $91B |
|
||
| Airlines | 1 | $62B |
|
||
| Consumer Goods | 1 | $47B |
|
||
| Utilities | 1 | $25B |
|
||
Price history
+176.0% since first listed10 events — show timeline
- 2026-04-30 Listed $69,000 MGMLS
- 2026-04-30 Listed $69,000 CGMLS
- 2026-04-27 Listed $69,000 GAMLS
- 2026-04-21 Listing Removed — GAMLS
- 2026-02-24 Listed $149,900 GAMLS
- 2023-12-29 Listing Removed — GAMLS
- 2021-12-13 Listed $100,000 GAMLS
- 2021-09-22 Listing Removed — GAMLS
- 2020-09-21 Listed $100,000 GAMLS
- 1999-07-09 Sold (Public Records) $25,000 Public Records
Property tax history
+5.5%/yrLatest (2025): $468 · -1.3% YoY. Source: county tax records.
Cash-flow waterfall
monthlySold comps — $/sqft
last 12 mo · ≤1 miLoading sold comps…