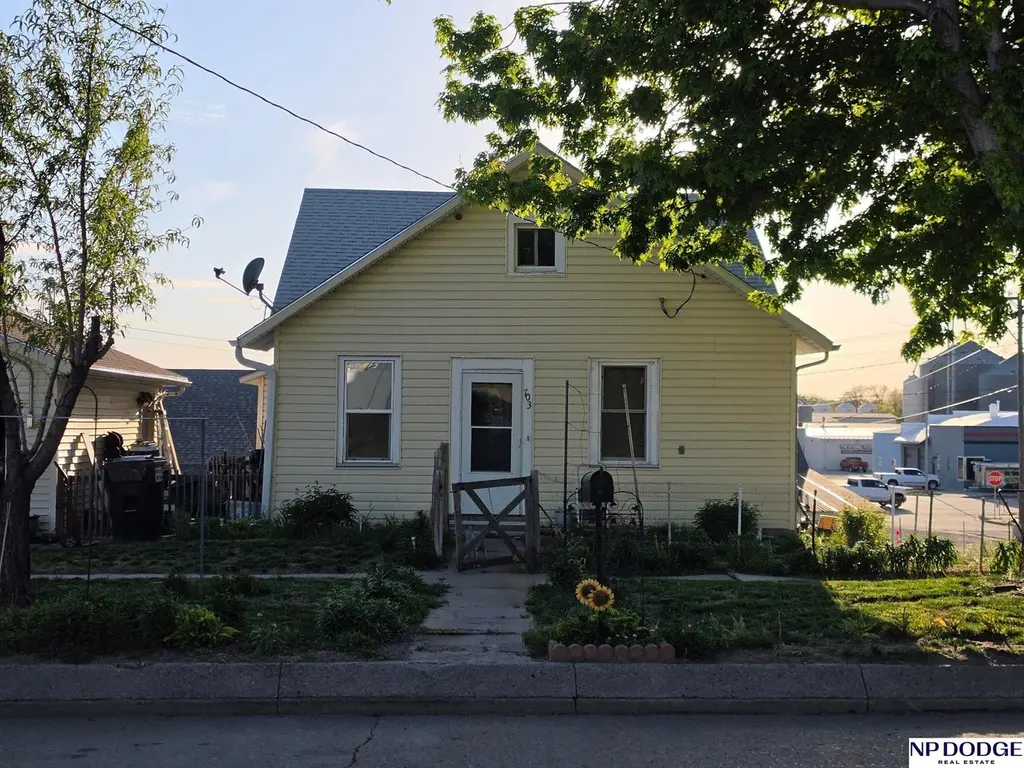
703 S Colfax St · West Point, NE
Flood risk 1/10 · Minimal
- FEMA flood zone
- X
- Chance of flooding over 30 yrs
- 0.0%
- Est. flood insurance / yr
- $473 – $860
Fire risk 4/10 · Minor
- Est. fire insurance / yr
- $1,161 – $2,155
Heat risk 3/10 · Minor
- Hot days now (above 102°F)
- 7 days/yr
- Hot days in 30 yrs
- 15 days/yr
Wind risk 2/10 · Minimal
- Chance of severe wind over 30 yrs
- —
Air-quality risk 1/10 · Minimal
- Unhealthy air days now
- 0 days/yr
- Unhealthy air days in 30 yrs
- 0 days/yr
Risk factors via First Street. Map © Google.
Why this score? — see what drove the C grade
The composite is a weighted blend of 9 inputs, each scored 0–100. Each bar is that input's sub-score; the figure is the points it added to the 100-point composite (weight × sub-score).
- Cash flow +19.6/30.0
- ARV discount +15.0/15.0
- DSCR +6.2/10.0
- Schools +4.5/10.0
- 1% rule +4.2/10.0
- Livability +3.9/5.0
- Rent growth +2.5/5.0
- Condition / age +2.5/5.0
- Appreciation +0.0/10.0
$145,000
🖨 Deal sheet 📄 Offer letter ✓ Due diligence
Listing remarks
This cozy 3-bedroom, 2-bathroom home is perfect for anyone looking for a move-in ready house without the "big ticket" worries. You'll have total peace of mind knowing the roof, central air, and water heater have all been replaced within the last 5 years. The home features a nice, partially finished basement that gives you extra room to spread out, plus a handy laundry area on the lower level. Outside, you'll find a spacious two-car detached garage with plenty of room for vehicles and storage. It's a solid, well-cared-for home that's ready for its next owner to just move in and enjoy!
Key facts
- Laundry area
- Replaced central air
- Replaced roof
Tags
Property features AI
Finance
- HOA & community: Property listed within a senior community
Exterior
- Parking: Detached garage with garage door opener (1 covered space, 1 total parking space)
- Utilities: Public water; Electricity available
- Home design: Single-family residence; One and one-half story; Built in 1900; Not new / not a model
- Construction: Wood shingle roof; Brick/mortar foundation
- Exterior features: Partial fencing; Corner lot; Lot approx. 0.11 acre (55 x 91)
Interior
- Kitchen: Porcelain tile flooring in kitchen; Range; Refrigerator; Pantry
- Bedrooms: Master bedroom on main floor with wall-to-wall carpeting; Second bedroom on main floor with wall-to-wall carpeting; Third bedroom on second floor with wall-to-wall carpeting
- Flooring: Porcelain tile in living, kitchen, and dining areas; Wall-to-wall carpeting in bedrooms
- Bathrooms: Two bathrooms total — one full bath and one three-quarter bath; Main level bathroom(s) present; Below-grade bathroom present
- Heating & cooling: Electric forced-air heating; Central air conditioning
- Interior features: Ceiling fans; Pantry; Electric fireplace; Sump pump; Partially finished basement (approx. 212 finished sq ft)
- Laundry & utility: Washer; Dryer; Sump pump
Neighborhood map
What this means for you Summary
Snapshot
- This is a 3-bed/2.0-bath single-family listed at $145k.
Deal economics
- At list price, monthly cash flow is $166 ($2k/yr) — positive.
- The deal already cash-flows at list — no discount required.
- To meet the 1% rule (rent ≥ 1% of price), the offer needs to be $133k (8.1% below list).
- Recommended offer: $133k (8.1% below list) — sets the bar for 1% rule.
Location & tenants
- Location reads 77/100 on livability (#73 in NE, #3,129 nationally) — a middle-class / working-renter tenant base. Strengths: crime A+, cost of living A+, housing A+; Watch: amenities F, commute F.
- West Point Public Schools (town): math 53% / reading 54% proficiency, ranked #51 of 111 in NE (top 46%) — acceptable for families but not a draw, mixed tenant base, ~2y average lease.
- Zoned schools: West Point Elementary School (math 57% / reading 77%, grade B+, #64 of 502 statewide, top 14%, 294 students, 57% FRL); West Point - Beemer Middle School (math 52% / reading 47%, grade C, #51 of 128 statewide, top 43%, 187 students, 61% FRL); West Point-Beemer High School (math 47% / reading 42%, grade F, #146 of 261 statewide, top 67%, 247 students, 52% FRL) — zoned schools average 57% FRL vs 41% district-wide (15 pts higher); higher-poverty schools than district average — tighter screening recommended.
- Market conditions: 17 active listings in the ZIP; 13 units permitted in Cuming County in 2024 (0 in 5+ unit buildings).
Forward outlook
- Local home prices are declining (-3.0%/yr); year-one equity from $1k of loan paydown is wiped out by about $4k of value loss. Plan a longer hold.
- Cuming County population projected at +5% by 2050 — modest demand growth; plan on rents tracking national, not racing it.
Negotiation context
- It's been on market 40 days — a 3% lower offer ($141k) is reasonable based on typical stale-listing flexibility.
- 2 sale attempts since 2y ago with the ask held roughly flat each time — persistent listings suggest the price (not the market) is what's stuck; bring a comps-based counter.
- Current owner paid $16k; list at $145k implies a 806% gain — meaningful room to come down on a strong offer.
Risks & watch-outs
- Watch-outs: built in 1900 — expect roof / HVAC / electrical / plumbing capex.
Questions for the listing agent
- It's been on market 40 days. Have you received any prior offers? Is the seller open to a 8% concession, seller financing, or rate buy-down credit?
- Built in 1900 — when were the roof, HVAC, electrical panel, plumbing, and water heater last replaced?
- Is there a deadline driving the sale (1031 exchange, divorce, estate, relocation)? That informs how much negotiation room exists.
- Schools are B-rated — typically a magnet for longer-tenancy family renters. What's the average tenant stay here, and is there a school-zone premium baked into asking?
- What's the average days-on-market for RENTAL listings here right now (not sales)? A rising rental-DOM trend means longer vacancies and softer asking-rent achievability than the comps imply.
- What's the recent tenant-quality profile in this submarket — average credit score on applications, eviction rate, late-payment / NSF rate, and stable-employment percentage? A property-management company in the area should have these aggregated.
- How much new for-sale + rental construction is in the pipeline within 1–3 miles? Heavy new supply typically softens prices + rents 12–24 months out; constrained supply supports both.
Investment metrics
- 1% rule
- 0.92% ✗
- Cap rate
- 7.67%
- Cash-on-cash
- 4.90%
- DSCR
- 1.22
- GRM
- 9.1
CMA / ARV
- ARV (median comp)
- $193,245
- List price
- $145,000
- Delta
- -24.97%
- Verdict
- UNDERPRICED
- Comps
- 20 within 1.0 mi
Show comp detail 5 sales within ~0.75 mi
| Address | Dist | Beds/Ba | Sqft | Sold | Price | $/sf | Match |
|---|---|---|---|---|---|---|---|
| 820 Sherman St | 0.44mi | 3/2.0 | 1,715 (-3%) | 1mo | $235,000 | $137 | 74 |
| 640 E David St | 0.27mi | 4/2.0 (+1) | 1,656 (-6%) | 12mo | $188,000 | $114 | 62 |
| 466 S Colfax St | 0.15mi | 3/2.0 | 1,973 (+12%) | 18mo | $225,000 | $114 | 58 |
| 110 W Washington St | 0.70mi | 3/2.0 | 1,998 (+13%) | 10mo | $185,000 | $93 | 37 |
| 838 W Grant St | 0.68mi | 3/2.5 | 2,009 (+14%) | 11mo | $375,000 | $187 | 34 |
Match score weights: distance 35% · size 25% · config 20% · recency 20%. Top-matched comps best support the ARV.
Projected returns pro-forma
-3.0% appreciation · 3.0% rent growth · sell at horizon
- IRR
- -8.7%
- Equity multiple
- 0.68×
- Total profit
- $-12,978
- Equity at exit
- $21,620
- IRR
- 0.7%
- Equity multiple
- 1.05×
- Total profit
- $2,102
- Equity at exit
- $12,537
Cash invested: $40,600 (down + closing). Projections, not guarantees.
Landlord ↔ Tenant lean methodology
- Overall (STATE)
- 83 Strongly Landlord-Friendly
- State Nebraska
- 83 Strongly Landlord-Friendly · R+13
- County
- — inherits STATE
- City
- — inherits STATE
ZIP-level market 68788
- Home prices YoY
- -8.9%
- Active inventory
- 17
- Price-to-rent
- 9.1×
Monthly cashflow live
- Estimated rent
- $1,332 medium interval (Pro) →
- Mortgage (P&I)
- −$760
- Tax from tax record
- −$66 /mo · $790/yr
- Insurance
- −$60
- HOA
- −$0
- Vacancy / Maint / Mgmt
- −$280
- Net cashflow
- $166
Break-even live
UW: 25.0% down · 7.5% · 30yr · 1.5% tax · 5.0% vac · 8.0% maint · 8.0% mgmt
Financing live
Cash to close
- Down payment
- $36,250
- Closing costs
- $4,350
- Reserves months
- —
- Total cash needed
- —
Loan-product check · same deal, 3 products live
Conventional
25% down · 7.5% · 30yr
- Down + closing
- —
- Monthly P&I
- —
- Monthly cashflow
- —
- DSCR
- —
- Eligible?
- —
Personal DTI + credit; lowest rate.
DSCR
20% down · 8.5% · 30yr
- Down + closing
- —
- Monthly P&I
- —
- Monthly cashflow
- —
- DSCR
- —
- Eligible?
- —
No personal income docs; deal must DSCR.
Hard money
10% down · 12.0% · 12mo
- Down + closing
- —
- Monthly P&I
- —
- Monthly cashflow
- —
- DSCR
- —
- Eligible?
- —
Short-term bridge; refi at stabilization.
Listing history 19 events
-
2026-06-18days on market $145,000 Active 40 DOM
-
2026-06-17days on market $145,000 Active 39 DOM
-
2026-06-16days on market $145,000 Active 38 DOM
-
2026-06-15days on market $145,000 Active 37 DOM
-
2026-06-13days on market $145,000 Active 35 DOM
-
2026-06-12days on market $145,000 Active 34 DOM
-
2026-06-09days on market $145,000 Active 31 DOM
-
2026-06-08days on market $145,000 Active 30 DOM
-
2026-06-07days on market $145,000 Active 29 DOM
-
2026-06-05days on market $145,000 Active 27 DOM
-
2026-06-04days on market $145,000 Active 25 DOM
-
2026-06-02days on market $145,000 Active 24 DOM
-
2026-06-01days on market $145,000 Active 23 DOM
-
2026-05-31days on market $145,000 Active 22 DOM
-
2026-05-07$145,000 New 600-char remark
-
2024-08-20historical
-
2024-04-16price $145,000
-
2024-02-19$152,000 New
-
2008-06-06soldstatus $16,000
ⓘ Source: listings_history table (triggers on properties + properties_extension) + one-shot
backfill from property_details.listing_events for pre-trigger history.
Tax reassessment forecast NE · Resets to sale price
- Current annual tax
- $790 · $66/mo
- Projected year-2 tax
- $2,508 · $209/mo
- Expected delta
- +$1,719/yr (+$143/mo · 217.7%)
ⓘ Screening estimate from a state-policy table — verify with the county assessor before closing.
Climate risk First Street
- Flood 1/10 Low FEMA zone X · 0% chance over 30 yrs
- Wildfire 4/10 Moderate
- Heat 3/10 Moderate 7 d/yr ≥102°F today · 15 d/yr by 30 yrs out
- Wind 2/10 Low
- Air quality 1/10 Low 0 unhealthy d/yr today · 0 by 30 yrs out
Nearby sold comps map
Loading sold comps map…
Walkable amenities ~0.75 mi
Loading nearby amenities…
Taxation est. · year 1
- Rental income
- $15,988
- − Mortgage interest
- −$8,122
- − Property taxes
- −$790
- − Insurance
- −$725
- − Repairs & maintenance
- −$1,279
- − Management
- −$1,279
- − Depreciation
- −$4,218
- Taxable loss
- −$425
- Est. tax savings @ 24.0%
- +$102
- After-tax cash flow
- $2,093/yr
For passive investors: Depreciation is non-cash, so a rental often shows a tax loss while cash-flowing — sheltering income. Rental losses are passive: they offset passive income freely, and up to $25,000/yr can offset ordinary (W-2) income if you actively participate and your MAGI is under $100k (phasing out to $0 by $150k); unused losses carry forward. On sale, claimed depreciation is recaptured at up to 25%, and gains may owe capital-gains tax (a 1031 exchange can defer both). Figures are a year-1 estimate at your 24.0% rate — not tax advice; consult a CPA.
Schools (NCES district)
- District
- West Point Public Schools
- NCES district ID
- 3100006
- Math proficiency
- 53% ▲ 3.00%
- Reading proficiency
- 54% ▲ 2.00%
- Median HH income
- $47,420
- Composite
- 45.44/100
- National rank
- #2618
- State rank
- #51 of 111 in NE
Livability — West Point
- Score
- 77/100
- State rank
- #73
- US rank
- #3129
Category grades
Schools grade is shown separately in the Schools card above.
Census & demographics
- Census place
- West Point, NE
- Population (ZIP)
- 4,531
Population outlook (Cuming County) Hauer SSP2
- Today (2025)
- 9,300 people
- By 2030
- 9,384 · +0.9%
- By 2040
- 9,575 · +3.0%
- By 2050
- 9,783 · +5.2%
- By 2075
- 10,835 · +16.5%
- By 2100
- 11,285 · +21.3%
Race, ethnicity, and origin ACS 2023
- Neighborhood character
- Predominantly White (78%)
- Race & ethnicity
- White 78% Hispanic / Latino 21% Two or more races 11% Native American 2%
- Hispanic origin (detail)
- Mexican 19%
- Common ancestry
- Scotch-Irish 1% Iranian 1% Portuguese 1%
- Foreign-born
- 11% · Canada
- Languages at home
- 83% English-only · Spanish 17%
Political lean MEDSL · Cuming
- 2024 margin
- Solid R (+60.0) · D 19.5% · R 79.5%
- 2008→2024 swing
- -24.4pp toward R · 2008: -35.7pp · 2024: -60.0pp
- All cycles
- 2024: R+60.0 2020: R+59.1 2016: R+59.8 2012: R+46.9 2008: R+35.7
Not yet ingested
- Civics
- —
Market trends
- HPI YoY
- ▼ -24.78%
- Current HPI
- 253.3228
- Rent YoY
- —
- Metro
- —
- State GDP YoY
- ▲ 0.68%
- F500 in state
- 2
Industry mix (Fortune 500 HQ in NE)
| Industry | F500 HQs | Revenue |
|---|---|---|
| Conglomerate | 1 | $371B |
|
||
Price history
+806.2% since first listed5 events — show timeline
- 2026-05-07 Listed $145,000 GPRMLS
- 2024-08-20 Listing Removed — GPRMLS
- 2024-04-16 Price Changed $145,000 GPRMLS
- 2024-02-19 Listed $152,000 GPRMLS
- 2008-06-06 Sold (Public Records) $16,000 Public Records
Property tax history
+4.3%/yrLatest (2025): $790 · -11.2% YoY. Source: county tax records.
Cash-flow waterfall
monthlySold comps — $/sqft
last 12 mo · ≤1 miLoading sold comps…