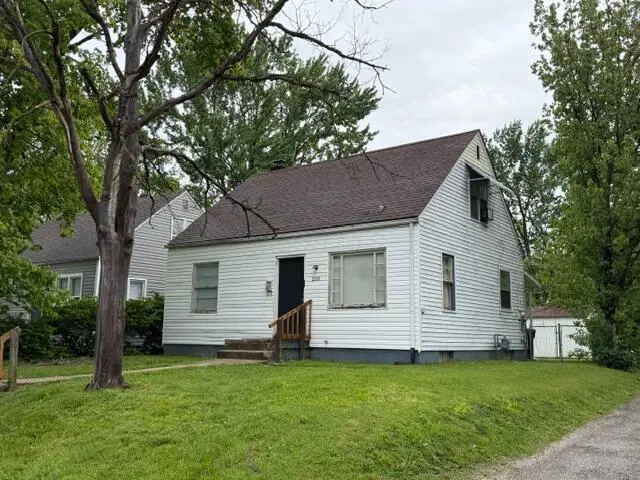
2618 Hiawatha St · Columbus, OH
Flood risk 1/10 · Minimal
- FEMA flood zone
- X (unshaded)
- Chance of flooding over 30 yrs
- 0.0%
- Est. flood insurance / yr
- $473 – $860
Fire risk 1/10 · Minimal
- Est. fire insurance / yr
- $713 – $1,323
Heat risk 3/10 · Minor
- Hot days now (above 100°F)
- 6 days/yr
- Hot days in 30 yrs
- 16 days/yr
Wind risk 2/10 · Minimal
- Chance of severe wind over 30 yrs
- 1.0%
Air-quality risk 3/10 · Minor
- Unhealthy air days now
- 2 days/yr
- Unhealthy air days in 30 yrs
- 4 days/yr
Risk factors via First Street. Map © Google.
Why this score? — see what drove the C- grade
The composite is a weighted blend of 9 inputs, each scored 0–100. Each bar is that input's sub-score; the figure is the points it added to the 100-point composite (weight × sub-score).
- Cash flow +18.4/30.0
- ARV discount +11.5/15.0
- DSCR +5.8/10.0
- 1% rule +4.5/10.0
- Livability +4.0/5.0
- Rent growth +3.4/5.0
- Condition / age +2.5/5.0
- Schools +1.7/10.0
- Appreciation +0.0/10.0
$143,500
🖨 Deal sheet 📄 Offer letter ✓ Due diligence
Listing remarks MLS
Investor special! Rented at $1,425 per month with a month-to-month tenant. This Cape Cod features three bedrooms, an updated, fully applianced kitchen, and a modernized bathroom. It also boasts refinished hardwood floors and a full basement. Curb offers only. Property to be transferred in 'as is' condition.
Key facts
- Updated roof
- Updated furnace
- Updated bathroom
Tags
Neighborhood map
What this means for you Summary
Snapshot
- This is a 3-bed/1.0-bath single-family listed at $144k.
Deal economics
- At list price, monthly cash flow is $135 ($2k/yr) — positive.
- The deal already cash-flows at list — no discount required.
- To meet the 1% rule (rent ≥ 1% of price), the offer needs to be $136k (5.0% below list).
- Recommended offer: $135k (6.0% below list) — sets the bar for market timing.
- Cap rate 7.4% vs local median 3.8% in Columbus — top-decile yield for the area; either an underpriced asset or a hidden risk that comps aren't pricing in. Stress-test before assuming the spread holds.
Location & tenants
- Location reads 81/100 on livability (#97 in OH, #1,491 nationally) — a professional / high-income tenant draw. Strengths: commute A+, cost of living A+, housing A+; Watch: employment C-, crime F.
- Columbus City School District (urban): math 15% / reading 26% proficiency, ranked #626 of 656 in OH (top 95%) — low school quality limits family demand, transient renter base, plan for 1-2y turnover; 72% free/reduced lunch — lower-income household profile, screen leases tightly.
- Market conditions: Rents rising (+3.4%/yr); 166 active listings in the ZIP; 40 comparable units currently listed for rent nearby; rentals at typical pace (median 24d on market — plan ~3-4 weeks tenant-placement turnaround); 45% of comp listings sitting > 30 days — soft ceiling on asking rent; lower-income renter base — watch delinquency; 8,139 units permitted in Franklin County in 2024 (5,940 in 5+ unit buildings).
- This rent runs 38% of the median local income ($43k/yr) — at the standard rent-burdened threshold; future hikes will face affordability resistance.
Forward outlook
- Local home prices are declining (-3.0%/yr); year-one equity from $992 of loan paydown is wiped out by about $4k of value loss. Plan a longer hold.
- Franklin County population projected at +34% by 2050 — long-run rental-demand tailwind backs the buy-and-hold thesis.
Negotiation context
- It's been on market 86 days — a 6% lower offer ($135k) is reasonable based on typical stale-listing flexibility.
- 8 sale attempts since 20y ago with the ask held roughly flat each time — persistent listings suggest the price (not the market) is what's stuck; bring a comps-based counter.
Risks & watch-outs
- Watch-outs: built in 1951 — expect roof / HVAC / electrical / plumbing capex.
Questions for the listing agent
- It's been on market 86 days. Have you received any prior offers? Is the seller open to a 6% concession, seller financing, or rate buy-down credit?
- Built in 1951 — when were the roof, HVAC, electrical panel, plumbing, and water heater last replaced?
- Why hasn't it sold? Are there any deal-killer items the seller is aware of (foundation, flood, title, zoning, code violations)?
- Is there a deadline driving the sale (1031 exchange, divorce, estate, relocation)? That informs how much negotiation room exists.
- Crime grade is F in this area — have there been break-ins, vandalism, or insurance claims at this property in the last 3 years? What carrier currently insures it and at what premium?
- What's the average days-on-market for RENTAL listings here right now (not sales)? A rising rental-DOM trend means longer vacancies and softer asking-rent achievability than the comps imply.
- What's the recent tenant-quality profile in this submarket — average credit score on applications, eviction rate, late-payment / NSF rate, and stable-employment percentage? A property-management company in the area should have these aggregated.
- How much new for-sale + rental construction is in the pipeline within 1–3 miles? Heavy new supply typically softens prices + rents 12–24 months out; constrained supply supports both.
Investment metrics
- 1% rule
- 0.95% ✗
- Cap rate
- 7.42%
- Cash-on-cash
- 4.02%
- DSCR
- 1.18
- GRM
- 8.8
CMA / ARV
- ARV (median comp)
- $157,328
- List price
- $143,500
- Delta
- -8.79%
- Verdict
- FAIR
- Comps
- 20 within 1.0 mi
Show comp detail 12 sales within ~0.75 mi
| Address | Dist | Beds/Ba | Sqft | Sold | Price | $/sf | Match |
|---|---|---|---|---|---|---|---|
| 2610 Atwood Ter | 0.06mi | 3/1.0 | 979 (+7%) | 1mo | $176,500 | $180 | 85 |
| 2728 Atwood Ter | 0.18mi | 3/1.0 | 979 (+7%) | 1mo | $170,000 | $174 | 79 |
| 2559 Hamilton Ave | 0.40mi | 3/1.5 | 919 (+0%) | 1mo | $140,000 | $152 | 78 |
| 2459 Atwood Ter | 0.22mi | 2/2.0 (-1) | 936 (+2%) | 2mo | $175,000 | $187 | 75 |
| 2888 Howey Rd | 0.43mi | 3/1.0 | 842 (-8%) | 1mo | $180,500 | $214 | 66 |
| 2752 Azelda St | 0.19mi | 2/1.0 (-1) | 792 (-13%) | 1mo | $150,000 | $189 | 63 |
| 2205 Atwood Ter | 0.59mi | 3/1.0 | 979 (+7%) | 1mo | $189,900 | $194 | 59 |
| 2498 Renwood Pl | 0.38mi | 3/1.0 | 1,043 (+14%) | 1mo | $210,000 | $201 | 58 |
| 1397 Melrose Ave | 0.72mi | 3/1.0 | 861 (-6%) | 1mo | $140,000 | $163 | 56 |
| 2873 Ontario St | 0.68mi | 3/1.0 | 979 (+7%) | 2mo | $231,900 | $237 | 55 |
| 3016 Mcguffey Rd | 0.68mi | 3/2.0 | 840 (-8%) | 2mo | $194,000 | $231 | 49 |
| 1398 Manchester Ave | 0.69mi | 2/1.0 (-1) | 820 (-10%) | 0mo | $255,000 | $311 | 46 |
Match score weights: distance 35% · size 25% · config 20% · recency 20%. Top-matched comps best support the ARV.
Projected returns pro-forma
-3.0% appreciation · 3.41% rent growth · sell at horizon
- IRR
- -9.6%
- Equity multiple
- 0.65×
- Total profit
- $-14,122
- Equity at exit
- $21,396
- IRR
- 0.4%
- Equity multiple
- 1.03×
- Total profit
- $1,043
- Equity at exit
- $12,407
Cash invested: $40,180 (down + closing). Projections, not guarantees.
Landlord ↔ Tenant lean methodology
- Overall (STATE)
- 73 Landlord-Friendly
- State Ohio
- 73 Landlord-Friendly · R+6
- County
- — inherits STATE
- City
- — inherits STATE
ZIP-level market 43211
- Home prices YoY
- -27.3%
- Rents YoY
- 3.4%
- Active inventory
- 166
- Price-to-rent
- 8.8×
Monthly cashflow live
- Estimated rent
- $1,364 high interval (Pro) →
- Mortgage (P&I)
- −$753
- Tax from tax record
- −$130 /mo · $1,563/yr
- Insurance
- −$60
- HOA
- −$0
- Vacancy / Maint / Mgmt
- −$286
- Net cashflow
- $135
Break-even live
UW: 25.0% down · 7.5% · 30yr · 1.5% tax · 5.0% vac · 8.0% maint · 8.0% mgmt
Financing live
Cash to close
- Down payment
- $35,875
- Closing costs
- $4,305
- Reserves months
- —
- Total cash needed
- —
Loan-product check · same deal, 3 products live
Conventional
25% down · 7.5% · 30yr
- Down + closing
- —
- Monthly P&I
- —
- Monthly cashflow
- —
- DSCR
- —
- Eligible?
- —
Personal DTI + credit; lowest rate.
DSCR
20% down · 8.5% · 30yr
- Down + closing
- —
- Monthly P&I
- —
- Monthly cashflow
- —
- DSCR
- —
- Eligible?
- —
No personal income docs; deal must DSCR.
Hard money
10% down · 12.0% · 12mo
- Down + closing
- —
- Monthly P&I
- —
- Monthly cashflow
- —
- DSCR
- —
- Eligible?
- —
Short-term bridge; refi at stabilization.
Rent comps 40 comps
| Address | Beds | Baths | Sqft | Rent | $/sqft | DOM | Units | Dist |
|---|---|---|---|---|---|---|---|---|
| 2566 Atwood Ter Columbus, OH | 3.0 | 1.0 | 979 | $1,500 | $1.53 | 23d | 1 | 0.10mi |
| 2767 Hiawatha St Columbus, OH | 3.0 | 1.0 | 896 | $1,475 | $1.65 | 7d | 1 | 0.19mi |
| 2459 Atwood Ter Columbus, OH | 2.0 | 2.0 | 936 | $1,650 | $1.76 | 43d | 1 | 0.25mi |
| 2459 Hiawatha St Columbus, OH | 2.0 | 1.0 | 810 | $1,025 | $1.27 | 43d | 1 | 0.27mi |
| 2472 Pontiac St Columbus, OH | 2.0 | 1.0 | 754 | $995 | $1.32 | 3d | 1 | 0.29mi |
| 2472 Pontiac St Columbus, OH | 2.0 | 1.0 | 754 | $995 | $1.32 | 14d | 1 | 0.29mi |
| 870 Melrose Ave Columbus, OH | 2.0 | 1.0 | 732 | $1,345 | $1.84 | 7d | 1 | 0.45mi |
| 2530 Beulah Rd Columbus, OH | 2.0 | 1.0 | 720 | $1,345 | $1.87 | 14d | 1 | 0.46mi |
| 2942 Atwood Ter Columbus, OH | 2.0 | 1.0 | 962 | $1,200 | $1.25 | 43d | 1 | 0.46mi |
| 1269 Minnesota Ave Columbus, OH | 3.0 | 1.0 | 1075 | $1,550 | $1.44 | 7d | 1 | 0.47mi |
| 2980 Reis Ave Columbus, OH | 2.0 | 1.0 | 840 | $1,099 | $1.31 | 43d | 1 | 0.53mi |
| 2299 Hamilton Ave Columbus, OH | 2.0 | 1.0 | 1000 | $1,200 | $1.20 | 43d | 1 | 0.56mi |
| 2236 Atwood Ter Columbus, OH | 2.0 | 1.0 | 720 | $900 | $1.25 | 7d | 1 | 0.57mi |
| 2217 Grasmere Ave Columbus, OH | 2.0 | 1.5 | 720 | $1,650 | $2.29 | 14d | 1 | 0.60mi |
| 2203-2205 Mcguffey Rd Columbus, OH | 2.0 | 1.0 | 836 | $1,050 | $1.26 | 23d | 1 | 0.63mi |
| 967 Duxberry Ave Columbus, OH | 3.0 | 1.0 | 864 | $1,100 | $1.27 | 43d | 1 | 0.69mi |
| 3054 McGuffey Rd Columbus, OH | 3.0 | 1.0 | 1106 | $1,450 | $1.31 | 43d | 1 | 0.71mi |
| 3086-3092 Grasmere Ave Unit 3088 Columbus, OH | 2.0 | 1.0 | 800 | $1,000 | $1.25 | 23d | 1 | 0.72mi |
| 3088 Grasmere Ave Columbus, OH | 2.0 | 1.0 | 800 | $1,000 | $1.25 | 23d | 1 | 0.72mi |
| 1352 E Hudson St Columbus, OH | 2.0 | 1.0 | 800 | $1,150 | $1.44 | 43d | 1 | 0.73mi |
| 3120 Grasmere Ave Columbus, OH | 2.0 | 1.0 | 842 | $1,395 | $1.66 | 3d | 1 | 0.77mi |
| 2176 Ontario St Columbus, OH | 4.0 | 2.0 | 1066 | $1,650 | $1.55 | 23d | 1 | 0.77mi |
| 1435 Republic Ave Columbus, OH | 3.0 | 1.0 | 908 | $1,395 | $1.54 | 7d | 1 | 0.78mi |
| 1435 Republic Ave Columbus, OH | 3.0 | 1.0 | 908 | $1,425 | $1.57 | 19d | 1 | 0.78mi |
| 780 E Brighton Rd Columbus, OH | 3.0 | 1.0 | 1086 | $1,500 | $1.38 | 7d | 1 | 0.80mi |
| 3137 Mcguffey Rd Columbus, OH | 2.0 | 1.0 | 950 | $950 | $1.00 | 43d | 1 | 0.81mi |
| 3199 Maize Rd Columbus, OH | 2.0 | 1.0 | 800 | $1,150 | $1.44 | 23d | 1 | 0.82mi |
| 1524 Genessee Ave Unit A Columbus, OH | 2.0 | 1.0 | 800 | $1,150 | $1.44 | 3d | 1 | 0.84mi |
| 1011 Mohican Ave Columbus, OH | 3.0 | 1.0 | 1091 | $1,399 | $1.28 | 43d | 1 | 0.85mi |
| 2872 Indianola Ave Columbus, OH | 3.0 | 1.0 | 1000 | $1,799 | $1.80 | 43d | 1 | 0.85mi |
| 1530 Genessee Ave Unit B Columbus, OH | 2.0 | 1.0 | 800 | $1,150 | $1.44 | 3d | 1 | 0.85mi |
| 335 E Duncan St Columbus, OH | 3.0 | 1.0 | 1120 | $1,595 | $1.42 | 43d | 1 | 0.90mi |
| 2658 Deming Ave Columbus, OH | 3.0 | 1.0 | 1120 | $1,695 | $1.51 | 43d | 1 | 0.90mi |
| 1576-1578 Arlington Ave Unit 1576 Columbus, OH | 2.0 | 1.0 | 902 | $1,000 | $1.11 | 43d | 1 | 0.93mi |
| 260 E Hudson St Unit 274 Columbus, OH | 2.0 | 1.0 | 1000 | $1,325 | $1.32 | 2d | 1 | 0.99mi |
| 2688 Hibbert Ave Columbus, OH | 2.0 | 1.0 | 748 | $1,195 | $1.60 | 43d | 1 | 1.02mi |
| 482 E Norwich Ave Unit D Columbus, OH | 2.0 | 1.0 | 1100 | $1,100 | $1.00 | 43d | 1 | 1.03mi |
| 464 E Norwich Ave Unit D Columbus, OH | 2.0 | 1.0 | 1100 | $1,100 | $1.00 | 17d | 1 | 1.04mi |
| 460 E Norwich Ave Unit 460-C Columbus, OH | 2.0 | 1.0 | 650 | $1,025 | $1.58 | 43d | 1 | 1.04mi |
| 450 E Norwich Ave Unit 450-C Columbus, OH | 2.0 | 1.0 | 650 | $995 | $1.53 | 43d | 1 | 1.05mi |
Listing history 35 events
-
2026-06-18days on market $143,500 Active 86 DOM
-
2026-06-17days on market $143,500 Active 85 DOM
-
2026-06-16days on market $143,500 Active 84 DOM
-
2026-06-15days on market $143,500 Active 83 DOM
-
2026-06-13days on market $143,500 Active 81 DOM
-
2026-06-13days on market $143,500 Active 80 DOM
-
2026-06-09days on market $143,500 Active 77 DOM
-
2026-06-08days on market $143,500 Active 76 DOM
-
2026-06-07days on market $143,500 Active 75 DOM
-
2026-06-05remarks 400-char remark
-
2026-06-05pricestatusdays on market $143,500 Active 72 DOM
-
2026-06-03days on market $147,000 Contingent 28 DOM
-
2026-06-02days on market $147,000 Contingent 27 DOM
-
2026-06-01days on market $147,000 Contingent 26 DOM
-
2026-05-31days on market $147,000 Contingent 25 DOM
-
2026-05-17historical Contingent 308-char remark
Show marketing remark (308 chars)
Investor special! Rented at $1,425 per month with a month-to-month tenant. This Cape Cod features three bedrooms, an updated, fully applianced kitchen, and a modernized bathroom. It also boasts refinished hardwood floors and a full basement. Curb offers only. Property to be transferred in 'as is' condition.
-
2026-05-06$147,000 Active 308-char remark
Show marketing remark (308 chars)
Investor special! Rented at $1,425 per month with a month-to-month tenant. This Cape Cod features three bedrooms, an updated, fully applianced kitchen, and a modernized bathroom. It also boasts refinished hardwood floors and a full basement. Curb offers only. Property to be transferred in 'as is' condition.
-
2026-03-20$143,500 Active 400-char remark
Show marketing remark (400 chars)
3 bedroom 1 bath with updated roof (2018), furnace (2022) and bathroom (2024). Large fenced backyard with a 1 car garage. This property is tenant occupied and the current lease ends 8-7-26. Tenant pays $1425 a month (non section 8) and has always paid on time with no problems. The tenant pays all utilities, covers lawn care and property has onsite washer and dryer for tenants. * Curb offers only *
-
2024-01-12soldstatus $140,000
-
2024-01-10soldstatus $140,000 Closed
-
2023-12-12status Pending
-
2023-12-01$149,000 Active
-
2019-11-27soldstatus $49,000
-
2018-01-12historical
-
2017-12-27$27,950 Active
-
2008-06-07historical
-
2008-04-21$44,500
-
2008-04-18historical
-
2007-08-24$49,900
-
2007-08-23historical
-
2007-07-18$59,000
-
2006-10-05historical
-
2006-08-01$73,000
-
1990-10-11soldstatus $45,900
-
1986-08-28soldstatus $39,500
ⓘ Source: listings_history table (triggers on properties + properties_extension) + one-shot
backfill from property_details.listing_events for pre-trigger history.
Tax reassessment forecast OH · Partial reset (capped growth)
- Current annual tax
- $1,563 · $130/mo
- Projected year-2 tax
- $1,901 · $158/mo
- Expected delta
- +$338/yr (+$28/mo · 21.6%)
ⓘ Screening estimate from a state-policy table — verify with the county assessor before closing.
Climate risk First Street
- Flood 1/10 Low FEMA zone X (unshaded) · 0% chance over 30 yrs
- Wildfire 1/10 Low
- Heat 3/10 Moderate 6 d/yr ≥100°F today · 16 d/yr by 30 yrs out
- Wind 2/10 Low 100% chance of damaging wind over 30 yrs
- Air quality 3/10 Moderate 2 unhealthy d/yr today · 4 by 30 yrs out
Nearby sold comps map
Loading sold comps map…
Walkable amenities ~0.75 mi
Loading nearby amenities…
Taxation est. · year 1
- Rental income
- $16,362
- − Mortgage interest
- −$8,038
- − Property taxes
- −$1,563
- − Insurance
- −$718
- − Repairs & maintenance
- −$1,309
- − Management
- −$1,309
- − Depreciation
- −$4,175
- Taxable loss
- −$749
- Est. tax savings @ 24.0%
- +$180
- After-tax cash flow
- $1,795/yr
For passive investors: Depreciation is non-cash, so a rental often shows a tax loss while cash-flowing — sheltering income. Rental losses are passive: they offset passive income freely, and up to $25,000/yr can offset ordinary (W-2) income if you actively participate and your MAGI is under $100k (phasing out to $0 by $150k); unused losses carry forward. On sale, claimed depreciation is recaptured at up to 25%, and gains may owe capital-gains tax (a 1031 exchange can defer both). Figures are a year-1 estimate at your 24.0% rate — not tax advice; consult a CPA.
Schools (NCES district)
- District
- Columbus City School District
- NCES district ID
- 3904380
- Math proficiency
- 15% ▼ -17.00%
- Reading proficiency
- 26% ▼ -12.00%
- Median HH income
- $38,483
- Composite
- 17.19/100
- National rank
- #9105
- State rank
- #626 of 656 in OH
Livability — Columbus
- Score
- 81/100
- State rank
- #97
- US rank
- #1491
Category grades
Schools grade is shown separately in the Schools card above.
Census & demographics
- Census place
- Columbus, OH
- County
- Franklin County · 1,351,780 people
- City population
- 612,189
- Metro
- Columbus, OH
- Population (ZIP)
- 22,313
- Household income
- $42,579
- Rent vs Own
- Severe rent burden
- 1282.0
Population outlook (Franklin County) Hauer SSP2
- Today (2025)
- 1,456,139 people
- By 2030
- 1,556,890 · +6.9%
- By 2040
- 1,757,349 · +20.7%
- By 2050
- 1,950,539 · +34.0%
- By 2075
- 2,376,171 · +63.2%
- By 2100
- 2,636,796 · +81.1%
Race, ethnicity, and origin ACS 2023
- Neighborhood character
- Diverse neighborhood (Simpson 0.60)
- Race & ethnicity
- Black 58% White 21% Hispanic / Latino 13% Two or more races 12% Asian 2%
- Hispanic origin (detail)
- Mexican 8% Dominican 1%
- Common ancestry
- Italian 1%
- Foreign-born
- 10% · Canada, India
- Languages at home
- 84% English-only · Spanish 11% Other Indo-European 2% Arabic 1%
Political lean MEDSL · Franklin
- 2024 margin
- Strong D (+28.4) · D 63.7% · R 35.3% · Other 1.0%
- 2008→2024 swing
- +7.7pp toward D · 2008: 20.7pp · 2024: 28.4pp
- All cycles
- 2024: D+28.4 2020: D+31.4 2016: D+25.9 2012: D+21.7 2008: D+20.7
Not yet ingested
- Civics
- —
Market trends
- HPI YoY
- ▼ -94.10%
- Current HPI
- 250.3885
- Rent YoY
- ▲ 3.41%
- Metro
- Columbus, OH
- State GDP YoY
- ▲ 1.98%
- F500 in state
- 48
Industry mix (Fortune 500 HQ in OH)
| Industry | F500 HQs | Revenue |
|---|---|---|
| Insurance | 3 | $145B |
|
||
| Industrial Machinery | 3 | $49B |
|
||
| Financial Services | 3 | $24B |
|
||
| Consumer Goods | 2 | $93B |
|
||
| Aerospace / Defense | 2 | $47B |
|
||
| Utilities | 2 | $33B |
|
||
Price history
+272.2% since first listed20 events — show timeline
- 2026-05-17 Contingent — CBRMLS
- 2026-05-06 Listed $147,000 CBRMLS
- 2026-03-20 Listed $143,500 Fizber.com
- 2024-01-12 Sold (Public Records) $140,000 Public Records
- 2024-01-10 Sold (MLS) $140,000 CBRMLS
- 2023-12-12 Pending — CBRMLS
- 2023-12-01 Listed $149,000 CBRMLS
- 2019-11-27 Sold (Public Records) $49,000 Public Records
- 2018-01-12 Listing Removed — CBRMLS
- 2017-12-27 Listed $27,950 CBRMLS
- 2008-06-07 Listing Removed — CBRMLS
- 2008-04-21 Listed $44,500 CBRMLS
- 2008-04-18 Listing Removed — CBRMLS
- 2007-08-24 Listed $49,900 CBRMLS
- 2007-08-23 Listing Removed — CBRMLS
- 2007-07-18 Listed $59,000 CBRMLS
- 2006-10-05 Listing Removed — CBRMLS
- 2006-08-01 Listed $73,000 CBRMLS
- 1990-10-11 Sold (Public Records) $45,900 Public Records
- 1986-08-28 Sold (Public Records) $39,500 Public Records
Property tax history
+3.7%/yrLatest (2024): $1,563 · +1.3% YoY. Source: county tax records.
Cash-flow waterfall
monthlySold comps — $/sqft
last 12 mo · ≤1 miLoading sold comps…