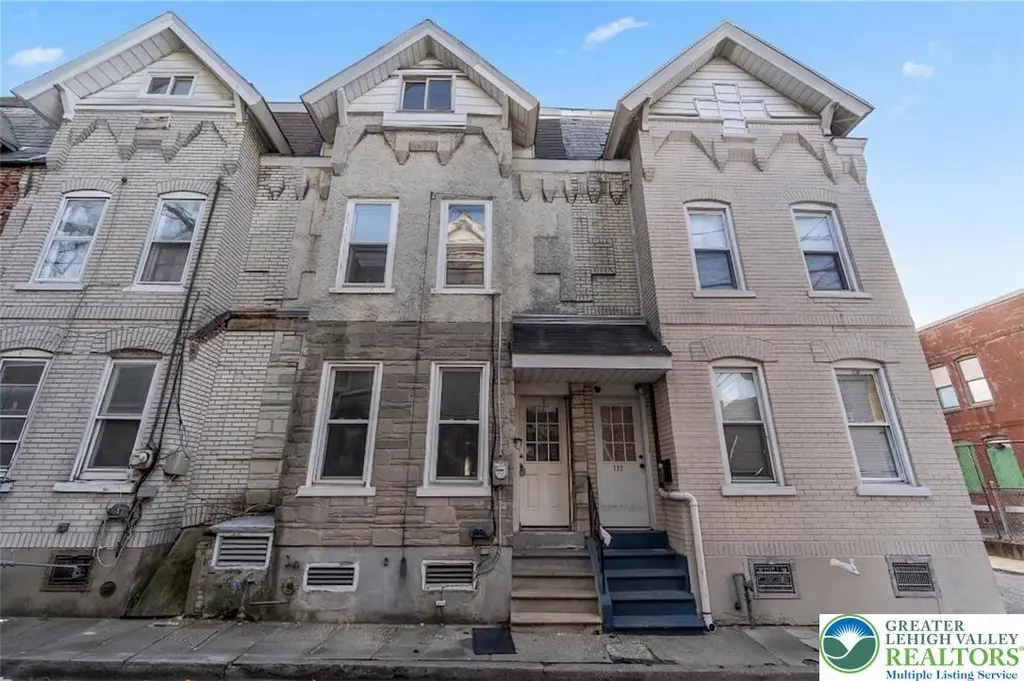
120 N Poplar St · Allentown, PA
Flood risk 1/10 · Minimal
- FEMA flood zone
- X (unshaded)
- Chance of flooding over 30 yrs
- 0.0%
- Est. flood insurance / yr
- $473 – $860
Fire risk 1/10 · Minimal
- Est. fire insurance / yr
- $511 – $949
Heat risk 5/10 · Moderate
- Hot days now (above 99°F)
- 7 days/yr
- Hot days in 30 yrs
- 15 days/yr
Wind risk 4/10 · Minor
- Chance of severe wind over 30 yrs
- 15.0%
Air-quality risk 3/10 · Minor
- Unhealthy air days now
- 3 days/yr
- Unhealthy air days in 30 yrs
- 4 days/yr
Risk factors via First Street. Map © Google.
Why this score? — see what drove the B- grade
The composite is a weighted blend of 9 inputs, each scored 0–100. Each bar is that input's sub-score; the figure is the points it added to the 100-point composite (weight × sub-score).
- Cash flow +27.2/30.0
- ARV discount +12.1/15.0
- DSCR +9.5/10.0
- 1% rule +7.0/10.0
- Livability +4.0/5.0
- Rent growth +3.9/5.0
- Condition / age +2.5/5.0
- Schools +1.2/10.0
- Appreciation +0.0/10.0
$164,900
🖨 Deal sheet 📄 Offer letter ✓ Due diligence
Listing remarks MLS
* * Very Competitive Price Improvement Made * * Excellent Investment Opportunity in the Heart of this Emerging City! Nestled on a less traveled street, surrounded by the rich history of Old Allentown and the exciting variety of new hotels, restaurants and entertainment all within a short distance. Parks, the public library and excellent access to public transportation all add to the appeal for renters or owner occupied. This home features very spacious rooms and plenty of opportunity to make equity building improvements. Being sold as is, this home is a great addition to your portfolio and chance to show off your contractor skills. ROI Inspection done in March 2026 listing agent will provide upon request. CO will be ordered and will be Buyer's responsibility to obtain a clear CO. (some photos enhanced virtually to show potential)
Key facts
- Built 1895
- Listed 56 days
Neighborhood map
What this means for you Summary
Snapshot
- This is a 3-bed/1.0-bath townhouse listed at $165k.
Deal economics
- At list price, monthly cash flow is $473 ($6k/yr) — positive.
- The deal already cash-flows at list — no discount required.
- Meets the 1% rule at list price ($2k rent vs $165k).
- Recommended offer: $160k (3.0% below list) — sets the bar for market timing.
- Cap rate 9.7% vs local median 5.3% in Allentown — top-decile yield for the area; either an underpriced asset or a hidden risk that comps aren't pricing in. Stress-test before assuming the spread holds.
Location & tenants
- Location reads 81/100 on livability (#171 in PA, #1,440 nationally) — a professional / high-income tenant draw. Strengths: commute A+, cost of living A+, housing A+; Watch: schools D+, employment D.
- Allentown City SD (urban): math 10% / reading 20% proficiency, ranked #513 of 539 in PA (top 95%) — low school quality limits family demand, transient renter base, plan for 1-2y turnover; 73% free/reduced lunch — lower-income household profile, screen leases tightly.
- Market conditions: Rents rising fast (+5.5%/yr); 167 active listings in the ZIP; 40 comparable units currently listed for rent nearby; rentals at typical pace (median 19d on market — plan ~3-4 weeks tenant-placement turnaround); lower-income renter base — watch delinquency; 765 units permitted in Lehigh County in 2024 (286 in 5+ unit buildings).
- At $1,972/mo this rent would consume 55% of the median local household income ($43k/yr) (locally 4313% of renters already pay >50% of income on rent) — very limited rent-growth headroom before tenants either downsize or default.
Forward outlook
- Local home prices are declining (-3.0%/yr); year-one equity from $1k of loan paydown is wiped out by about $5k of value loss. Plan a longer hold.
- Lehigh County population projected at +21% by 2050 — long-run rental-demand tailwind backs the buy-and-hold thesis.
- At projected returns (-3.0% appreciation + 5.5% rent growth), your $46k cash investment doubles in ~8 years — after that, you're playing with house money.
Negotiation context
- It's been on market 57 days — a 3% lower offer ($160k) is reasonable based on typical stale-listing flexibility.
- 6 sale attempts since 20y ago; this cycle's ask has dropped $10k (6%) from the opening price — seller is motivated, your offer sets the floor, not the list.
Risks & watch-outs
- Watch-outs: built in 1895 — expect roof / HVAC / electrical / plumbing capex.
- Climate carrying-cost: extreme-heat days projected 7→15/yr by 2055 (HVAC capex compounding) — expect insurance premiums to compound above CPI over the hold.
Questions for the listing agent
- It's been on market 57 days. Have you received any prior offers? Is the seller open to a 3% concession, seller financing, or rate buy-down credit?
- Built in 1895 — when were the roof, HVAC, electrical panel, plumbing, and water heater last replaced?
- Is there a deadline driving the sale (1031 exchange, divorce, estate, relocation)? That informs how much negotiation room exists.
- Schools are D-rated, which usually means shorter tenancies and higher turnover. Who's the typical renter profile here, and what's been the actual vacancy rate?
- What's the average days-on-market for RENTAL listings here right now (not sales)? A rising rental-DOM trend means longer vacancies and softer asking-rent achievability than the comps imply.
- What's the recent tenant-quality profile in this submarket — average credit score on applications, eviction rate, late-payment / NSF rate, and stable-employment percentage? A property-management company in the area should have these aggregated.
- How much new for-sale + rental construction is in the pipeline within 1–3 miles? Heavy new supply typically softens prices + rents 12–24 months out; constrained supply supports both.
Investment metrics
- 1% rule
- 1.20% ✓
- Cap rate
- 9.73%
- Cash-on-cash
- 12.28%
- DSCR
- 1.55
- GRM
- 7.0
CMA / ARV
- ARV (median comp)
- $183,884
- List price
- $164,900
- Delta
- -10.32%
- Verdict
- UNDERPRICED
- Comps
- 20 within 1.0 mi
Show comp detail 12 sales within ~0.75 mi
| Address | Dist | Beds/Ba | Sqft | Sold | Price | $/sf | Match |
|---|---|---|---|---|---|---|---|
| 215 N 10th St | 0.19mi | 4/2.0 (+1) | 1,590 (+4%) | 1mo | $267,000 | $168 | 75 |
| 318 N Lumber | 0.39mi | 4/1.0 (+1) | 1,440 (-6%) | 2mo | $132,000 | $92 | 65 |
| 1029 W Allen St | 0.48mi | 3/1.5 | 1,392 (-9%) | 2mo | $210,000 | $151 | 59 |
| 1042 W Allen St | 0.45mi | 3/2.5 | 1,414 (-8%) | 2mo | $223,000 | $158 | 58 |
| 1109 W Washington | 0.69mi | 3/1.5 | 1,624 (+6%) | 2mo | $251,500 | $155 | 55 |
| 616 N 12th St | 0.50mi | 3/2.0 | 1,380 (-10%) | 1mo | $230,000 | $167 | 55 |
| 634 N New St | 0.55mi | 4/1.0 (+1) | 1,391 (-9%) | 2mo | $216,000 | $155 | 52 |
| 613 W Allen St | 0.74mi | 4/1.5 (+1) | 1,480 (-4%) | 1mo | $220,000 | $149 | 52 |
| 638 N 12th St | 0.54mi | 4/2.0 (+1) | 1,704 (+11%) | 2mo | $262,000 | $154 | 46 |
| 816 W Allen St | 0.58mi | 4/2.0 (+1) | 1,328 (-14%) | 0mo | $165,000 | $124 | 41 |
| 226 N 16th St | 0.55mi | 4/2.0 (+1) | 1,758 (+14%) | 0mo | $310,000 | $176 | 41 |
| 732 N 10th St | 0.64mi | 4/1.5 (+1) | 1,310 (-15%) | 1mo | $245,000 | $187 | 38 |
Match score weights: distance 35% · size 25% · config 20% · recency 20%. Top-matched comps best support the ARV.
Projected returns pro-forma
-3.0% appreciation · 5.48% rent growth · sell at horizon
- IRR
- 4.6%
- Equity multiple
- 1.18×
- Total profit
- $8,415
- Equity at exit
- $24,587
- IRR
- 16.2%
- Equity multiple
- 2.47×
- Total profit
- $67,839
- Equity at exit
- $14,258
Cash invested: $46,172 (down + closing). Projections, not guarantees.
Landlord ↔ Tenant lean methodology
- Overall (STATE)
- 62 Landlord-Friendly
- State Pennsylvania
- 62 Landlord-Friendly · EVEN
- County
- — inherits STATE
- City
- — inherits STATE
ZIP-level market 18102
- Rents YoY
- 5.5%
- Active inventory
- 167
- Price-to-rent
- 7.0×
Monthly cashflow live
- Estimated rent
- $1,972 high interval (Pro) →
- Mortgage (P&I)
- −$865
- Tax from tax record
- −$152 /mo · $1,823/yr
- Insurance
- −$69
- HOA
- −$0
- Vacancy / Maint / Mgmt
- −$414
- Net cashflow
- $473
Break-even live
UW: 25.0% down · 7.5% · 30yr · 1.5% tax · 5.0% vac · 8.0% maint · 8.0% mgmt
Financing live
Cash to close
- Down payment
- $41,225
- Closing costs
- $4,947
- Reserves months
- —
- Total cash needed
- —
Loan-product check · same deal, 3 products live
Conventional
25% down · 7.5% · 30yr
- Down + closing
- —
- Monthly P&I
- —
- Monthly cashflow
- —
- DSCR
- —
- Eligible?
- —
Personal DTI + credit; lowest rate.
DSCR
20% down · 8.5% · 30yr
- Down + closing
- —
- Monthly P&I
- —
- Monthly cashflow
- —
- DSCR
- —
- Eligible?
- —
No personal income docs; deal must DSCR.
Hard money
10% down · 12.0% · 12mo
- Down + closing
- —
- Monthly P&I
- —
- Monthly cashflow
- —
- DSCR
- —
- Eligible?
- —
Short-term bridge; refi at stabilization.
Rent comps 40 comps
| Address | Beds | Baths | Sqft | Rent | $/sqft | DOM | Units | Dist |
|---|---|---|---|---|---|---|---|---|
| 1210 W Turner St Unit 2 Allentown, PA | 2.0 | 2.0 | 1500 | $1,900 | $1.27 | 2d | 1 | 0.08mi |
| 1210 W Turner St Unit 2 Allentown, PA | 2.0 | 2.0 | 1500 | $2,150 | $1.43 | 23d | 1 | 0.08mi |
| 1210 W Turner St Unit 1 Allentown, PA | 2.0 | 2.0 | 1200 | $1,800 | $1.50 | 2d | 1 | 0.08mi |
| 1210 W Turner St Unit 1 Allentown, PA | 2.0 | 2.0 | 1200 | $2,050 | $1.71 | 23d | 1 | 0.08mi |
| 1210 W Turner St Unit 2 Allentown, PA | 2.0 | 2.0 | 1500 | $2,400 | $1.60 | 43d | 1 | 0.08mi |
| 1210 W Turner St Unit 1 Allentown, PA | 2.0 | 2.0 | 1200 | $2,300 | $1.92 | 43d | 1 | 0.08mi |
| 1039 E St Unit Linden St unit Apt Allentown, PA | 2.0 | 1.0 | 1200 | $1,500 | $1.25 | 23d | 1 | 0.10mi |
| 1036 Linden St #2 Allentown, PA | 2.0 | 1.0 | 1200 | $1,600 | $1.33 | 2d | 1 | 0.13mi |
| 1010 W Hamilton St Allentown, PA | 1.0–2.0 | 1.0–2.0 | 943 | $2,022 | $2.14 | 2d | 6 | 0.23mi |
| 932 W Hamilton St Allentown, PA | 2.0 | 1.0–2.0 | 862 | $2,350 | $2.73 | 2d | 15 | 0.30mi |
| 948 W Maple St Allentown, PA | 4.0 | 1.0 | 1932 | $2,300 | $1.19 | 43d | 1 | 0.30mi |
| 944 W Gordon St Allentown, PA | 3.0 | 1.5 | 1146 | $1,750 | $1.53 | 23d | 1 | 0.32mi |
| 1332 W Gordon St Allentown, PA | 3.0 | 2.0 | 1236 | $1,050 | $0.85 | 43d | 1 | 0.33mi |
| 832 Chestnut St Allentown, PA | 3.0 | 1.0 | 1124 | $2,100 | $1.87 | 23d | 1 | 0.34mi |
| 829 Linden St Apt 1 Rear Allentown, PA | 2.0 | 2.0 | 1200 | $1,495 | $1.25 | 23d | 1 | 0.35mi |
| 144 S 12th St Allentown, PA | 4.0 | 2.0 | 1242 | $2,000 | $1.61 | 2d | 1 | 0.35mi |
| 827 Linden St Unit 829-1 Allentown, PA | 2.0 | 2.0 | 1200 | $1,495 | $1.25 | 21d | 1 | 0.35mi |
| 1437 Webster St Allentown, PA | 3.0 | 1.0 | 1080 | $1,475 | $1.37 | 43d | 1 | 0.36mi |
| 835 Hamilton St Unit 509 Allentown, PA | 2.0 | 2.0 | 1052 | $2,399 | $2.28 | 19d | 1 | 0.36mi |
| 835 Hamilton St Unit 424 Allentown, PA | 2.0 | 2.0 | 1411 | $2,625 | $1.86 | 14d | 1 | 0.37mi |
| 835 Hamilton St Unit 409 Allentown, PA | 2.0 | 2.0 | 1052 | $2,374 | $2.26 | 19d | 1 | 0.37mi |
| 835 Hamilton St Unit 608 Allentown, PA | 2.0 | 2.0 | 1411 | $2,725 | $1.93 | 14d | 1 | 0.37mi |
| 221 N 15th St Unit 2 Allentown, PA | 3.0 | 1.0 | 1200 | $1,775 | $1.48 | 2d | 1 | 0.40mi |
| 1338 W Liberty St Allentown, PA | 4.0 | 1.0 | 1526 | $2,000 | $1.31 | 14d | 1 | 0.41mi |
| 828 W Gordon St Allentown, PA | 4.0 | 2.5 | 1628 | $2,250 | $1.38 | 2d | 1 | 0.42mi |
| 1425 W Gordon St Allentown, PA | 3.0 | 2.0 | 1200 | $2,200 | $1.83 | 43d | 1 | 0.42mi |
| 209 N Eighth St Apt 2 Allentown, PA | 3.0 | 1.0 | 1430 | $1,550 | $1.08 | 43d | 1 | 0.43mi |
| 216 S 14th St Allentown, PA | 4.0 | 1.5 | 1640 | $2,300 | $1.40 | 2d | 1 | 0.48mi |
| 626 N 11th St Allentown, PA | 4.0 | 1.5 | 1642 | $2,200 | $1.34 | 2d | 1 | 0.49mi |
| 107 N 7th St Allentown, PA | 2.0 | 1.0–2.0 | 855 | $2,972 | $3.47 | 2d | 23 | 0.53mi |
| 27 N 7th St Allentown, PA | 2.0 | 1.0–2.0 | 840 | $2,222 | $2.64 | 2d | 11 | 0.53mi |
| 1621 W Turner St Allentown, PA | 3.0 | 1.0 | 1200 | $2,195 | $1.83 | 23d | 1 | 0.56mi |
| 1542 Walnut St Apt 2 Allentown, PA | 4.0 | 1.0 | 1132 | $1,850 | $1.63 | 21d | 1 | 0.57mi |
| 347 N 7th St Apt 3 Allentown, PA | 3.0 | 1.0 | 1200 | $1,500 | $1.25 | 43d | 1 | 0.58mi |
| 626 Oak St Allentown, PA | 3.0 | 1.0 | 1396 | $1,900 | $1.36 | 43d | 1 | 0.58mi |
| 622 W Chew St Unit 2 Allentown, PA | 3.0 | 1.0 | 1161 | $1,600 | $1.38 | 19d | 1 | 0.59mi |
| 1639 W Turner St Unit 1 Allentown, PA | 2.0 | 2.0 | 1200 | $1,500 | $1.25 | 2d | 1 | 0.61mi |
| 26 N 6th St Allentown, PA | 1.0–2.0 | 1.0–2.0 | 953 | $2,224 | $2.33 | 2d | 9 | 0.61mi |
| 915 Tilghman St Apt 4 Allentown, PA | 3.0 | 1.0 | 1250 | $1,750 | $1.40 | 23d | 1 | 0.62mi |
| 635 N Lumber St Allentown, PA | 3.0 | 1.5 | 1117 | $1,750 | $1.57 | 2d | 1 | 0.63mi |
Listing history 29 events
-
2026-06-18days on market $164,900 Active 57 DOM
-
2026-06-17days on market $164,900 Active 56 DOM
-
2026-06-16days on market $164,900 Active 55 DOM
-
2026-06-15days on market $164,900 Active 54 DOM
-
2026-06-14days on market $164,900 Active 52 DOM
-
2026-06-10days on market $164,900 Active 49 DOM
-
2026-06-09days on market $164,900 Active 48 DOM
-
2026-06-08days on market $164,900 Active 47 DOM
-
2026-06-07days on market $164,900 Active 46 DOM
-
2026-06-03days on market $164,900 Active 42 DOM
-
2026-06-02days on market $164,900 Active 41 DOM
-
2026-06-01days on market $164,900 Active 40 DOM
-
2026-05-31days on market $164,900 Active 39 DOM
-
2026-05-31days on market $164,900 Active 38 DOM
-
2026-05-06price $164,900 845-char remark
Show marketing remark (845 chars)
* * Very Competitive Price Improvement Made * * Excellent Investment Opportunity in the Heart of this Emerging City! Nestled on a less traveled street, surrounded by the rich history of Old Allentown and the exciting variety of new hotels, restaurants and entertainment all within a short distance. Parks, the public library and excellent access to public transportation all add to the appeal for renters or owner occupied. This home features very spacious rooms and plenty of opportunity to make equity building improvements. Being sold as is, this home is a great addition to your portfolio and chance to show off your contractor skills. ROI Inspection done in March 2026 listing agent will provide upon request. CO will be ordered and will be Buyer's responsibility to obtain a clear CO. (some photos enhanced virtually to show potential)
-
2026-04-23$175,000 Active 845-char remark
Show marketing remark (845 chars)
* * Very Competitive Price Improvement Made * * Excellent Investment Opportunity in the Heart of this Emerging City! Nestled on a less traveled street, surrounded by the rich history of Old Allentown and the exciting variety of new hotels, restaurants and entertainment all within a short distance. Parks, the public library and excellent access to public transportation all add to the appeal for renters or owner occupied. This home features very spacious rooms and plenty of opportunity to make equity building improvements. Being sold as is, this home is a great addition to your portfolio and chance to show off your contractor skills. ROI Inspection done in March 2026 listing agent will provide upon request. CO will be ordered and will be Buyer's responsibility to obtain a clear CO. (some photos enhanced virtually to show potential)
-
2023-06-29historical
-
2023-06-29soldstatus $145,000
-
2023-06-28soldstatus $145,000 Sold
-
2023-05-18status Pending
-
2023-05-18status Pending
-
2023-04-04$139,000 Active
-
2023-04-04$139,000 Active
-
2008-07-18historical
-
2008-02-01$80,000
-
2008-02-01historical
-
2007-01-31historical
-
2006-08-15$80,000
-
2006-08-08$89,900
ⓘ Source: listings_history table (triggers on properties + properties_extension) + one-shot
backfill from property_details.listing_events for pre-trigger history.
Tax reassessment forecast PA · Partial reset (capped growth)
- Current annual tax
- $1,823 · $152/mo
- Projected year-2 tax
- $2,214 · $184/mo
- Expected delta
- +$391/yr (+$33/mo · 21.5%)
ⓘ Screening estimate from a state-policy table — verify with the county assessor before closing.
Climate risk First Street
- Flood 1/10 Low FEMA zone X (unshaded) · 0% chance over 30 yrs
- Wildfire 1/10 Low
- Heat 5/10 Major 7 d/yr ≥99°F today · 15 d/yr by 30 yrs out
- Wind 4/10 Moderate 15% chance of damaging wind over 30 yrs
- Air quality 3/10 Moderate 3 unhealthy d/yr today · 4 by 30 yrs out
Nearby sold comps map
Loading sold comps map…
Walkable amenities ~0.75 mi
Loading nearby amenities…
Taxation est. · year 1
- Rental income
- $23,664
- − Mortgage interest
- −$9,237
- − Property taxes
- −$1,823
- − Insurance
- −$824
- − Repairs & maintenance
- −$1,893
- − Management
- −$1,893
- − Depreciation
- −$4,797
- Taxable income
- $3,197
- Est. tax owed @ 24.0%
- −$767
- After-tax cash flow
- $4,903/yr
For passive investors: Depreciation is non-cash, so a rental often shows a tax loss while cash-flowing — sheltering income. Rental losses are passive: they offset passive income freely, and up to $25,000/yr can offset ordinary (W-2) income if you actively participate and your MAGI is under $100k (phasing out to $0 by $150k); unused losses carry forward. On sale, claimed depreciation is recaptured at up to 25%, and gains may owe capital-gains tax (a 1031 exchange can defer both). Figures are a year-1 estimate at your 24.0% rate — not tax advice; consult a CPA.
Schools (NCES district)
- District
- Allentown City SD
- NCES district ID
- 4202280
- Math proficiency
- 10% ▼ -10.00%
- Reading proficiency
- 20% ▼ -15.00%
- Median HH income
- $36,337
- Composite
- 12.43/100
- National rank
- #9630
- State rank
- #513 of 539 in PA
Livability — Allentown
- Score
- 81/100
- State rank
- #171
- US rank
- #1440
Category grades
Schools grade is shown separately in the Schools card above.
Census & demographics
- Census place
- Allentown, PA
- County
- Lehigh County · 333,019 people
- City population
- 172,996
- Metro
- Allentown-Bethlehem-Easton, PA-NJ
- Population (ZIP)
- 51,001
- Household income
- $43,085
- Rent vs Own
- Severe rent burden
- 4313.0
Population outlook (Lehigh County) Hauer SSP2
- Today (2025)
- 392,957 people
- By 2030
- 408,319 · +3.9%
- By 2040
- 440,007 · +12.0%
- By 2050
- 475,940 · +21.1%
- By 2075
- 590,448 · +50.3%
- By 2100
- 690,314 · +75.7%
Race, ethnicity, and origin ACS 2023
- Neighborhood character
- Predominantly Hispanic (69%)
- Race & ethnicity
- Hispanic / Latino 69% Two or more races 28% White 18% Black 10%
- Hispanic origin (detail)
- Mexican 3% Puerto Rican 38% Dominican 22%
- Common ancestry
- Polish 1% Romanian 1% Hispanic 1%
- Foreign-born
- 22% · Canada, Jamaica
- Languages at home
- 45% English-only · Spanish 52% Arabic 2%
Political lean MEDSL · Lehigh
- 2024 margin
- Toss-up / Even · D 50.7% · R 48.0% · Other 1.2%
- 2008→2024 swing
- -12.9pp toward R · 2008: 15.6pp · 2024: 2.7pp
- All cycles
- 2024: D+2.7 2020: D+7.6 2016: D+4.4 2012: D+7.5 2008: D+15.6
Not yet ingested
- Civics
- —
Market trends
- HPI YoY
- ▼ -227.01%
- Current HPI
- 404.834
- Rent YoY
- ▲ 5.48%
- Metro
- Allentown-Bethlehem-Easton, PA-NJ
- State GDP YoY
- ▲ 1.68%
- F500 in state
- 34
Industry mix (Fortune 500 HQ in PA)
| Industry | F500 HQs | Revenue |
|---|---|---|
| Healthcare | 2 | $309B |
|
||
| Insurance | 2 | $27B |
|
||
| Telecommunications / Media | 1 | $124B |
|
||
| Industrial Distribution | 1 | $22B |
|
||
| Financial Services | 1 | $20B |
|
||
| Chemicals / Materials | 1 | $18B |
|
||
Price history
+83.4% since first listed15 events — show timeline
- 2026-05-06 Price Changed $164,900 GLVRMLS
- 2026-04-23 Listed $175,000 GLVRMLS
- 2023-06-29 Sold (Public Records) $145,000 Public Records
- 2023-06-29 Listing Removed — GLVRMLS
- 2023-06-28 Sold (MLS) $145,000 GLVRMLS
- 2023-05-18 Pending — GLVRMLS
- 2023-05-18 Pending — GLVRMLS
- 2023-04-04 Listed $139,000 GLVRMLS
- 2023-04-04 Listed $139,000 GLVRMLS
- 2008-07-18 Listing Removed — GLVRMLS
- 2008-02-01 Listing Removed — GLVRMLS
- 2008-02-01 Listed $80,000 GLVRMLS
- 2007-01-31 Listing Removed — BRIGHT MLS
- 2006-08-15 Listed $80,000 GLVRMLS
- 2006-08-08 Listed $89,900 BRIGHT MLS
Property tax history
-2.0%/yrLatest (2026): $1,823 · +0.7% YoY. Source: county tax records.
Cash-flow waterfall
monthlySold comps — $/sqft
last 12 mo · ≤1 miLoading sold comps…