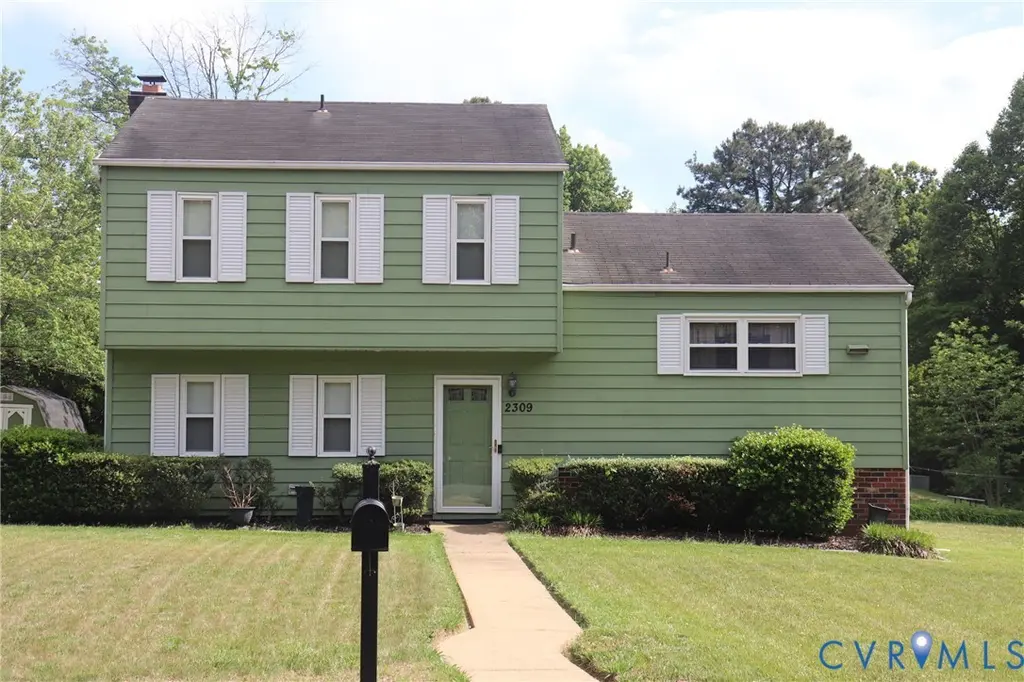
2309 Watts Ln · East Highland Park, VA
Flood risk 1/10 · Minimal
- FEMA flood zone
- X (unshaded)
- Chance of flooding over 30 yrs
- 0.0%
- Est. flood insurance / yr
- $473 – $860
Fire risk 1/10 · Minimal
- Est. fire insurance / yr
- $666 – $1,236
Heat risk 7/10 · Major
- Hot days now (above 106°F)
- 7 days/yr
- Hot days in 30 yrs
- 16 days/yr
Wind risk 6/10 · Moderate
- Chance of severe wind over 30 yrs
- 27.0%
Air-quality risk 2/10 · Minimal
- Unhealthy air days now
- 1 days/yr
- Unhealthy air days in 30 yrs
- 3 days/yr
Risk factors via First Street. Map © Google.
Why this score? — see what drove the C- grade
The composite is a weighted blend of 9 inputs, each scored 0–100. Each bar is that input's sub-score; the figure is the points it added to the 100-point composite (weight × sub-score).
- ARV discount +15.0/15.0
- Cash flow +13.4/30.0
- Schools +4.9/10.0
- Rent growth +4.1/5.0
- DSCR +4.0/10.0
- Livability +3.6/5.0
- 1% rule +2.9/10.0
- Condition / age +2.5/5.0
- Appreciation +0.0/10.0
$260,000
🖨 Deal sheet 📄 Offer letter ✓ Due diligence
Listing remarks
This 3 bedroom/1.5 bath tri-level is a great opportunity. Solid, well-built home with 1,569 square feet, a large yard, corner lot and shed. Excellent condition.
Key facts
- 0.24 acre lot
- Built 1991
- Listed 3 days
Property features AI
Exterior
- Utilities: Public water; Public sewer
- Home design: Three-story building; Renovated
- Construction: Brick, frame, and wood siding construction; Shingle roof; Below-grade finished area of 550 and above-grade finished area of 1,019
- Exterior features: Corner lot; Zoned R4
Interior
- Bathrooms: One full bathroom with tub and shower; One half bathroom
- Heating & cooling: Heat pump heating (electric); Central air conditioning
- Interior features: Six total rooms; Resale condition
- Laundry & utility: Electric water heater
Neighborhood map
What this means for you Summary
Snapshot
- This is a 3-bed/1.5-bath single-family listed at $260k.
Deal economics
- At list price, monthly cash flow is $3 ($30/yr) — positive.
- The deal already cash-flows at list — no discount required.
- To meet the 1% rule (rent ≥ 1% of price), the offer needs to be $207k (20.5% below list).
- Recommended offer: $207k (20.5% below list) — sets the bar for 1% rule.
- Cap rate 6.3% vs local median 4.2% in East Highland Park — top-decile yield for the area; either an underpriced asset or a hidden risk that comps aren't pricing in. Stress-test before assuming the spread holds.
Location & tenants
- Location reads 72/100 on livability (#197 in VA) — a middle-class / working-renter tenant base. Strengths: cost of living A+, housing A+, health & safety A+; Watch: employment C-, schools D-, amenities D-.
- Henrico County Public School District (suburban): math 49% / reading 64% proficiency, ranked #68 of 131 in VA (top 52%) — acceptable for families but not a draw, mixed tenant base, ~2y average lease.
- Market conditions: Rents rising fast (+6.4%/yr); 337 active listings in the ZIP; 19 comparable units currently listed for rent nearby; rentals at typical pace (median 17d on market — plan ~3-4 weeks tenant-placement turnaround); 1,826 units permitted in Henrico County in 2024 (785 in 5+ unit buildings).
- This rent runs 44% of the median local income ($56k/yr) — at the standard rent-burdened threshold; future hikes will face affordability resistance.
Forward outlook
- Local home prices are declining (-3.0%/yr); year-one equity from $2k of loan paydown is wiped out by about $8k of value loss. Plan a longer hold.
- Henrico County population projected at +21% by 2050 — long-run rental-demand tailwind backs the buy-and-hold thesis.
Negotiation context
- Only 4 days on market — expect competitive offers; lowballing is unlikely to land.
- Current owner paid $74k; list at $260k implies a 251% gain — meaningful room to come down on a strong offer.
Risks & watch-outs
- Climate carrying-cost: major wind risk, 27% chance of damaging wind over 30y; extreme-heat days projected 7→16/yr by 2055 (HVAC capex compounding) — expect insurance premiums to compound above CPI over the hold.
Questions for the listing agent
- Is there a deadline driving the sale (1031 exchange, divorce, estate, relocation)? That informs how much negotiation room exists.
- Schools are D-rated, which usually means shorter tenancies and higher turnover. Who's the typical renter profile here, and what's been the actual vacancy rate?
- What's the average days-on-market for RENTAL listings here right now (not sales)? A rising rental-DOM trend means longer vacancies and softer asking-rent achievability than the comps imply.
- What's the recent tenant-quality profile in this submarket — average credit score on applications, eviction rate, late-payment / NSF rate, and stable-employment percentage? A property-management company in the area should have these aggregated.
- How much new for-sale + rental construction is in the pipeline within 1–3 miles? Heavy new supply typically softens prices + rents 12–24 months out; constrained supply supports both.
Investment metrics
- 1% rule
- 0.79% ✗
- Cap rate
- 6.30%
- Cash-on-cash
- 0.04%
- DSCR
- 1.00
- GRM
- 10.5
CMA / ARV
- ARV (median comp)
- $328,366
- List price
- $260,000
- Delta
- -20.82%
- Verdict
- UNDERPRICED
- Comps
- 20 within 1.0 mi
Show comp detail 12 sales within ~0.75 mi
| Address | Dist | Beds/Ba | Sqft | Sold | Price | $/sf | Match |
|---|---|---|---|---|---|---|---|
| 2224 Watts Ln | 0.11mi | 3/2.0 | 1,544 (-2%) | 2mo | $295,000 | $191 | 89 |
| 2905 Watts Ln | 0.13mi | 3/2.0 | 1,544 (-2%) | 4mo | $331,000 | $214 | 86 |
| 2815 Caniff Rd | 0.29mi | 3/1.5 | 1,406 (-10%) | 3mo | $305,000 | $217 | 67 |
| 2909 Reynolds Rd | 0.13mi | 4/2.5 (+1) | 1,712 (+9%) | 6mo | $319,900 | $187 | 65 |
| 2664 Piney Ridge Dr | 0.30mi | 3/2.5 | 1,680 (+7%) | 7mo | $340,000 | $202 | 64 |
| 2632 Piney Ridge Dr | 0.27mi | 4/2.5 (+1) | 1,680 (+7%) | 8mo | $355,000 | $211 | 60 |
| 3100 Carlton Rd | 0.24mi | 4/3.0 (+1) | 1,730 (+10%) | 5mo | $285,000 | $165 | 56 |
| 3005 Sandy Ln | 0.39mi | 2/1.0 (-1) | 1,387 (-12%) | 3mo | $185,000 | $133 | 53 |
| 1901 Johnson Ct | 0.46mi | 3/2.0 | 1,417 (-10%) | 9mo | $305,000 | $215 | 53 |
| 1815 Doron Ln | 0.50mi | 3/2.0 | 1,356 (-14%) | 4mo | $285,000 | $210 | 48 |
| 1712 Binford Ct | 0.72mi | 3/2.5 | 1,508 (-4%) | 10mo | $330,000 | $219 | 48 |
| 201 St Claire Ln | 0.72mi | 3/1.0 | 1,742 (+11%) | 9mo | $238,000 | $137 | 38 |
Match score weights: distance 35% · size 25% · config 20% · recency 20%. Top-matched comps best support the ARV.
Projected returns pro-forma
-3.0% appreciation · 6.38% rent growth · sell at horizon
- IRR
- -12.9%
- Equity multiple
- 0.52×
- Total profit
- $-34,775
- Equity at exit
- $38,767
- IRR
- 0.3%
- Equity multiple
- 1.02×
- Total profit
- $1,603
- Equity at exit
- $22,480
Cash invested: $72,800 (down + closing). Projections, not guarantees.
Landlord ↔ Tenant lean methodology
- Overall (STATE)
- 55 Moderately Landlord-Leaning
- State Virginia
- 55 Moderately Landlord-Leaning · D+2
- County
- — inherits STATE
- City
- — inherits STATE
ZIP-level market 23223
- Rents YoY
- 6.4%
- Active inventory
- 337
- Price-to-rent
- 10.5×
Monthly cashflow live
- Estimated rent
- $2,067 high interval (Pro) →
- Mortgage (P&I)
- −$1,363
- Tax from tax record
- −$158 /mo · $1,900/yr
- Insurance
- −$108
- HOA
- −$0
- Vacancy / Maint / Mgmt
- −$434
- Net cashflow
- $3
Break-even live
UW: 25.0% down · 7.5% · 30yr · 1.5% tax · 5.0% vac · 8.0% maint · 8.0% mgmt
Financing live
Cash to close
- Down payment
- $65,000
- Closing costs
- $7,800
- Reserves months
- —
- Total cash needed
- —
Loan-product check · same deal, 3 products live
Conventional
25% down · 7.5% · 30yr
- Down + closing
- —
- Monthly P&I
- —
- Monthly cashflow
- —
- DSCR
- —
- Eligible?
- —
Personal DTI + credit; lowest rate.
DSCR
20% down · 8.5% · 30yr
- Down + closing
- —
- Monthly P&I
- —
- Monthly cashflow
- —
- DSCR
- —
- Eligible?
- —
No personal income docs; deal must DSCR.
Hard money
10% down · 12.0% · 12mo
- Down + closing
- —
- Monthly P&I
- —
- Monthly cashflow
- —
- DSCR
- —
- Eligible?
- —
Short-term bridge; refi at stabilization.
Rent comps 19 comps
| Address | Beds | Baths | Sqft | Rent | $/sqft | DOM | Units | Dist |
|---|---|---|---|---|---|---|---|---|
| 2213 Capp Rd Richmond, VA | 3.0 | 2.0 | 1572 | $2,200 | $1.40 | 17d | 1 | 0.21mi |
| 3411 Oxnard Rd Richmond, VA | 3.0 | 1.0 | 1083 | $1,795 | $1.66 | 17d | 1 | 0.49mi |
| 3217 Hunters Mill Dr Richmond, VA | 3.0 | 1.5 | 1178 | $1,975 | $1.68 | 44d | 1 | 0.56mi |
| 3221 Hunters Mill Dr Richmond, VA | 3.0 | 2.0 | 1254 | $1,750 | $1.40 | 3d | 1 | 0.57mi |
| 3231 Hunters Mill Dr Richmond, VA | 2.0 | 1.5 | 1064 | $1,550 | $1.46 | 23d | 1 | 0.58mi |
| 3615 Ammons Ave Richmond, VA | 3.0 | 1.0 | 1200 | $1,595 | $1.33 | 14d | 1 | 0.78mi |
| 3903 Dominion Townes Cir Unit 1 Richmond, VA | 3.0 | 2.5 | 1936 | $3,100 | $1.60 | 1d | 1 | 1.04mi |
| 3101 Divine Dr Richmond, VA | 3.0 | 2.5 | 1525 | $2,700 | $1.77 | 3d | 1 | 1.10mi |
| 4121 Concord Creek PL Richmond, VA | 1.0–2.0 | 1.0–2.0 | 892 | $2,570 | $2.88 | 1d | 26 | 1.13mi |
| 2153 Cool Ln Richmond, VA | 2.0 | 1.0 | 1148 | $1,080 | $0.94 | 44d | 1 | 1.18mi |
| 4100 Montclair Rd Richmond, VA | 3.0 | 2.0 | 1942 | $2,450 | $1.26 | 44d | 1 | 1.25mi |
| 4100 Concord Creek Pl Richmond, VA | 1.0–3.0 | 1.0–2.0 | 912 | $2,395 | $2.62 | 1d | 30 | 1.27mi |
| 4019 Grand Reserve Ln Richmond, VA | 3.0 | 2.5 | 1606 | $3,000 | $1.87 | 23d | 1 | 1.30mi |
| 2106 Newbourne St Richmond, VA | 3.0 | 2.0 | 1172 | $1,875 | $1.60 | 44d | 1 | 1.36mi |
| 3317 Waverly Blvd Unit B Richmond, VA | 3.0 | 2.0 | 1500 | $1,875 | $1.25 | 17d | 1 | 1.36mi |
| 4184 Park Trail Dr Richmond, VA | 3.0 | 2.5 | 1606 | $2,525 | $1.57 | 3d | 1 | 1.37mi |
| 1519 Byron St Richmond, VA | 3.0 | 1.5 | 1384 | $1,700 | $1.23 | 3d | 1 | 1.37mi |
| 3103 Dill Ave Richmond, VA | 3.0 | 1.5 | 1380 | $2,050 | $1.49 | 23d | 1 | 1.45mi |
| 3017 Dill Ave Richmond, VA | 4.0 | 2.0 | 1578 | $1,895 | $1.20 | 3d | 1 | 1.49mi |
Listing history 17 events
-
2026-06-18days on market $260,000 Active 4 DOM
-
2026-06-17days on market $260,000 Active 3 DOM
-
2026-06-16remarks 160-char remark
-
2026-06-16days on market $260,000 Active 2 DOM
-
2026-06-15statusdays on market $260,000 Active 1 DOM
-
2026-06-13days on market $260,000 Coming Soon 29 DOM
-
2026-06-09days on market $260,000 Coming Soon 25 DOM
-
2026-06-08days on market $260,000 Coming Soon 24 DOM
-
2026-06-07days on market $260,000 Coming Soon 23 DOM
-
2026-06-05days on market $260,000 Coming Soon 20 DOM
-
2026-06-03days on market $260,000 Coming Soon 19 DOM
-
2026-06-02days on market $260,000 Coming Soon 18 DOM
-
2026-06-01days on market $260,000 Coming Soon 17 DOM
-
2026-05-31days on market $260,000 Coming Soon 16 DOM
-
2026-05-15historical $260,000 139-char remark
-
1992-10-01soldstatus $74,000
-
1983-01-01soldstatus $58,950
ⓘ Source: listings_history table (triggers on properties + properties_extension) + one-shot
backfill from property_details.listing_events for pre-trigger history.
Tax reassessment forecast VA · Resets to sale price
- Current annual tax
- $1,900 · $158/mo
- Projected year-2 tax
- $2,132 · $178/mo
- Expected delta
- +$232/yr (+$19/mo · 12.2%)
ⓘ Screening estimate from a state-policy table — verify with the county assessor before closing.
Climate risk First Street
- Flood 1/10 Low FEMA zone X (unshaded) · 0% chance over 30 yrs
- Wildfire 1/10 Low
- Heat 7/10 Severe 7 d/yr ≥106°F today · 16 d/yr by 30 yrs out
- Wind 6/10 Major 27% chance of damaging wind over 30 yrs
- Air quality 2/10 Low 1 unhealthy d/yr today · 3 by 30 yrs out
Nearby sold comps map
Loading sold comps map…
Walkable amenities ~0.75 mi
Loading nearby amenities…
Taxation est. · year 1
- Rental income
- $24,800
- − Mortgage interest
- −$14,564
- − Property taxes
- −$1,900
- − Insurance
- −$1,300
- − Repairs & maintenance
- −$1,984
- − Management
- −$1,984
- − Depreciation
- −$7,564
- Taxable loss
- −$4,496
- Est. tax savings @ 24.0%
- +$1,079
- After-tax cash flow
- $1,109/yr
For passive investors: Depreciation is non-cash, so a rental often shows a tax loss while cash-flowing — sheltering income. Rental losses are passive: they offset passive income freely, and up to $25,000/yr can offset ordinary (W-2) income if you actively participate and your MAGI is under $100k (phasing out to $0 by $150k); unused losses carry forward. On sale, claimed depreciation is recaptured at up to 25%, and gains may owe capital-gains tax (a 1031 exchange can defer both). Figures are a year-1 estimate at your 24.0% rate — not tax advice; consult a CPA.
Schools (NCES district)
- District
- Henrico County Public School District
- NCES district ID
- 5101890
- Math proficiency
- 49% ▼ -32.00%
- Reading proficiency
- 64% ▼ -12.00%
- Median HH income
- $61,854
- Composite
- 49.25/100
- National rank
- #2031
- State rank
- #68 of 131 in VA
Livability — East Highland Park
- Score
- 72/100
- State rank
- #197
- US rank
- #6099
Category grades
Schools grade is shown separately in the Schools card above.
Census & demographics
- Census place
- East Highland Park, VA
- County
- Henrico County · 334,490 people
- Metro
- Richmond, VA
- Population (ZIP)
- 54,659
- Household income
- $55,731
- Rent vs Own
- Severe rent burden
- 3530.0
Population outlook (Henrico County) Hauer SSP2
- Today (2025)
- 365,885 people
- By 2030
- 384,255 · +5.0%
- By 2040
- 416,688 · +13.9%
- By 2050
- 442,376 · +20.9%
- By 2075
- 488,037 · +33.4%
- By 2100
- 487,430 · +33.2%
Race, ethnicity, and origin ACS 2023
- Neighborhood character
- Predominantly Black (71%)
- Race & ethnicity
- Black 71% White 19% Two or more races 5% Hispanic / Latino 5%
- Common ancestry
- Romanian 1% Lithuanian 1% Slovak 1%
- Foreign-born
- 4% · Canada
- Languages at home
- 93% English-only · Spanish 4% French/Haitian/Cajun 1% Other Indo-European 1%
Political lean MEDSL · Henrico
- 2024 margin
- Strong D (+28.9) · D 63.7% · R 34.8% · Other 1.5%
- 2008→2024 swing
- +16.6pp toward D · 2008: 12.2pp · 2024: 28.9pp
- All cycles
- 2024: D+28.9 2020: D+29.0 2016: D+21.0 2012: D+11.7 2008: D+12.2
Not yet ingested
- Civics
- —
Market trends
- HPI YoY
- ▼ -257.81%
- Current HPI
- 324.0589
- Rent YoY
- ▲ 6.38%
- Metro
- Richmond, VA
- State GDP YoY
- ▲ 2.40%
- F500 in state
- 50
Industry mix (Fortune 500 HQ in VA)
| Industry | F500 HQs | Revenue |
|---|---|---|
| Aerospace / Defense | 4 | $236B |
|
||
| Technology / Defense | 3 | $32B |
|
||
| Financial Services | 2 | $176B |
|
||
| Utilities | 2 | $27B |
|
||
| Insurance | 2 | $25B |
|
||
| Technology | 2 | $15B |
|
||
Price history
+341.1% since first listed4 events — show timeline
- 2026-06-15 Listed $260,000 CVRMLS
- 2026-05-15 Coming Soon $260,000 CVRMLS
- 1992-10-01 Sold (Public Records) $74,000 Public Records
- 1983-01-01 Sold (Public Records) $58,950 Public Records
Property tax history
+5.4%/yrLatest (2025): $1,900 · +8.3% YoY. Source: county tax records.
Cash-flow waterfall
monthlySold comps — $/sqft
last 12 mo · ≤1 miLoading sold comps…