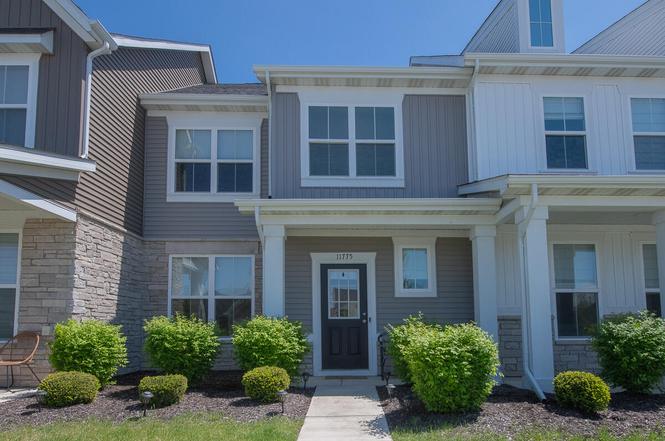
11775 Rhode Island St · Crown Point, IN
Flood risk 1/10 · Minimal
- FEMA flood zone
- X (unshaded)
- Chance of flooding over 30 yrs
- 0.0%
- Est. flood insurance / yr
- $507 – $1,088
Fire risk 1/10 · Minimal
- Est. fire insurance / yr
- $717 – $1,331
Heat risk 2/10 · Minimal
- Hot days now (above 102°F)
- 7 days/yr
- Hot days in 30 yrs
- 16 days/yr
Wind risk 2/10 · Minimal
- Chance of severe wind over 30 yrs
- 0.0%
Air-quality risk 2/10 · Minimal
- Unhealthy air days now
- 1 days/yr
- Unhealthy air days in 30 yrs
- 3 days/yr
Risk factors via First Street. Map © Google.
Why this score? — see what drove the D grade
The composite is a weighted blend of 9 inputs, each scored 0–100. Each bar is that input's sub-score; the figure is the points it added to the 100-point composite (weight × sub-score).
- ARV discount +11.6/15.0
- Cash flow +9.5/30.0
- Schools +5.0/10.0
- Livability +3.9/5.0
- Rent growth +3.1/5.0
- 1% rule +3.0/10.0
- DSCR +2.7/10.0
- Condition / age +2.5/5.0
- Appreciation +0.0/10.0
$260,000
🖨 Deal sheet (PDF) 📄 Offer letter ✓ Due diligence
Listing remarks
Back on the market! No fault of sellers! Join a tranquil Community centered close to many amenities! This immaculate 2-story townhome combines modern luxury with convenience to shopping, trendy cafes, nightlife, dining, walking trails, and lots more amenities. The bright, open concept main floor features a cozy living room, a large kitchen island, lots of cabinet space, stainless steel appliances, and 1/2 bath on the main floor. After dinner, retreat to the private fenced in patio. Upstairs the master suite offers peacefulness and a walk in closet with large adjoining bathroom. The upper level laundry boosts convenience and ease. The second bedroom also has a walk in closet. Close to every
Key facts
- Large kitchen island
- Private fenced patio
- Upper level laundry
Tags
Property features AI
Finance
- HOA & community: Homeowners association (monthly fee $150); Association provides landscaping, snow removal, playground, park, management, and grounds maintenance; Curbs in community
Exterior
- Parking: Detached garage; 2-car garage; Alley access; Off-street parking; Garage door opener
- Security: Smoke detector(s); Carbon monoxide detector(s)
- Utilities: Natural gas connected; Public water; Public sewer; 100 amp electric service
- Home design: Two-story attached property; Built in 2021
- Construction: Stone and vinyl siding exterior; Shingle roof; Property attached
- Exterior features: Private yard; Back yard fencing; Patio; Neighborhood view; Aluminum frame windows; Garage(s) structure
Interior
- Kitchen: Gas range; Gas cooktop; Dishwasher; Microwave; Refrigerator; Stainless steel appliances
- Bedrooms: Primary bedroom; Bedroom 2
- Flooring: Carpet; Vinyl
- Bathrooms: 1 full bathroom; 1 half bathroom
- Heating & cooling: Forced air heating (natural gas); Central air conditioning
- Interior features: Double vanity; Walk-in closet(s); Laminate countertops; Kitchen island
- Laundry & utility: Laundry on upper level; Gas water heater; Dryer
Neighborhood map
What this means for you Summary
Snapshot
- This is a 2-bed/1.5-bath single-family listed at $260k.
Deal economics
- At list price, monthly cash flow is $-183 ($-2k/yr) — negative.
- To cash-flow at today's rent, offer at most $228k (12.4% below list).
- To meet the 1% rule (rent ≥ 1% of price), the offer needs to be $209k (19.5% below list).
- Recommended offer: $209k (19.5% below list) — sets the bar for 1% rule.
- Cap rate 5.4% vs local median 3.4% in Crown Point — top-decile yield for the area; either an underpriced asset or a hidden risk that comps aren't pricing in. Stress-test before assuming the spread holds.
Location & tenants
- Location reads 77/100 on livability (#45 in IN, #3,244 nationally) — a middle-class / working-renter tenant base. Strengths: crime A+, employment A+, cost of living A+; Watch: amenities F, commute F, health & safety D-.
- Crown Point Community School Corporation (suburban): math 51% / reading 61% proficiency, ranked #23 of 301 in IN (top 8%) — acceptable for families but not a draw, mixed tenant base, ~2y average lease; only 18% free/reduced lunch — higher-income household profile.
- Zoned schools: Solon Robinson Elementary School (math 59% / reading 57%, grade C+, #160 of 994 statewide, top 17%, 528 students, 34% FRL); Robert Taft Middle School (math 37% / reading 57%, grade D+, #65 of 330 statewide, top 21%, 1,091 students, 23% FRL); Crown Point High School (math 51% / reading 80%, grade B, #29 of 369 statewide, top 8%, 2,948 students, 22% FRL).
- Market conditions: Rents rising (+2.5%/yr); 753 active listings in the ZIP; 3 comparable units currently listed for rent nearby; rentals leasing fast (median 0d on market — plan ~1-2 weeks tenant-placement turnaround); solid renter incomes; 1,642 units permitted in Lake County in 2024 (14 in 5+ unit buildings).
Forward outlook
- Local home prices are declining (-3.0%/yr); year-one equity from $2k of loan paydown is wiped out by about $8k of value loss. Plan a longer hold.
- Lake County population projected to shrink 7% by 2050 — rents likely to lag national; underwrite the cash flow, not the appreciation.
Negotiation context
- It's been on market 51 days — a 3% lower offer ($252k) is reasonable based on typical stale-listing flexibility.
- 2 sale attempts with the ask held roughly flat each time — persistent listings suggest the price (not the market) is what's stuck; bring a comps-based counter.
Questions for the listing agent
- What do current leases actually rent for vs. the listed asking? Can we see a recent rent roll and the last 12 months of T-12 income?
- It's been on market 51 days. Have you received any prior offers? Is the seller open to a 20% concession, seller financing, or rate buy-down credit?
- What does the HOA fee cover, when was the last increase, and are there any pending special assessments or reserve-fund shortfalls?
- Is there a deadline driving the sale (1031 exchange, divorce, estate, relocation)? That informs how much negotiation room exists.
- Schools are B-rated — typically a magnet for longer-tenancy family renters. What's the average tenant stay here, and is there a school-zone premium baked into asking?
- The area grade is low — what's the realistic commute time and amenity access for the typical tenant pool here? Any planned neighborhood developments (good or bad) we should know about?
- What's the average days-on-market for RENTAL listings here right now (not sales)? A rising rental-DOM trend means longer vacancies and softer asking-rent achievability than the comps imply.
- What's the recent tenant-quality profile in this submarket — average credit score on applications, eviction rate, late-payment / NSF rate, and stable-employment percentage? A property-management company in the area should have these aggregated.
- How much new for-sale + rental construction is in the pipeline within 1–3 miles? Heavy new supply typically softens prices + rents 12–24 months out; constrained supply supports both.
Investment metrics
- 1% rule
- 0.80% ✗
- Cap rate
- 5.45%
- Cash-on-cash
- -3.01%
- DSCR
- 0.87
- GRM
- 10.4
CMA / ARV
- ARV (median comp)
- $286,277
- List price
- $260,000
- Delta
- -9.18%
- Verdict
- FAIR
- Comps
- 20 within 1.0 mi
Show comp detail 6 sales within ~0.75 mi
| Address | Dist | Beds/Ba | Sqft | Sold | Price | $/sf | Match |
|---|---|---|---|---|---|---|---|
| 11885 Kentucky St | 0.18mi | 2/1.5 | 1,356 (+6%) | 23mo | $275,035 | $203 | 63 |
| 1068 E 115th Ln | 0.26mi | 2/1.0 | 1,375 (+7%) | 14mo | $206,525 | $150 | 63 |
| 955 E 114th Pl | 0.40mi | 2/1.5 | 1,176 (-8%) | 11mo | $235,000 | $200 | 59 |
| 11695 Georgia St | 0.11mi | 2/2.0 | 1,440 (+12%) | 17mo | $309,000 | $215 | 58 |
| 11584 Vermont St | 0.22mi | 2/2.0 | 1,442 (+12%) | 12mo | $281,000 | $195 | 57 |
| 11360 Vermont St | 0.52mi | 2/2.0 | 1,292 (+1%) | 22mo | $250,000 | $193 | 54 |
Match score weights: distance 35% · size 25% · config 20% · recency 20%. Top-matched comps best support the ARV.
Projected returns pro-forma
-3.0% appreciation · 2.53% rent growth · sell at horizon
- IRR
- -21.8%
- Equity multiple
- 0.25×
- Total profit
- $-54,697
- Equity at exit
- $38,767
- IRR
- -16.8%
- Equity multiple
- 0.09×
- Total profit
- $-66,390
- Equity at exit
- $22,480
Cash invested: $72,800 (down + closing). Projections, not guarantees.
Landlord ↔ Tenant lean methodology
- Overall (STATE)
- 90 Strongly Landlord-Friendly
- State Indiana
- 90 Strongly Landlord-Friendly · R+11
- County
- — inherits STATE
- City
- — inherits STATE
ZIP-level market 46307
- Rents YoY
- 2.5%
- Active inventory
- 753
- Price-to-rent
- 10.4×
Monthly cashflow live
- Estimated rent
- $2,092 medium interval (Pro) →
- Mortgage (P&I)
- −$1,363
- Tax from tax record
- −$214 /mo · $2,567/yr
- Insurance
- −$108
- HOA
- −$150
- Vacancy / Maint / Mgmt
- −$439
- Net cashflow
- $-183
Break-even live
Sensitivity live
| Price | -10% $-36 | -5% $-109 | +0% $-183 | +5% $-256 | +10% $-330 |
|---|---|---|---|---|---|
| Rent | -10% $-348 | -5% $-265 | +0% $-183 | +5% $-100 | +10% $-17 |
| Rate | -1.0pp $-52 | -0.5pp $-117 | base $-183 | +0.5pp $-250 | +1.0pp $-319 |
UW: 25.0% down · 7.5% · 30yr · 1.5% tax · 5.0% vac · 8.0% maint · 8.0% mgmt
Financing live
Cash to close
- Down payment
- $65,000
- Closing costs
- $7,800
- Reserves months
- —
- Total cash needed
- —
Loan-product check · same deal, 3 products live
Conventional
25% down · 7.5% · 30yr
- Down + closing
- —
- Monthly P&I
- —
- Monthly cashflow
- —
- DSCR
- —
- Eligible?
- —
Personal DTI + credit; lowest rate.
DSCR
20% down · 8.5% · 30yr
- Down + closing
- —
- Monthly P&I
- —
- Monthly cashflow
- —
- DSCR
- —
- Eligible?
- —
No personal income docs; deal must DSCR.
Hard money
10% down · 12.0% · 12mo
- Down + closing
- —
- Monthly P&I
- —
- Monthly cashflow
- —
- DSCR
- —
- Eligible?
- —
Short-term bridge; refi at stabilization.
Rent comps 3 comps
| Address | Beds | Baths | Sqft | Rent | $/sqft | DOM | Units | Dist |
|---|---|---|---|---|---|---|---|---|
| 396 Golden Oak Ct Crown Point, IN | 3.0 | 2.0 | 1670 | $2,300 | $1.38 | 0d | 1 | 1.07mi |
| 484 E 127th Ave Crown Point, IN | 2.0–3.0 | 2.0–2.5 | 1544 | $2,506 | $1.62 | 0d | 20 | 1.18mi |
| 930 Cypress Point Dr Crown Point, IN | 1.0–2.0 | 1.0 | 900 | $1,729 | $1.92 | 0d | 10 | 1.48mi |
HOA detail
- Monthly dues
- $150 · $1,800/yr
Listing history 17 events
-
2026-06-21days on market $260,000 Active 51 DOM
-
2026-06-18days on market $260,000 Active 48 DOM
-
2026-06-17days on market $260,000 Active 47 DOM
-
2026-06-16days on market $260,000 Active 46 DOM
-
2026-06-15pricestatus $260,000 Active 45 DOM
-
2026-06-15days on market $263,000 Active Under Contract 45 DOM
-
2026-06-13days on market $263,000 Active Under Contract 43 DOM
-
2026-06-13days on market $263,000 Active Under Contract 42 DOM
-
2026-06-09days on market $263,000 Active Under Contract 39 DOM
-
2026-06-08days on market $263,000 Active Under Contract 38 DOM
-
2026-06-07days on market $263,000 Active Under Contract 37 DOM
-
2026-06-04days on market $263,000 Active Under Contract 34 DOM
-
2026-06-03days on market $263,000 Active Under Contract 33 DOM
-
2026-06-02days on market $263,000 Active Under Contract 32 DOM
-
2026-06-01days on market $263,000 Active Under Contract 31 DOM
-
2026-05-31statusdays on market $263,000 Active Under Contract 30 DOM
-
2026-05-01$263,000 Active 715-char remark
ⓘ Source: listings_history table (triggers on properties + properties_extension) + one-shot
backfill from property_details.listing_events for pre-trigger history.
Tax reassessment forecast IN · Partial reset (capped growth)
- Current annual tax
- $2,567 · $214/mo
- Projected year-2 tax
- $2,567 · $214/mo
- Expected delta
- $0/yr ($0/mo · 0.0%)
ⓘ Screening estimate from a state-policy table — verify with the county assessor before closing.
Climate risk First Street
- Flood 1/10 Low FEMA zone X (unshaded) · 0% chance over 30 yrs
- Wildfire 1/10 Low
- Heat 2/10 Low 7 d/yr ≥102°F today · 16 d/yr by 30 yrs out
- Wind 2/10 Low 0% chance of damaging wind over 30 yrs
- Air quality 2/10 Low 1 unhealthy d/yr today · 3 by 30 yrs out
Nearby sold comps map
Loading sold comps map…
Walkable amenities ~0.75 mi
Loading nearby amenities…
Taxation est. · year 1
- Rental income
- $25,109
- − Mortgage interest
- −$14,564
- − Property taxes
- −$2,567
- − Insurance
- −$1,300
- − Repairs & maintenance
- −$2,009
- − Management
- −$2,009
- − HOA
- −$1,800
- − Depreciation
- −$7,564
- Taxable loss
- −$6,703
- Est. tax savings @ 24.0%
- +$1,609
- After-tax cash flow
- $-584/yr
For passive investors: Depreciation is non-cash, so a rental often shows a tax loss while cash-flowing — sheltering income. Rental losses are passive: they offset passive income freely, and up to $25,000/yr can offset ordinary (W-2) income if you actively participate and your MAGI is under $100k (phasing out to $0 by $150k); unused losses carry forward. On sale, claimed depreciation is recaptured at up to 25%, and gains may owe capital-gains tax (a 1031 exchange can defer both). Figures are a year-1 estimate at your 24.0% rate — not tax advice; consult a CPA.
Schools (NCES district)
- District
- Crown Point Community School Corporation
- NCES district ID
- 1802490
- Math proficiency
- 51% ▼ -9.00%
- Reading proficiency
- 61% ▼ -8.00%
- Median HH income
- $69,148
- Composite
- 49.55/100
- National rank
- #1990
- State rank
- #23 of 301 in IN
Livability — Crown Point
- Score
- 77/100
- State rank
- #45
- US rank
- #3244
Category grades
Schools grade is shown separately in the Schools card above.
Census & demographics
- Census place
- Crown Point, IN
- County
- Lake County · 422,878 people
- City population
- 71,673
- Metro
- Chicago-Naperville-Elgin, IL-IN-WI
- Population (ZIP)
- 71,673
- Household income
- $107,800
- Rent vs Own
- Severe rent burden
- 705.0
Population outlook (Lake County) Hauer SSP2
- Today (2025)
- 484,026 people
- By 2030
- 478,091 · -1.2%
- By 2040
- 462,974 · -4.3%
- By 2050
- 449,894 · -7.1%
- By 2075
- 436,169 · -9.9%
- By 2100
- 426,607 · -11.9%
Race, ethnicity, and origin ACS 2023
- Neighborhood character
- Predominantly White (76%)
- Race & ethnicity
- White 76% Hispanic / Latino 12% Two or more races 10% Black 7% Asian 2%
- Hispanic origin (detail)
- Mexican 9% Puerto Rican 1%
- Common ancestry
- Romanian 12% Iranian 3% Lithuanian 2%
- Foreign-born
- 7% · Canada, Vietnam
- Languages at home
- 88% English-only · Spanish 5% Russian/Polish/Slavic 3% Other Indo-European 1%
Political lean MEDSL · Lake
- 2024 margin
- Lean D (+5.6) · D 52.1% · R 46.5% · Other 1.5%
- 2008→2024 swing
- -28.6pp toward R · 2008: 34.3pp · 2024: 5.6pp
- All cycles
- 2024: D+5.6 2020: D+15.1 2016: D+20.6 2012: D+31.0 2008: D+34.3
Not yet ingested
- Civics
- —
Market trends
- HPI YoY
- ▼ -164.91%
- Current HPI
- 226.0335
- Rent YoY
- ▲ 2.53%
- Metro
- Chicago-Naperville-Elgin, IL-IN-WI
- State GDP YoY
- ▲ 2.90%
- F500 in state
- 18
Industry mix (Fortune 500 HQ in IN)
| Industry | F500 HQs | Revenue |
|---|---|---|
| Industrial Machinery | 2 | $37B |
|
||
| Healthcare | 1 | $177B |
|
||
| Pharmaceuticals | 1 | $45B |
|
||
| Metals / Steel | 1 | $18B |
|
||
| Agriculture | 1 | $17B |
|
||
| Packaging | 1 | $12B |
|
||
Price history
-1.1% since first listed4 events — show timeline
- 2026-06-15 Relisted — NIRA MLS as Distributed by MLS Grid
- 2026-06-15 Price Changed $260,000 NIRA MLS as Distributed by MLS Grid
- 2026-05-31 Contingent — NIRA MLS as Distributed by MLS Grid
- 2026-05-01 Listed $263,000 NIRA MLS as Distributed by MLS Grid
Property tax history
+505.9%/yrLatest (2024): $2,567 · +9.1% YoY. Source: county tax records.
Cash-flow waterfall
monthlySold comps — $/sqft
last 12 mo · ≤1 miLoading sold comps…