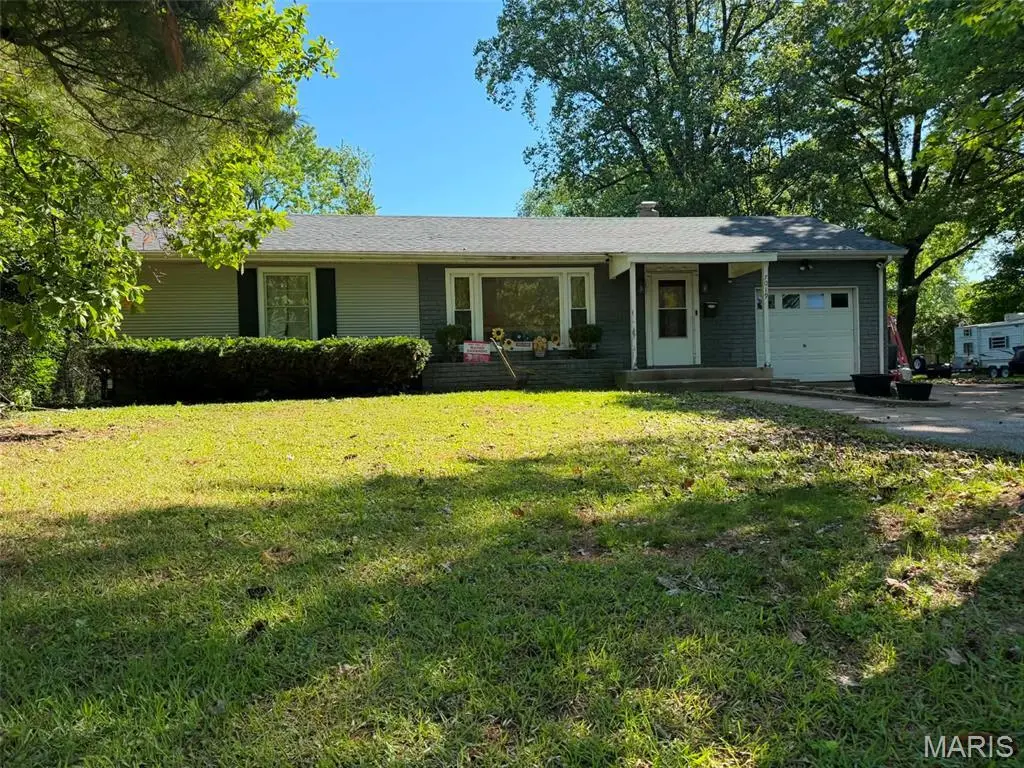
7019 W B St · Belleville, IL
Flood risk 1/10 · Minimal
- FEMA flood zone
- X
- Chance of flooding over 30 yrs
- 0.0%
- Est. flood insurance / yr
- $507 – $1,088
Fire risk 1/10 · Minimal
- Est. fire insurance / yr
- $804 – $1,492
Heat risk 5/10 · Moderate
- Hot days now (above 107°F)
- 7 days/yr
- Hot days in 30 yrs
- 21 days/yr
Wind risk 2/10 · Minimal
- Chance of severe wind over 30 yrs
- 1.0%
Air-quality risk 3/10 · Minor
- Unhealthy air days now
- 2 days/yr
- Unhealthy air days in 30 yrs
- 4 days/yr
Risk factors via First Street. Map © Google.
Why this score? — see what drove the D grade
The composite is a weighted blend of 9 inputs, each scored 0–100. Each bar is that input's sub-score; the figure is the points it added to the 100-point composite (weight × sub-score).
- Appreciation +9.8/10.0
- Cash flow +7.9/30.0
- ARV discount +7.8/15.0
- Livability +3.9/5.0
- 1% rule +3.1/10.0
- Rent growth +2.5/5.0
- Condition / age +2.5/5.0
- Schools +2.2/10.0
- DSCR +2.0/10.0
$185,000
🖨 Deal sheet 📄 Offer letter ✓ Due diligence
Listing remarks MLS
A must see!! This adorable 3 bedroom, 2 bathroom ranch home boasts tons of curb appeal and move-in ready with a one car attached garage with additional front parking spaces. Front entry door leads into a large living room with wood flooring that runs throughout most of the home. Wood flooring and ceramic tile in both bathrooms newly installed March 2017. Kitchen is complete with refrigerator, gas stove, dishwasher and microwave. Dining room/family room combo space houses the access that leads to a large rear deck, perfect for entertaining and enjoying the view of the lake (not part of the property). Also in the rear of the home is an additional workshop/storage space that has both a heating and cooling source. Schedule your showing today!! **Property is being sold AS-IS,**All MLS information should be verified by the buyer or buyer's agent.
Key facts
- 0.24 acre lot
- Garage
- Built 1950
Property features AI
Finance
- Financial info: Lease not considered
Exterior
- Parking: Attached garage (1-car) with additional driveway parking; Garage about 13x24
- Security: Security system
- Utilities: Public water; Public sewer; Electric service by Ameren; Electricity, sewer and water available
- Home design: Single-family residence; One story; House
- Construction: Brick veneer exterior; Architectural shingle roof
- Exterior features: Level lot; Chain link fencing; Second garage (other structure)
Interior
- Kitchen: Dishwasher; Microwave; Oven; Range hood; Refrigerator; Water heater
- Bedrooms: 3 bedrooms on the main level
- Flooring: Vinyl
- Bathrooms: 2 full bathrooms on the main level
- Heating & cooling: Forced air heating (natural gas); Central air conditioning
- Interior features: Ceiling fans; Walk-in closets; Security system
- Laundry & utility: Laundry in garage (main level)
Neighborhood map
What this means for you Summary
Snapshot
- This is a 3-bed/3.0-bath single-family listed at $185k.
Deal economics
- At list price, monthly cash flow is $-193 ($-2k/yr) — negative.
- To cash-flow at today's rent, offer at most $151k (18.5% below list).
- To meet the 1% rule (rent ≥ 1% of price), the offer needs to be $151k (18.6% below list).
- Recommended offer: $151k (18.6% below list) — sets the bar for 1% rule.
Location & tenants
- Location reads 78/100 on livability (#142 in IL, #2,604 nationally) — a middle-class / working-renter tenant base. Strengths: commute A+, cost of living A+, housing A+; Watch: crime F, amenities D-.
- Belleville Twp Hsd 201 (suburban): math 21% / reading 28% proficiency, ranked #308 of 620 in IL (top 50%) — low school quality limits family demand, transient renter base, plan for 1-2y turnover.
- Zoned schools: Belleville High School-West (math 19% / reading 26%, grade F, #317 of 693 statewide, top 46%, 2,234 students, 0% FRL).
- Market conditions: 103 active listings in the ZIP; 4 comparable units currently listed for rent nearby; rentals leasing fast (median 12d on market — plan ~1-2 weeks tenant-placement turnaround); 783 units permitted in St. Clair County in 2024 (378 in 5+ unit buildings).
Forward outlook
- In year one you build about $19k of equity ($1k loan paydown + $18k appreciation (9.5% local appreciation)).
- St. Clair County population projected at -23% by 2050 — secular population decline; favor cash flow + early exit over multi-decade hold.
- By year 2, paydown + projected appreciation supports a ~$30k cash-out refi (75% LTV) — recoverable capital for the next deal without selling this one.
Negotiation context
- Only 6 days on market — expect competitive offers; lowballing is unlikely to land.
- Current owner paid $62k; list at $185k implies a 196% gain — meaningful room to come down on a strong offer.
Risks & watch-outs
- Watch-outs: built in 1950 — expect roof / HVAC / electrical / plumbing capex.
- Climate carrying-cost: extreme-heat days projected 7→21/yr by 2055 (HVAC capex compounding) — expect insurance premiums to compound above CPI over the hold.
Questions for the listing agent
- What do current leases actually rent for vs. the listed asking? Can we see a recent rent roll and the last 12 months of T-12 income?
- Built in 1950 — when were the roof, HVAC, electrical panel, plumbing, and water heater last replaced?
- Is there a deadline driving the sale (1031 exchange, divorce, estate, relocation)? That informs how much negotiation room exists.
- Crime grade is F in this area — have there been break-ins, vandalism, or insurance claims at this property in the last 3 years? What carrier currently insures it and at what premium?
- The area grade is low — what's the realistic commute time and amenity access for the typical tenant pool here? Any planned neighborhood developments (good or bad) we should know about?
- What's the average days-on-market for RENTAL listings here right now (not sales)? A rising rental-DOM trend means longer vacancies and softer asking-rent achievability than the comps imply.
- What's the recent tenant-quality profile in this submarket — average credit score on applications, eviction rate, late-payment / NSF rate, and stable-employment percentage? A property-management company in the area should have these aggregated.
- How much new for-sale + rental construction is in the pipeline within 1–3 miles? Heavy new supply typically softens prices + rents 12–24 months out; constrained supply supports both.
Investment metrics
- 1% rule
- 0.81% ✗
- Cap rate
- 5.04%
- Cash-on-cash
- -4.48%
- DSCR
- 0.80
- GRM
- 10.2
CMA / ARV
- ARV (on-the-fly)
- $186,264
- Comps found
- 12
Show comp detail 12 sales within ~0.75 mi
| Address | Dist | Beds/Ba | Sqft | Sold | Price | $/sf | Match |
|---|---|---|---|---|---|---|---|
| 6920 W A St | 0.13mi | 3/2.0 | 1,752 (+10%) | 2mo | $150,000 | $86 | 72 |
| 110 N 74th St | 0.15mi | 2/1.5 (-1) | 1,636 (+3%) | 10mo | $165,000 | $101 | 69 |
| 49 Lakeview Dr | 0.25mi | 3/2.5 | 1,720 (+8%) | 10mo | $265,000 | $154 | 64 |
| 24 Smalling Ct | 0.57mi | 3/1.5 | 1,570 (-1%) | 3mo | $240,000 | $153 | 63 |
| 7620 W Main St | 0.37mi | 4/2.0 (+1) | 1,672 (+5%) | 4mo | $240,000 | $144 | 62 |
| 23 N 78th St | 0.44mi | 4/2.0 (+1) | 1,680 (+6%) | 1mo | $182,000 | $108 | 61 |
| 125 Barrington Dr | 0.50mi | 3/1.5 | 1,526 (-4%) | 4mo | $165,000 | $108 | 61 |
| 104 Winchester Dr | 0.63mi | 3/2.0 | 1,618 (+2%) | 9mo | $189,900 | $117 | 57 |
| 7000 Gary Dr | 0.64mi | 3/1.0 | 1,496 (-6%) | 1mo | $165,000 | $110 | 51 |
| 317 Southgate Dr | 0.66mi | 3/1.0 | 1,680 (+6%) | 5mo | $182,500 | $109 | 48 |
| 134 N 82nd St | 0.60mi | 4/2.0 (+1) | 1,431 (-10%) | 6mo | $199,000 | $139 | 41 |
| 7117 Gary Dr | 0.70mi | 3/1.0 | 1,424 (-11%) | 2mo | $185,000 | $130 | 40 |
Match score weights: distance 35% · size 25% · config 20% · recency 20%. Top-matched comps best support the ARV.
Projected returns pro-forma
9.5% appreciation · 3.0% rent growth · sell at horizon
- IRR
- 20.0%
- Equity multiple
- 2.59×
- Total profit
- $82,226
- Equity at exit
- $159,952
- IRR
- 18.4%
- Equity multiple
- 5.84×
- Total profit
- $250,481
- Equity at exit
- $338,044
Cash invested: $51,800 (down + closing). Projections, not guarantees.
Landlord ↔ Tenant lean methodology
- Overall (STATE)
- 43 Moderately Tenant-Leaning
- State Illinois
- 43 Moderately Tenant-Leaning · D+7
- County
- — inherits STATE
- City
- — inherits STATE
ZIP-level market 62223
- Home prices YoY
- 3.8%
- Active inventory
- 103
- Price-to-rent
- 10.2×
Monthly cashflow live
- Estimated rent
- $1,506 medium interval (Pro) →
- Mortgage (P&I)
- −$970
- Tax from tax record
- −$336 /mo · $4,030/yr
- Insurance
- −$77
- HOA
- −$0
- Vacancy / Maint / Mgmt
- −$316
- Net cashflow
- $-193
Break-even live
UW: 25.0% down · 7.5% · 30yr · 1.5% tax · 5.0% vac · 8.0% maint · 8.0% mgmt
Financing live
Cash to close
- Down payment
- $46,250
- Closing costs
- $5,550
- Reserves months
- —
- Total cash needed
- —
Loan-product check · same deal, 3 products live
Conventional
25% down · 7.5% · 30yr
- Down + closing
- —
- Monthly P&I
- —
- Monthly cashflow
- —
- DSCR
- —
- Eligible?
- —
Personal DTI + credit; lowest rate.
DSCR
20% down · 8.5% · 30yr
- Down + closing
- —
- Monthly P&I
- —
- Monthly cashflow
- —
- DSCR
- —
- Eligible?
- —
No personal income docs; deal must DSCR.
Hard money
10% down · 12.0% · 12mo
- Down + closing
- —
- Monthly P&I
- —
- Monthly cashflow
- —
- DSCR
- —
- Eligible?
- —
Short-term bridge; refi at stabilization.
Rent comps 4 comps
| Address | Beds | Baths | Sqft | Rent | $/sqft | DOM | Units | Dist |
|---|---|---|---|---|---|---|---|---|
| 6105 W Washington St Belleville, IL | 3.0 | 1.5 | 1120 | $1,575 | $1.41 | 23d | 1 | 0.60mi |
| 18 Dorchester Dr Belleville, IL | 3.0 | 3.0 | 2112 | $1,650 | $0.78 | 1d | 1 | 0.81mi |
| 920 S 74th St Belleville, IL | 2.0 | 1.0 | 1300 | $1,400 | $1.08 | 12d | 1 | 0.86mi |
| 4824 Bier St Belleville, IL | 4.0 | 1.0 | 1200 | $1,350 | $1.12 | 2d | 1 | 1.32mi |
Listing history 8 events
-
2026-06-18status $185,000 Pending 6 DOM
-
2026-06-18days on market $185,000 Active 6 DOM
-
2026-06-17days on market $185,000 Active 5 DOM
-
2026-06-16days on market $185,000 Active 4 DOM
-
2026-06-15days on market $185,000 Active 3 DOM
-
2026-06-13status $185,000 Active 1 DOM
-
2026-06-10remarks 699-char remark
-
2026-06-10$185,000 Coming Soon 1 DOM
ⓘ Source: listings_history table (triggers on properties + properties_extension) + one-shot
backfill from property_details.listing_events for pre-trigger history.
Tax reassessment forecast IL · Partial reset (capped growth)
- Current annual tax
- $4,030 · $336/mo
- Projected year-2 tax
- $4,115 · $343/mo
- Expected delta
- +$85/yr (+$7/mo · 2.1%)
ⓘ Screening estimate from a state-policy table — verify with the county assessor before closing.
Climate risk First Street
- Flood 1/10 Low FEMA zone X · 0% chance over 30 yrs
- Wildfire 1/10 Low
- Heat 5/10 Major 7 d/yr ≥107°F today · 21 d/yr by 30 yrs out
- Wind 2/10 Low 100% chance of damaging wind over 30 yrs
- Air quality 3/10 Moderate 2 unhealthy d/yr today · 4 by 30 yrs out
Nearby sold comps map
Loading sold comps map…
Walkable amenities ~0.75 mi
Loading nearby amenities…
Taxation est. · year 1
- Rental income
- $18,073
- − Mortgage interest
- −$10,363
- − Property taxes
- −$4,030
- − Insurance
- −$925
- − Repairs & maintenance
- −$1,446
- − Management
- −$1,446
- − Depreciation
- −$5,382
- Taxable loss
- −$5,518
- Est. tax savings @ 24.0%
- +$1,324
- After-tax cash flow
- $-995/yr
For passive investors: Depreciation is non-cash, so a rental often shows a tax loss while cash-flowing — sheltering income. Rental losses are passive: they offset passive income freely, and up to $25,000/yr can offset ordinary (W-2) income if you actively participate and your MAGI is under $100k (phasing out to $0 by $150k); unused losses carry forward. On sale, claimed depreciation is recaptured at up to 25%, and gains may owe capital-gains tax (a 1031 exchange can defer both). Figures are a year-1 estimate at your 24.0% rate — not tax advice; consult a CPA.
Schools (NCES district)
- District
- Belleville Twp Hsd 201
- NCES district ID
- 1705640
- Math proficiency
- 21% ▼ -8.00%
- Reading proficiency
- 28% ▼ -3.00%
- Median HH income
- $58,064
- Composite
- 22.39/100
- National rank
- #8115
- State rank
- #308 of 620 in IL
Livability — Belleville
- Score
- 78/100
- State rank
- #142
- US rank
- #2604
Category grades
Schools grade is shown separately in the Schools card above.
Census & demographics
- Census place
- Belleville, IL
- County
- Saint Clair County · 169,691 people
- City population
- 47,407
- Metro
- St. Louis, MO-IL
- Population (ZIP)
- 16,269
- Household income
- $73,700
- Rent vs Own
- Severe rent burden
- 656.0
Population outlook (St. Clair County) Hauer SSP2
- Today (2025)
- 250,366 people
- By 2030
- 240,511 · -3.9%
- By 2040
- 217,391 · -13.2%
- By 2050
- 192,699 · -23.0%
- By 2075
- 140,637 · -43.8%
- By 2100
- 100,499 · -59.9%
Race, ethnicity, and origin ACS 2023
- Neighborhood character
- Majority White (62%)
- Race & ethnicity
- White 62% Black 27% Two or more races 9% Hispanic / Latino 4%
- Common ancestry
- Romanian 3% Lithuanian 3% Slovak 2%
- Foreign-born
- 2% · Canada, Guatemala
- Languages at home
- 96% English-only · Spanish 2%
Political lean MEDSL · St. Clair
- 2024 margin
- Lean D (+7.9) · D 53.0% · R 45.1% · Other 1.8%
- 2008→2024 swing
- -14.6pp toward R · 2008: 22.4pp · 2024: 7.9pp
- All cycles
- 2024: D+7.9 2020: D+8.7 2016: D+5.6 2012: D+14.5 2008: D+22.4
Not yet ingested
- Civics
- —
Market trends
- HPI YoY
- ▲ 9.50%
- Current HPI
- 259.15
- Rent YoY
- —
- Metro
- St. Louis, MO-IL
- State GDP YoY
- ▲ 1.59%
- F500 in state
- 60
Industry mix (Fortune 500 HQ in IL)
| Industry | F500 HQs | Revenue |
|---|---|---|
| Insurance | 4 | $201B |
|
||
| Consumer Goods | 4 | $87B |
|
||
| Industrial Machinery | 3 | $64B |
|
||
| Healthcare | 2 | $55B |
|
||
| Retail / Pharmacy | 1 | $148B |
|
||
| Agriculture / Food | 1 | $86B |
|
||
Price history
+164.3% since first listed14 events — show timeline
- 2026-06-09 Coming Soon $185,000 MARIS as Distributed by MLS Grid
- 2018-10-25 Sold (Public Records) $62,500 Public Records
- 2018-10-19 Sold (MLS) — MARIS as Distributed by MLS Grid
- 2018-08-19 Pending — MARIS as Distributed by MLS Grid
- 2018-08-11 Price Changed $74,000 MARIS as Distributed by MLS Grid
- 2018-05-24 Price Changed $79,000 MARIS as Distributed by MLS Grid
- 2018-04-03 Listed $89,000 MARIS as Distributed by MLS Grid
- 2017-11-10 Price Changed $59,000 MARIS as Distributed by MLS Grid
- 2017-10-13 Price Changed $84,900 MARIS as Distributed by MLS Grid
- 2017-09-20 Price Changed $89,900 MARIS as Distributed by MLS Grid
- 2017-08-09 Price Changed $103,550 MARIS as Distributed by MLS Grid
- 2007-11-19 Sold (Public Records) $110,500 Public Records
- 1997-09-29 Sold (Public Records) $70,000 Public Records
- 1997-09-29 Sold (Public Records) $70,000 Public Records
Property tax history
+3.3%/yrLatest (2024): $4,030 · +26.5% YoY. Source: county tax records.
Cash-flow waterfall
monthlySold comps — $/sqft
last 12 mo · ≤1 miLoading sold comps…