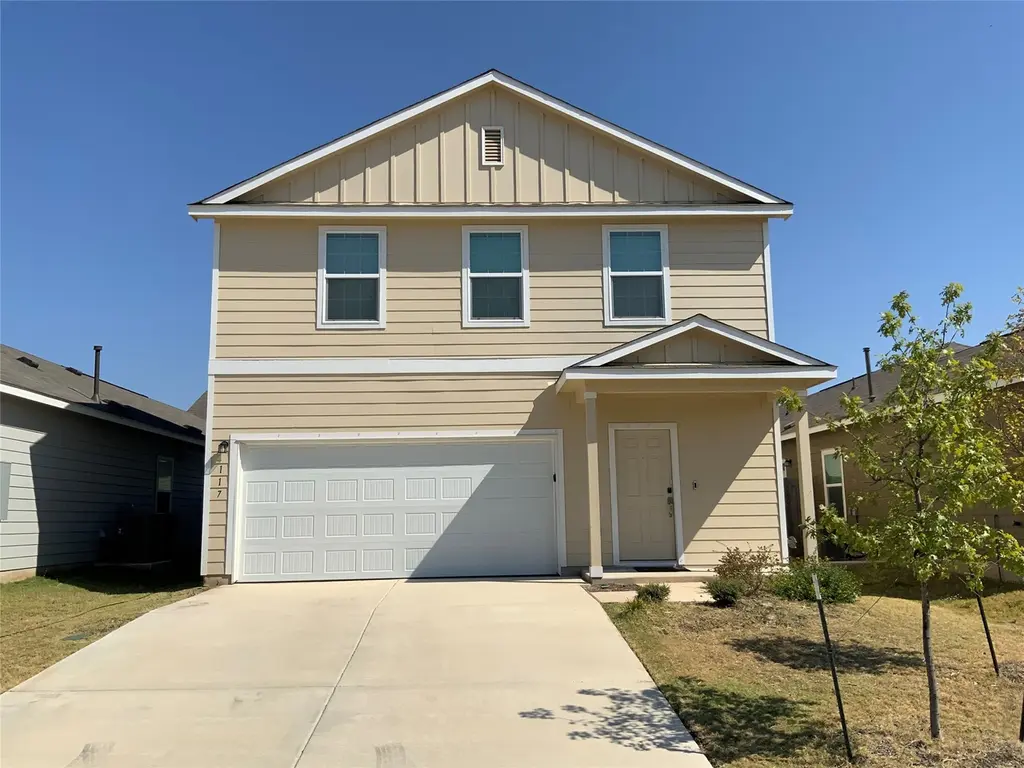
117 Citrine Crst · San Marcos, TX
Flood risk 1/10 · Minimal
- FEMA flood zone
- X (unshaded)
- Chance of flooding over 30 yrs
- 0.0%
- Est. flood insurance / yr
- $507 – $1,088
Fire risk 3/10 · Minor
- Est. fire insurance / yr
- $1,222 – $2,270
Heat risk 8/10 · Major
- Hot days now (above 108°F)
- 7 days/yr
- Hot days in 30 yrs
- 22 days/yr
Wind risk 8/10 · Major
- Chance of severe wind over 30 yrs
- 80.0%
Air-quality risk 1/10 · Minimal
- Unhealthy air days now
- 0 days/yr
- Unhealthy air days in 30 yrs
- 0 days/yr
Risk factors via First Street. Map © Google.
Why this score? — see what drove the D- grade
The composite is a weighted blend of 9 inputs, each scored 0–100. Each bar is that input's sub-score; the figure is the points it added to the 100-point composite (weight × sub-score).
- ARV discount +13.7/15.0
- Cash flow +6.4/30.0
- Appreciation +4.5/10.0
- Livability +4.0/5.0
- Schools +3.5/10.0
- Condition / age +2.5/5.0
- 1% rule +2.4/10.0
- Rent growth +1.2/5.0
- DSCR +0.7/10.0
$270,000
🖨 Deal sheet (PDF) 📄 Offer letter ✓ Due diligence
Listing remarks MLS
Amazing 2022 year built Lennar home that is in move in condition with an excellent lay out! As you enter the home, you are met with the wide open great room that feeds into an upgraded kitchen completed with Stainless Steel Appliances including Gas Cooktop, built in microwave, dishwasher, and refrigerator. Vinyl Laminate flooring through out and paint is in excellent condition!!! Primary and secondary bedrooms are all located upstairs with a spacious loft area for separate living space.
Key facts
- Gas cooktop
- Spacious loft area
- Upgraded kitchen
Tags
Neighborhood map
What this means for you Summary
Snapshot
- This is a 4-bed/2.5-bath single-family listed at $270k.
Deal economics
- At list price, monthly cash flow is $-470 ($-6k/yr) — negative.
- To cash-flow at today's rent, offer at most $187k (30.8% below list).
- To meet the 1% rule (rent ≥ 1% of price), the offer needs to be $200k (26.0% below list).
- Recommended offer: $187k (30.8% below list) — sets the bar for cash-flow.
- Cap rate 4.2% vs local median 3.2% in San Marcos — top-decile yield for the area; either an underpriced asset or a hidden risk that comps aren't pricing in. Stress-test before assuming the spread holds.
Location & tenants
- Location reads 81/100 on livability (#30 in TX, #1,601 nationally) — a professional / high-income tenant draw. Strengths: amenities A+, cost of living A+, health & safety A+; Watch: crime D+, schools F, employment F.
- Hays CISD (rural): math 35% / reading 41% proficiency, ranked #390 of 826 in TX (top 47%) — families likely to look elsewhere, expect single-tenant / working-renter base with shorter leases.
- Market conditions: Rents falling (-5.4%/yr); 325 active listings in the ZIP; 40 comparable units currently listed for rent nearby; rentals at typical pace (median 19d on market — plan ~3-4 weeks tenant-placement turnaround); solid renter incomes; 5,270 units permitted in Hays County in 2024 (1,464 in 5+ unit buildings).
Forward outlook
- Local home prices are declining (-1.0%/yr); year-one equity from $2k of loan paydown is wiped out by about $3k of value loss. Plan a longer hold.
- Hays County population projected at +93% by 2050 — long-run rental-demand tailwind backs the buy-and-hold thesis.
Negotiation context
- It's been on market 104 days — a 9% lower offer ($246k) is reasonable based on typical stale-listing flexibility.
- 3 sale attempts since 3y ago with the ask held roughly flat each time — persistent listings suggest the price (not the market) is what's stuck; bring a comps-based counter.
Risks & watch-outs
- Climate carrying-cost: severe wind risk, 80% chance of damaging wind over 30y; extreme-heat days projected 7→22/yr by 2055 (HVAC capex compounding) — expect insurance premiums to compound above CPI over the hold.
Questions for the listing agent
- What do current leases actually rent for vs. the listed asking? Can we see a recent rent roll and the last 12 months of T-12 income?
- It's been on market 104 days. Have you received any prior offers? Is the seller open to a 31% concession, seller financing, or rate buy-down credit?
- What does the HOA fee cover, when was the last increase, and are there any pending special assessments or reserve-fund shortfalls?
- Why hasn't it sold? Are there any deal-killer items the seller is aware of (foundation, flood, title, zoning, code violations)?
- Is there a deadline driving the sale (1031 exchange, divorce, estate, relocation)? That informs how much negotiation room exists.
- Schools are F-rated, which usually means shorter tenancies and higher turnover. Who's the typical renter profile here, and what's been the actual vacancy rate?
- Crime grade is D in this area — have there been break-ins, vandalism, or insurance claims at this property in the last 3 years? What carrier currently insures it and at what premium?
- The area grade is low — what's the realistic commute time and amenity access for the typical tenant pool here? Any planned neighborhood developments (good or bad) we should know about?
- What's the average days-on-market for RENTAL listings here right now (not sales)? A rising rental-DOM trend means longer vacancies and softer asking-rent achievability than the comps imply.
- What's the recent tenant-quality profile in this submarket — average credit score on applications, eviction rate, late-payment / NSF rate, and stable-employment percentage? A property-management company in the area should have these aggregated.
- How much new for-sale + rental construction is in the pipeline within 1–3 miles? Heavy new supply typically softens prices + rents 12–24 months out; constrained supply supports both.
Investment metrics
- 1% rule
- 0.74% ✗
- Cap rate
- 4.20%
- Cash-on-cash
- -7.47%
- DSCR
- 0.67
- GRM
- 11.3
CMA / ARV
- ARV (median comp)
- $313,462
- List price
- $270,000
- Delta
- -13.87%
- Verdict
- UNDERPRICED
- Comps
- 20 within 1.0 mi
Show comp detail 12 sales within ~0.75 mi
| Address | Dist | Beds/Ba | Sqft | Sold | Price | $/sf | Match |
|---|---|---|---|---|---|---|---|
| 482 Low Pasture Trl | 0.20mi | 4/2.5 | 1,892 (-5%) | 3mo | $314,990 | $166 | 81 |
| 182 Geode Gln | 0.26mi | 4/2.5 | 1,950 (-2%) | 6mo | $229,900 | $118 | 80 |
| 453 Soapstone Pass | 0.32mi | 4/2.5 | 1,984 (0%) | 9mo | $237,500 | $120 | 78 |
| 385 Soapstone Pass | 0.32mi | 4/2.5 | 1,837 (-7%) | 1mo | $229,900 | $125 | 72 |
| 356 Jade St | 0.58mi | 4/2.5 | 1,997 (+1%) | 7mo | $321,630 | $161 | 66 |
| 342 Jade St | 0.59mi | 4/2.5 | 2,072 (+4%) | 4mo | $294,270 | $142 | 62 |
| 937 Soapstone Pass | 0.60mi | 3/2.5 (-1) | 1,834 (-8%) | 3mo | $264,990 | $144 | 52 |
| 961 Soapstone Pass | 0.62mi | 3/2.5 (-1) | 1,834 (-8%) | 4mo | $264,990 | $144 | 50 |
| 172 Ammolite Ln | 0.57mi | 4/2.5 | 1,802 (-9%) | 11mo | $243,990 | $135 | 49 |
| 305 Jade St | 0.64mi | 4/2.5 | 2,265 (+14%) | 1mo | $299,990 | $132 | 46 |
| 1200 Soapstone Pass | 0.64mi | 4/2.5 | 1,802 (-9%) | 11mo | $241,990 | $134 | 46 |
| 136 Zircon Ln | 0.65mi | 3/2.5 (-1) | 1,857 (-6%) | 11mo | $299,990 | $162 | 45 |
Match score weights: distance 35% · size 25% · config 20% · recency 20%. Top-matched comps best support the ARV.
Projected returns pro-forma
-1.02% appreciation · 0.0% rent growth · sell at horizon
- IRR
- -18.0%
- Equity multiple
- 0.26×
- Total profit
- $-56,305
- Equity at exit
- $64,855
- IRR
- -14.4%
- Equity multiple
- -0.16×
- Total profit
- $-87,968
- Equity at exit
- $67,830
Cash invested: $75,600 (down + closing). Projections, not guarantees.
Landlord ↔ Tenant lean methodology
- Overall (STATE)
- 87 Strongly Landlord-Friendly
- State Texas
- 87 Strongly Landlord-Friendly · R+5
- County
- — inherits STATE
- City
- — inherits STATE
ZIP-level market 78656
- Home prices YoY
- -0.5%
- Rents YoY
- -5.4%
- Active inventory
- 325
- Price-to-rent
- 11.3×
Monthly cashflow live
- Estimated rent
- $1,997 high interval (Pro) →
- Mortgage (P&I)
- −$1,416
- Tax from tax record
- −$459 /mo · $5,513/yr
- Insurance
- −$112
- HOA
- −$60
- Vacancy / Maint / Mgmt
- −$419
- Net cashflow
- $-470
Break-even live
Sensitivity live
| Price | -10% $-318 | -5% $-394 | +0% $-470 | +5% $-547 | +10% $-623 |
|---|---|---|---|---|---|
| Rent | -10% $-628 | -5% $-549 | +0% $-470 | +5% $-392 | +10% $-313 |
| Rate | -1.0pp $-335 | -0.5pp $-402 | base $-470 | +0.5pp $-540 | +1.0pp $-612 |
UW: 25.0% down · 7.5% · 30yr · 1.5% tax · 5.0% vac · 8.0% maint · 8.0% mgmt
Financing live
Cash to close
- Down payment
- $67,500
- Closing costs
- $8,100
- Reserves months
- —
- Total cash needed
- —
Loan-product check · same deal, 3 products live
Conventional
25% down · 7.5% · 30yr
- Down + closing
- —
- Monthly P&I
- —
- Monthly cashflow
- —
- DSCR
- —
- Eligible?
- —
Personal DTI + credit; lowest rate.
DSCR
20% down · 8.5% · 30yr
- Down + closing
- —
- Monthly P&I
- —
- Monthly cashflow
- —
- DSCR
- —
- Eligible?
- —
No personal income docs; deal must DSCR.
Hard money
10% down · 12.0% · 12mo
- Down + closing
- —
- Monthly P&I
- —
- Monthly cashflow
- —
- DSCR
- —
- Eligible?
- —
Short-term bridge; refi at stabilization.
Rent comps 40 comps
| Address | Beds | Baths | Sqft | Rent | $/sqft | DOM | Units | Dist |
|---|---|---|---|---|---|---|---|---|
| 566 Gabbro Gdns Maxwell, TX | 4.0 | 2.5 | 1837 | $1,850 | $1.01 | 17d | 1 | 0.02mi |
| 543 Gabbro Gdns Maxwell, TX | 4.0 | 2.0 | 1627 | $1,695 | $1.04 | 23d | 1 | 0.04mi |
| 328 Mica Trl Maxwell, TX | 4.0 | 2.0 | 1627 | $1,595 | $0.98 | 45d | 1 | 0.09mi |
| 253 Fairlawn Way Maxwell, TX | 3.0 | 2.5 | 1919 | $2,235 | $1.16 | 25d | 1 | 0.12mi |
| 300 Geode Gln Maxwell, TX | 4.0 | 2.5 | 1712 | $1,795 | $1.05 | 45d | 1 | 0.16mi |
| 283 Soapstone Pass Maxwell, TX | 3.0 | 2.0 | 1440 | $1,609 | $1.12 | 17d | 1 | 0.21mi |
| 230 Gabbro Gdns Maxwell, TX | 3.0 | 2.0 | 1440 | $1,500 | $1.04 | 19d | 1 | 0.22mi |
| 312 Soapstone Pass Maxwell, TX | 3.0 | 2.0 | 1450 | $1,600 | $1.10 | 45d | 1 | 0.24mi |
| 192 Gabbro Gdns Maxwell, TX | 4.0 | 2.5 | 1610 | $1,699 | $1.06 | 45d | 1 | 0.25mi |
| 275 Aplite Pass Maxwell, TX | 2.0–5.0 | 2.0–3.5 | 1733 | $2,420 | $1.40 | 0d | 1 | 0.31mi |
| 147 Gabbro Gdns Maxwell, TX | 3.0 | 2.0 | 1450 | $1,441 | $0.99 | 45d | 1 | 0.31mi |
| 296 Agate Cliff Dr Maxwell, TX | 3.0 | 2.0 | 1421 | $1,675 | $1.18 | 0d | 1 | 0.31mi |
| 351 Cobb Branch Dr Maxwell, TX | 3.0–4.0 | 2.0–3.0 | 1616 | $1,950 | $1.21 | 0d | 4 | 0.31mi |
| 1413 Soapstone Pass Maxwell, TX | 4.0 | 3.0 | 1952 | $2,500 | $1.28 | 45d | 1 | 0.46mi |
| 214 Kyanite Dr Maxwell, TX | 4.0 | 2.5 | 1535 | $1,650 | $1.07 | 45d | 1 | 0.54mi |
| 171 Haywood Mnr Maxwell, TX | 3.0 | 2.0 | 1533 | $1,850 | $1.21 | 5d | 1 | 0.55mi |
| 342 Jade St Maxwell, TX | 4.0 | 2.5 | 2072 | $1,975 | $0.95 | 45d | 1 | 0.57mi |
| 124 Hidden Branch Cv Maxwell, TX | 3.0 | 2.5 | 1698 | $1,800 | $1.06 | 0d | 1 | 0.61mi |
| 274 Jade St Maxwell, TX | 4.0 | 2.0 | 1468 | $1,795 | $1.22 | 45d | 1 | 0.62mi |
| 170 White Dunes Dr Maxwell, TX | 3.0 | 3.0 | 2122 | $1,795 | $0.85 | 5d | 1 | 0.62mi |
| 170 White Dunes Dr Maxwell, TX | 3.0 | 2.5 | 2122 | $1,795 | $0.85 | 19d | 1 | 0.62mi |
| 146 White Dunes Dr Maxwell, TX | 3.0 | 2.5 | 1698 | $1,850 | $1.09 | 13d | 1 | 0.64mi |
| 146 White Dunes Dr Maxwell, TX | 3.0 | 2.0 | 1698 | $1,850 | $1.09 | 45d | 1 | 0.64mi |
| 251 Tempest Trl Maxwell, TX | 3.0 | 2.0 | 1553 | $1,650 | $1.06 | 19d | 1 | 0.64mi |
| 108 White Dunes Dr Maxwell, TX | 3.0 | 2.0 | 1514 | $1,800 | $1.19 | 5d | 1 | 0.67mi |
| 108 White Dunes Dr Maxwell, TX | 3.0 | 2.0 | 1514 | $1,800 | $1.19 | 19d | 1 | 0.67mi |
| 108 White Dunes Dr Maxwell, TX | 3.0 | 2.0 | 1514 | $1,800 | $1.19 | 25d | 1 | 0.67mi |
| 293 Tempest Trl Maxwell, TX | 3.0 | 2.5 | 1698 | $1,825 | $1.07 | 5d | 1 | 0.68mi |
| 211 Living Reef Dr Maxwell, TX | 3.0 | 2.5 | 1782 | $1,840 | $1.03 | 19d | 1 | 0.71mi |
| 195 Living Reef Dr Maxwell, TX | 3.0 | 2.5 | 1782 | $1,900 | $1.07 | 5d | 1 | 0.72mi |
| 1259 Delta Crst Maxwell, TX | 4.0 | 2.0 | 1522 | $1,695 | $1.11 | 18d | 1 | 0.73mi |
| 170 Bright Flora Ln Maxwell, TX | 4.0 | 2.5 | 2312 | $1,950 | $0.84 | 45d | 1 | 0.73mi |
| 151 Living Reef Dr Maxwell, TX | 3.0 | 2.5 | 1782 | $1,895 | $1.06 | 5d | 1 | 0.75mi |
| 170 Living Reef Dr Maxwell, TX | 3.0 | 2.0 | 1500 | $1,850 | $1.23 | 45d | 1 | 0.76mi |
| 444 Delta Crst Maxwell, TX | 3.0 | 2.5 | 1830 | $1,850 | $1.01 | 5d | 1 | 0.77mi |
| 188 Thistle Ln Maxwell, TX | 5.0 | 3.0 | 2618 | $3,200 | $1.22 | 0d | 1 | 0.88mi |
| 704 Delta Crst Maxwell, TX | 3.0–5.0 | 2.0–3.0 | 1904 | $1,822 | $0.96 | 0d | 19 | 0.97mi |
| 531 Paris St Maxwell, TX | 4.0 | 2.0 | 1667 | $1,950 | $1.17 | 3d | 1 | 1.13mi |
| 839 Gully St Maxwell, TX | 2.0–4.0 | 2.0 | 1105 | $1,832 | $1.66 | 0d | 306 | 1.13mi |
| 205 E Lima Dr Maxwell, TX | 4.0 | 2.0 | 1700 | $1,899 | $1.12 | 0d | 1 | 1.17mi |
HOA detail
- Monthly dues
- $60 · $720/yr
- Likely covers
- gas
Listing history 26 events
-
2026-06-21days on market $270,000 Active 104 DOM
-
2026-06-18days on market $270,000 Active 101 DOM
-
2026-06-17days on market $270,000 Active 100 DOM
-
2026-06-16days on market $270,000 Active 99 DOM
-
2026-06-15days on market $270,000 Active 98 DOM
-
2026-06-13days on market $270,000 Active 96 DOM
-
2026-06-09days on market $270,000 Active 92 DOM
-
2026-06-08days on market $270,000 Active 91 DOM
-
2026-06-07days on market $270,000 Active 90 DOM
-
2026-06-05days on market $270,000 Active 87 DOM
-
2026-06-03days on market $270,000 Active 86 DOM
-
2026-06-02days on market $270,000 Active 85 DOM
-
2026-06-01days on market $270,000 Active 84 DOM
-
2026-05-31days on market $270,000 Active 83 DOM
-
2026-03-09$270,000 Active 491-char remark
Show marketing remark (491 chars)
Amazing 2022 year built Lennar home that is in move in condition with an excellent lay out! As you enter the home, you are met with the wide open great room that feeds into an upgraded kitchen completed with Stainless Steel Appliances including Gas Cooktop, built in microwave, dishwasher, and refrigerator. Vinyl Laminate flooring through out and paint is in excellent condition!!! Primary and secondary bedrooms are all located upstairs with a spacious loft area for separate living space.
-
2025-08-06price
-
2025-07-10price
-
2025-06-20price
-
2025-05-16price
-
2025-04-02price
-
2025-03-19price
-
2025-01-31Active
-
2023-09-01historical $2,099
-
2023-07-14historical $2,099
-
2023-07-13$2,099
-
2023-07-12price $2,029
ⓘ Source: listings_history table (triggers on properties + properties_extension) + one-shot
backfill from property_details.listing_events for pre-trigger history.
Tax reassessment forecast TX · Resets to sale price
- Current annual tax
- $5,513 · $459/mo
- Projected year-2 tax
- $5,513 · $459/mo
- Expected delta
- $0/yr ($0/mo · 0.0%)
ⓘ Screening estimate from a state-policy table — verify with the county assessor before closing.
Climate risk First Street
- Flood 1/10 Low FEMA zone X (unshaded) · 0% chance over 30 yrs
- Wildfire 3/10 Moderate
- Heat 8/10 Severe 7 d/yr ≥108°F today · 22 d/yr by 30 yrs out
- Wind 8/10 Severe 80% chance of damaging wind over 30 yrs
- Air quality 1/10 Low 0 unhealthy d/yr today · 0 by 30 yrs out
Nearby sold comps map
Loading sold comps map…
Walkable amenities ~0.75 mi
Loading nearby amenities…
Taxation est. · year 1
- Rental income
- $23,960
- − Mortgage interest
- −$15,124
- − Property taxes
- −$5,513
- − Insurance
- −$1,350
- − Repairs & maintenance
- −$1,917
- − Management
- −$1,917
- − HOA
- −$720
- − Depreciation
- −$7,855
- Taxable loss
- −$10,435
- Est. tax savings @ 24.0%
- +$2,505
- After-tax cash flow
- $-3,141/yr
For passive investors: Depreciation is non-cash, so a rental often shows a tax loss while cash-flowing — sheltering income. Rental losses are passive: they offset passive income freely, and up to $25,000/yr can offset ordinary (W-2) income if you actively participate and your MAGI is under $100k (phasing out to $0 by $150k); unused losses carry forward. On sale, claimed depreciation is recaptured at up to 25%, and gains may owe capital-gains tax (a 1031 exchange can defer both). Figures are a year-1 estimate at your 24.0% rate — not tax advice; consult a CPA.
Schools (NCES district)
- District
- Hays CISD
- NCES district ID
- 4800010
- Math proficiency
- 35% ▼ -15.00%
- Reading proficiency
- 41% ▼ -5.00%
- Median HH income
- $70,570
- Composite
- 34.78/100
- National rank
- #5118
- State rank
- #390 of 826 in TX
Livability — San Marcos
- Score
- 81/100
- State rank
- #30
- US rank
- #1601
Category grades
Schools grade is shown separately in the Schools card above.
Census & demographics
- County
- Caldwell County · 25,195 people
- City population
- 88,583
- Metro
- Austin-Round Rock-Georgetown, TX
- Population (ZIP)
- 2,847
- Household income
- $81,346
- Rent vs Own
- Severe rent burden
- 89.0
Population outlook (Hays County) Hauer SSP2
- Today (2025)
- 286,948 people
- By 2030
- 336,923 · +17.4%
- By 2040
- 441,894 · +54.0%
- By 2050
- 553,462 · +92.9%
- By 2075
- 838,261 · +192.1%
- By 2100
- 1,063,658 · +270.7%
Race, ethnicity, and origin ACS 2023
- Neighborhood character
- Predominantly Hispanic (76%)
- Race & ethnicity
- Hispanic / Latino 76% Two or more races 21% White 20% Black 4%
- Hispanic origin (detail)
- Mexican 72%
- Common ancestry
- Romanian 4% Slovak 2% Lithuanian 1%
- Foreign-born
- 18% · Canada
- Languages at home
- 45% English-only · Spanish 55%
Political lean MEDSL · Hays
- 2024 margin
- Lean D (+5.7) · D 52.1% · R 46.5% · Other 1.4%
- 2008→2024 swing
- +7.7pp toward D · 2008: -2.0pp · 2024: 5.7pp
- All cycles
- 2024: D+5.7 2020: D+10.8 2016: R+0.9 2012: R+10.4 2008: R+2.0
Not yet ingested
- Civics
- —
Market trends
- HPI YoY
- ▼ -1.02%
- Current HPI
- 228.3622
- Rent YoY
- ▼ -5.36%
- Metro
- Austin-Round Rock-Georgetown, TX
- State GDP YoY
- ▲ 3.95%
- F500 in state
- 110
Industry mix (Fortune 500 HQ in TX)
| Industry | F500 HQs | Revenue |
|---|---|---|
| Energy | 16 | $1,198B |
|
||
| Technology | 5 | $198B |
|
||
| Engineering / Construction | 4 | $72B |
|
||
| Energy Services | 3 | $60B |
|
||
| Utilities | 3 | $41B |
|
||
| Healthcare | 2 | $330B |
|
||
Price history
+13207.0% since first listed12 events — show timeline
- 2026-03-09 Listed $270,000 Unlock MLS
- 2025-08-06 Price Changed — Unlock MLS
- 2025-07-10 Price Changed — Unlock MLS
- 2025-06-20 Price Changed — Unlock MLS
- 2025-05-16 Price Changed — Unlock MLS
- 2025-04-02 Price Changed — Unlock MLS
- 2025-03-19 Price Changed — Unlock MLS
- 2025-01-31 Listed — Unlock MLS
- 2023-09-01 Rental Removed $2,099 ACTRIS
- 2023-07-14 Rental Removed $2,099 RENT.
- 2023-07-13 Listed for Rent $2,099 ACTRIS
- 2023-07-12 Price Changed $2,029 RENT.
Property tax history
+85.3%/yrLatest (2025): $5,513 · -4.8% YoY. Source: county tax records.
Cash-flow waterfall
monthlySold comps — $/sqft
last 12 mo · ≤1 miLoading sold comps…