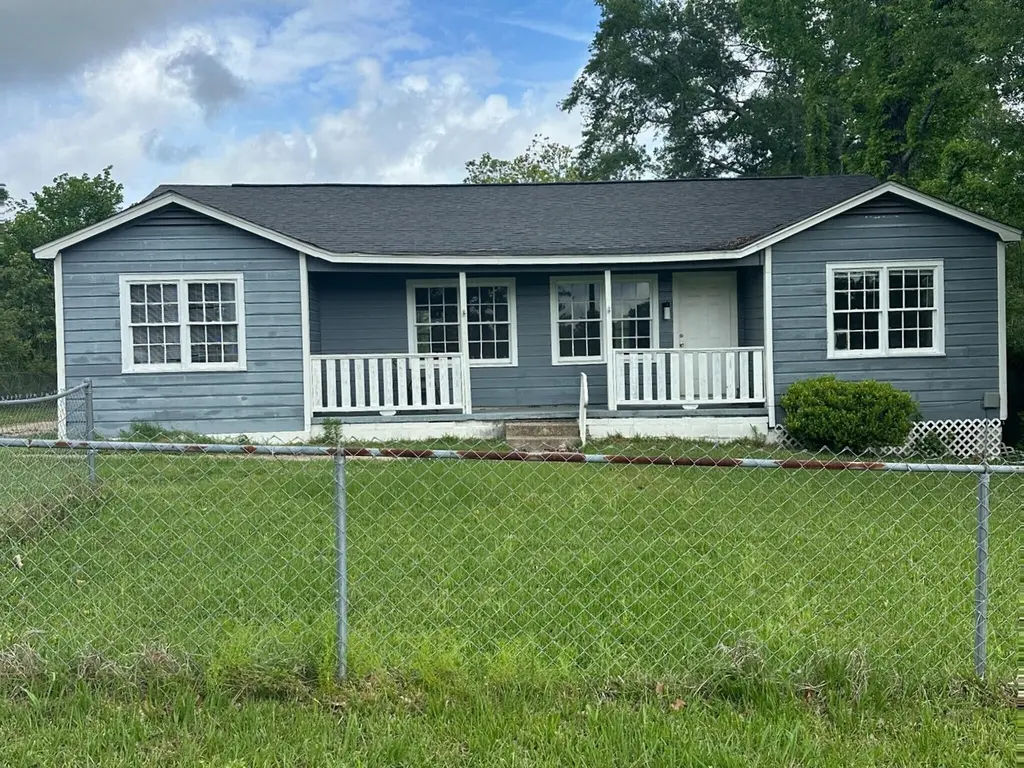
2100 Merritt · Leesville, LA
Flood risk 1/10 · Minimal
- FEMA flood zone
- X (unshaded)
- Chance of flooding over 30 yrs
- 0.0%
- Est. flood insurance / yr
- $507 – $1,088
Fire risk 2/10 · Minimal
- Est. fire insurance / yr
- $1,269 – $2,357
Heat risk 8/10 · Major
- Hot days now (above 110°F)
- 7 days/yr
- Hot days in 30 yrs
- 20 days/yr
Wind risk 8/10 · Major
- Chance of severe wind over 30 yrs
- 97.0%
Air-quality risk 1/10 · Minimal
- Unhealthy air days now
- 0 days/yr
- Unhealthy air days in 30 yrs
- 0 days/yr
Risk factors via First Street. Map © Google.
Why this score? — see what drove the B+ grade
The composite is a weighted blend of 9 inputs, each scored 0–100. Each bar is that input's sub-score; the figure is the points it added to the 100-point composite (weight × sub-score).
- Cash flow +30.0/30.0
- ARV discount +15.0/15.0
- DSCR +10.0/10.0
- 1% rule +9.1/10.0
- Rent growth +4.9/5.0
- Livability +3.7/5.0
- Schools +3.6/10.0
- Condition / age +2.5/5.0
- Appreciation +0.0/10.0
$115,000
🖨 Deal sheet 📄 Offer letter ✓ Due diligence
Listing remarks MLS
This well-maintained 4-bedroom, 2-full-bath home offers a comfortable blend of space, function, and everyday convenience. Inside, you'll find a practical layout with spacious living areas, multiple flexible-use spaces, and abundant natural light that helps create a bright, welcoming feel throughout the home. The generously sized kitchen provides ample cabinet storage and workspace, while the bedrooms offer comfortable proportions and well-placed windows. The home has been cared for and provides a solid foundation for a buyer who appreciates livable space now with the option to make updates over time. Whether you need room for daily living, entertaining, hobbies, or a home office setup, the layout offers versatility to suit a range of uses.
Key facts
- 0.23 acre lot
- Listed 64 days
Neighborhood map
What this means for you Summary
Snapshot
- This is a 4-bed/2.0-bath single-family listed at $115k.
Deal economics
- At list price, monthly cash flow is $544 ($7k/yr) — positive.
- The deal already cash-flows at list — no discount required.
- Meets the 1% rule at list price ($2k rent vs $115k).
- Recommended offer: $108k (6.0% below list) — sets the bar for market timing.
- Cap rate 12.0% vs local median 7.3% in Leesville — top-decile yield for the area; either an underpriced asset or a hidden risk that comps aren't pricing in. Stress-test before assuming the spread holds.
Location & tenants
- Location reads 73/100 on livability (#30 in LA) — a middle-class / working-renter tenant base. Strengths: cost of living A+, health & safety A+, housing A; Watch: crime F, amenities F, commute F.
- Vernon Parish (rural): math 35% / reading 51% proficiency, ranked #18 of 98 in LA (top 18%) — families likely to look elsewhere, expect single-tenant / working-renter base with shorter leases.
- Market conditions: Rents rising fast (+9.6%/yr); 210 active listings in the ZIP; 1 comparable units currently listed for rent nearby; 26 units permitted in Vernon Parish in 2024 (0 in 5+ unit buildings).
- This rent runs 35% of the median local income ($56k/yr) — at the standard rent-burdened threshold; future hikes will face affordability resistance.
Forward outlook
- Local home prices are declining (-3.0%/yr); year-one equity from $795 of loan paydown is wiped out by about $3k of value loss. Plan a longer hold.
- Vernon County population projected at -25% by 2050 — secular population decline; favor cash flow + early exit over multi-decade hold.
- At projected returns (-3.0% appreciation + 8.0% rent growth), your $32k cash investment doubles in ~5 years — after that, you're playing with house money.
Negotiation context
- It's been on market 65 days — a 6% lower offer ($108k) is reasonable based on typical stale-listing flexibility.
- 3 sale attempts since 7y ago with the ask held roughly flat each time — persistent listings suggest the price (not the market) is what's stuck; bring a comps-based counter.
- Current owner paid $93k; 24% above their basis — modest negotiation headroom, anchor on the comps not their cost.
Risks & watch-outs
- Climate carrying-cost: severe wind risk, 97% chance of damaging wind over 30y; extreme-heat days projected 7→20/yr by 2055 (HVAC capex compounding) — expect insurance premiums to compound above CPI over the hold.
Questions for the listing agent
- It's been on market 65 days. Have you received any prior offers? Is the seller open to a 6% concession, seller financing, or rate buy-down credit?
- Why hasn't it sold? Are there any deal-killer items the seller is aware of (foundation, flood, title, zoning, code violations)?
- Is there a deadline driving the sale (1031 exchange, divorce, estate, relocation)? That informs how much negotiation room exists.
- Schools are B-rated — typically a magnet for longer-tenancy family renters. What's the average tenant stay here, and is there a school-zone premium baked into asking?
- Crime grade is F in this area — have there been break-ins, vandalism, or insurance claims at this property in the last 3 years? What carrier currently insures it and at what premium?
- What's the average days-on-market for RENTAL listings here right now (not sales)? A rising rental-DOM trend means longer vacancies and softer asking-rent achievability than the comps imply.
- What's the recent tenant-quality profile in this submarket — average credit score on applications, eviction rate, late-payment / NSF rate, and stable-employment percentage? A property-management company in the area should have these aggregated.
- How much new for-sale + rental construction is in the pipeline within 1–3 miles? Heavy new supply typically softens prices + rents 12–24 months out; constrained supply supports both.
Investment metrics
- 1% rule
- 1.41% ✓
- Cap rate
- 11.97%
- Cash-on-cash
- 20.29%
- DSCR
- 1.90
- GRM
- 5.9
CMA / ARV
- ARV (median comp)
- $165,106
- List price
- $115,000
- Delta
- -30.35%
- Verdict
- UNDERPRICED
- Comps
- 20 within 1.0 mi
Show comp detail 12 sales within ~0.75 mi
| Address | Dist | Beds/Ba | Sqft | Sold | Price | $/sf | Match |
|---|---|---|---|---|---|---|---|
| 2001 Ginger St | 0.06mi | 4/2.0 | 1,560 (-6%) | 1mo | $175,000 | $112 | 87 |
| 2004 Columbus Cir | 0.44mi | 3/2.0 (-1) | 1,731 (+4%) | 1mo | $192,000 | $111 | 66 |
| 1032 Hood Ln | 0.58mi | 4/1.5 | 1,660 (0%) | 15mo | $75,000 | $45 | 59 |
| 1908 Circles End | 0.35mi | 3/2.0 (-1) | 1,836 (+11%) | 4mo | $233,000 | $127 | 58 |
| 2005 Columbus Cir | 0.49mi | 4/2.0 | 1,850 (+11%) | 8mo | $175,000 | $95 | 51 |
| 802 Dennis Ave | 0.63mi | 3/4.0 (-1) | 1,725 (+4%) | 2mo | $140,000 | $81 | 50 |
| 2005 Allison St | 0.46mi | 4/1.0 | 1,795 (+8%) | 15mo | $164,000 | $91 | 49 |
| 907 Dennis Ave | 0.47mi | 3/1.0 (-1) | 1,449 (-13%) | 6mo | $70,000 | $48 | 43 |
| 902 S 10th St | 0.72mi | 4/2.0 | 1,824 (+10%) | 9mo | $240,000 | $132 | 43 |
| 2006 Allison St | 0.47mi | 3/1.0 (-1) | 1,495 (-10%) | 14mo | $120,000 | $80 | 41 |
| 1007 S 10th St | 0.72mi | 3/2.0 (-1) | 1,820 (+10%) | 7mo | $280,000 | $154 | 40 |
| 1209 Port Arthur Ter | 0.65mi | 3/2.5 (-1) | 1,785 (+8%) | 18mo | $245,000 | $137 | 36 |
Match score weights: distance 35% · size 25% · config 20% · recency 20%. Top-matched comps best support the ARV.
Projected returns pro-forma
-3.0% appreciation · 8.0% rent growth · sell at horizon
- IRR
- 17.8%
- Equity multiple
- 1.76×
- Total profit
- $24,602
- Equity at exit
- $17,147
- IRR
- 29.5%
- Equity multiple
- 4.26×
- Total profit
- $105,060
- Equity at exit
- $9,943
Cash invested: $32,200 (down + closing). Projections, not guarantees.
Landlord ↔ Tenant lean methodology
- Overall (STATE)
- 90 Strongly Landlord-Friendly
- State Louisiana
- 90 Strongly Landlord-Friendly · R+12
- County
- — inherits STATE
- City
- — inherits STATE
ZIP-level market 71446
- Home prices YoY
- -32.1%
- Rents YoY
- 9.6%
- Active inventory
- 210
- Price-to-rent
- 5.9×
Monthly cashflow live
- Estimated rent
- $1,623 medium interval (Pro) →
- Mortgage (P&I)
- −$603
- Tax from tax record
- −$87 /mo · $1,042/yr
- Insurance
- −$48
- HOA
- −$0
- Vacancy / Maint / Mgmt
- −$341
- Net cashflow
- $544
Break-even live
UW: 25.0% down · 7.5% · 30yr · 1.5% tax · 5.0% vac · 8.0% maint · 8.0% mgmt
Financing live
Cash to close
- Down payment
- $28,750
- Closing costs
- $3,450
- Reserves months
- —
- Total cash needed
- —
Loan-product check · same deal, 3 products live
Conventional
25% down · 7.5% · 30yr
- Down + closing
- —
- Monthly P&I
- —
- Monthly cashflow
- —
- DSCR
- —
- Eligible?
- —
Personal DTI + credit; lowest rate.
DSCR
20% down · 8.5% · 30yr
- Down + closing
- —
- Monthly P&I
- —
- Monthly cashflow
- —
- DSCR
- —
- Eligible?
- —
No personal income docs; deal must DSCR.
Hard money
10% down · 12.0% · 12mo
- Down + closing
- —
- Monthly P&I
- —
- Monthly cashflow
- —
- DSCR
- —
- Eligible?
- —
Short-term bridge; refi at stabilization.
Rent comps 1 comps
| Address | Beds | Baths | Sqft | Rent | $/sqft | DOM | Units | Dist |
|---|---|---|---|---|---|---|---|---|
| 1219 Port Arthur Ter Leesville, LA | 3.0 | 2.0 | 1800 | $1,400 | $0.78 | 43d | 1 | 0.58mi |
Listing history 29 events
-
2026-06-19days on market $115,000 Active 65 DOM
-
2026-06-18days on market $115,000 Active 64 DOM
-
2026-06-17days on market $115,000 Active 63 DOM
-
2026-06-16days on market $115,000 Active 62 DOM
-
2026-06-15days on market $115,000 Active 61 DOM
-
2026-06-14days on market $115,000 Active 59 DOM
-
2026-06-12days on market $115,000 Active 58 DOM
-
2026-06-09days on market $115,000 Active 55 DOM
-
2026-06-08days on market $115,000 Active 54 DOM
-
2026-06-07days on market $115,000 Active 53 DOM
-
2026-06-07days on market $115,000 Active 52 DOM
-
2026-06-04days on market $115,000 Active 49 DOM
-
2026-06-02days on market $115,000 Active 48 DOM
-
2026-06-01days on market $115,000 Active 47 DOM
-
2026-05-31days on market $115,000 Active 46 DOM
-
2026-05-31days on market $115,000 Active 45 DOM
-
2026-04-15$115,000 Active 749-char remark
Show marketing remark (749 chars)
This well-maintained 4-bedroom, 2-full-bath home offers a comfortable blend of space, function, and everyday convenience. Inside, you'll find a practical layout with spacious living areas, multiple flexible-use spaces, and abundant natural light that helps create a bright, welcoming feel throughout the home. The generously sized kitchen provides ample cabinet storage and workspace, while the bedrooms offer comfortable proportions and well-placed windows. The home has been cared for and provides a solid foundation for a buyer who appreciates livable space now with the option to make updates over time. Whether you need room for daily living, entertaining, hobbies, or a home office setup, the layout offers versatility to suit a range of uses.
-
2024-12-02soldstatus $93,000
-
2024-11-27soldstatus Closed 126-char remark
Show marketing remark (126 chars)
4 Bedrooms with 2 full baths with full fenced yard. MOTIVATED SELLER WILL CONSIDER ALL OFFERS. RECENTLY LEASED FOR $1100 MONTH
-
2024-09-18price $95,000 126-char remark
Show marketing remark (126 chars)
4 Bedrooms with 2 full baths with full fenced yard. MOTIVATED SELLER WILL CONSIDER ALL OFFERS. RECENTLY LEASED FOR $1100 MONTH
-
2024-09-05price $109,000 126-char remark
Show marketing remark (126 chars)
4 Bedrooms with 2 full baths with full fenced yard. MOTIVATED SELLER WILL CONSIDER ALL OFFERS. RECENTLY LEASED FOR $1100 MONTH
-
2024-08-16price $120,000 126-char remark
Show marketing remark (126 chars)
4 Bedrooms with 2 full baths with full fenced yard. MOTIVATED SELLER WILL CONSIDER ALL OFFERS. RECENTLY LEASED FOR $1100 MONTH
-
2024-07-16$145,000 Active 126-char remark
Show marketing remark (126 chars)
4 Bedrooms with 2 full baths with full fenced yard. MOTIVATED SELLER WILL CONSIDER ALL OFFERS. RECENTLY LEASED FOR $1100 MONTH
-
2022-08-09soldstatus
-
2022-03-16price $975
-
2019-11-04soldstatus $73,500
-
2019-08-02$79,900
-
2009-02-25soldstatus $38,000
-
2007-09-12soldstatus
ⓘ Source: listings_history table (triggers on properties + properties_extension) + one-shot
backfill from property_details.listing_events for pre-trigger history.
Tax reassessment forecast LA · Resets to sale price
- Current annual tax
- $1,042 · $87/mo
- Projected year-2 tax
- $1,042 · $87/mo
- Expected delta
- $0/yr ($0/mo · 0.0%)
ⓘ Screening estimate from a state-policy table — verify with the county assessor before closing.
Climate risk First Street
- Flood 1/10 Low FEMA zone X (unshaded) · 0% chance over 30 yrs
- Wildfire 2/10 Low
- Heat 8/10 Severe 7 d/yr ≥110°F today · 20 d/yr by 30 yrs out
- Wind 8/10 Severe 97% chance of damaging wind over 30 yrs
- Air quality 1/10 Low 0 unhealthy d/yr today · 0 by 30 yrs out
Nearby sold comps map
Loading sold comps map…
Walkable amenities ~0.75 mi
Loading nearby amenities…
Taxation est. · year 1
- Rental income
- $19,476
- − Mortgage interest
- −$6,442
- − Property taxes
- −$1,042
- − Insurance
- −$575
- − Repairs & maintenance
- −$1,558
- − Management
- −$1,558
- − Depreciation
- −$3,345
- Taxable income
- $4,956
- Est. tax owed @ 24.0%
- −$1,189
- After-tax cash flow
- $5,343/yr
For passive investors: Depreciation is non-cash, so a rental often shows a tax loss while cash-flowing — sheltering income. Rental losses are passive: they offset passive income freely, and up to $25,000/yr can offset ordinary (W-2) income if you actively participate and your MAGI is under $100k (phasing out to $0 by $150k); unused losses carry forward. On sale, claimed depreciation is recaptured at up to 25%, and gains may owe capital-gains tax (a 1031 exchange can defer both). Figures are a year-1 estimate at your 24.0% rate — not tax advice; consult a CPA.
Schools (NCES district)
- District
- Vernon Parish
- NCES district ID
- 2201830
- Math proficiency
- 35% ▼ -42.00%
- Reading proficiency
- 51% ▼ -32.00%
- Median HH income
- $44,822
- Composite
- 36.42/100
- National rank
- #4674
- State rank
- #18 of 98 in LA
Livability — Leesville
- Score
- 73/100
- State rank
- #30
- US rank
- #5046
Category grades
Schools grade is shown separately in the Schools card above.
Census & demographics
- Census place
- Leesville, LA
- County
- Vernon Parish · 21,275 people
- City population
- 21,275
- Metro
- Fort Polk South, LA
- Population (ZIP)
- 21,275
- Household income
- $55,925
- Rent vs Own
- Severe rent burden
- 659.0
Population outlook (Vernon County) Hauer SSP2
- Today (2025)
- 45,401 people
- By 2030
- 43,015 · -5.3%
- By 2040
- 38,171 · -15.9%
- By 2050
- 34,087 · -24.9%
- By 2075
- 28,267 · -37.7%
- By 2100
- 25,486 · -43.9%
Race, ethnicity, and origin ACS 2023
- Neighborhood character
- Predominantly White (72%)
- Race & ethnicity
- White 72% Black 16% Hispanic / Latino 6% Two or more races 5% Asian 2% Native American 1%
- Hispanic origin (detail)
- Mexican 3% Puerto Rican 1%
- Common ancestry
- Lithuanian 3% Slovak 1% Romanian 1%
- Foreign-born
- 3% · Canada, South Korea, Vietnam
- Languages at home
- 94% English-only · Spanish 3% French/Haitian/Cajun 1%
Political lean MEDSL · Vernon
- 2024 margin
- Solid R (+67.9) · D 15.6% · R 83.4% · Other 1.0%
- 2008→2024 swing
- -14.5pp toward R · 2008: -53.4pp · 2024: -67.9pp
- All cycles
- 2024: R+67.9 2020: R+64.9 2016: R+65.0 2012: R+57.5 2008: R+53.4
Not yet ingested
- Civics
- —
Market trends
- HPI YoY
- ▼ -61.06%
- Current HPI
- 128.8849
- Rent YoY
- ▲ 9.60%
- Metro
- Fort Polk South, LA
- State GDP YoY
- ▲ 3.29%
- F500 in state
- 10
Industry mix (Fortune 500 HQ in LA)
| Industry | F500 HQs | Revenue |
|---|---|---|
| Telecommunications | 2 | $23B |
|
||
| Utilities | 1 | $12B |
|
||
| Wholesale / Distribution | 1 | $5B |
|
||
| Advertising | 1 | $2B |
|
||
Price history
+202.6% since first listed13 events — show timeline
- 2026-04-15 Listed $115,000 GFPAR
- 2024-12-02 Sold (Public Records) $93,000 Public Records
- 2024-11-27 Sold (MLS) — GFPAR
- 2024-09-18 Price Changed $95,000 GFPAR
- 2024-09-05 Price Changed $109,000 GFPAR
- 2024-08-16 Price Changed $120,000 GFPAR
- 2024-07-16 Listed $145,000 GFPAR
- 2022-08-09 Sold (MLS) — GFPAR
- 2022-03-16 Price Changed $975 RENT.
- 2019-11-04 Sold (Public Records) $73,500 Public Records
- 2019-08-02 Listed $79,900 GFPAR
- 2009-02-25 Sold (Public Records) $38,000 Public Records
- 2007-09-12 Sold (MLS) — GFPAR
Property tax history
+9.3%/yrLatest (2025): $1,042 · +137.8% YoY. Source: county tax records.
Cash-flow waterfall
monthlySold comps — $/sqft
last 12 mo · ≤1 miLoading sold comps…