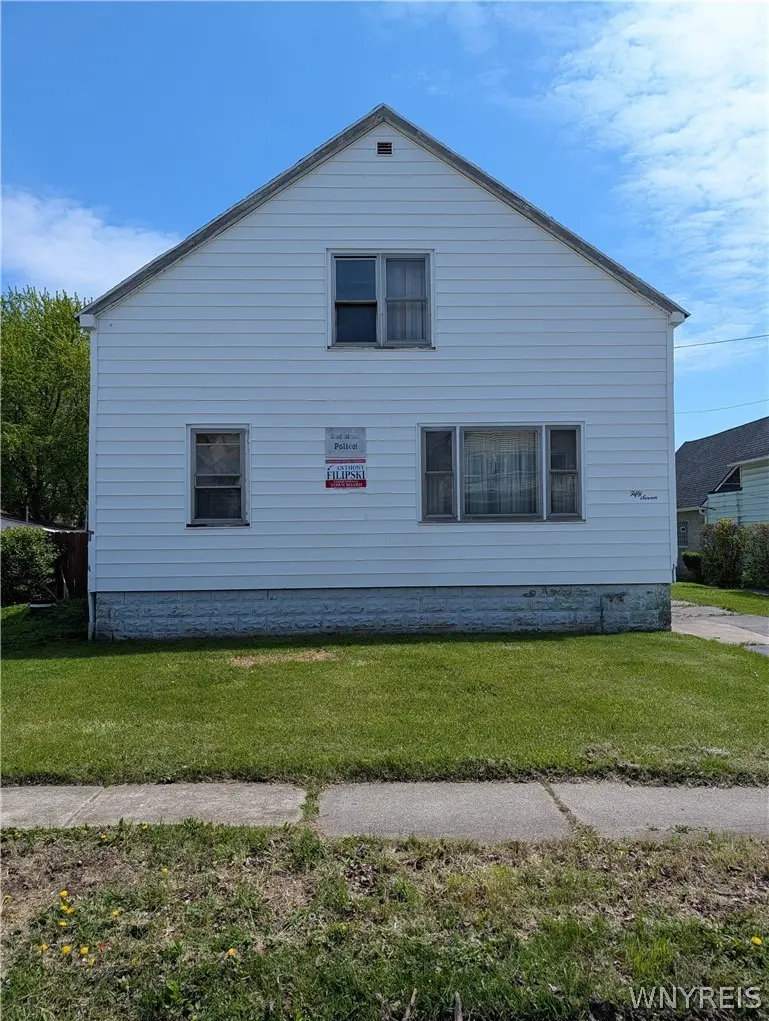
57 Barbara Pl · Cheektowaga, NY
Flood risk 1/10 · Minimal
- FEMA flood zone
- X (unshaded)
- Chance of flooding over 30 yrs
- 0.0%
- Est. flood insurance / yr
- $473 – $860
Fire risk 1/10 · Minimal
- Est. fire insurance / yr
- $691 – $1,283
Heat risk 3/10 · Minor
- Hot days now (above 93°F)
- 7 days/yr
- Hot days in 30 yrs
- 15 days/yr
Wind risk 1/10 · Minimal
- Chance of severe wind over 30 yrs
- —
Air-quality risk 3/10 · Minor
- Unhealthy air days now
- 2 days/yr
- Unhealthy air days in 30 yrs
- 3 days/yr
Risk factors via First Street. Map © Google.
Why this score? — see what drove the C grade
The composite is a weighted blend of 9 inputs, each scored 0–100. Each bar is that input's sub-score; the figure is the points it added to the 100-point composite (weight × sub-score).
- Cash flow +22.3/30.0
- 1% rule +9.0/10.0
- ARV discount +7.5/15.0
- DSCR +7.1/10.0
- Livability +4.2/5.0
- Schools +2.8/10.0
- Rent growth +2.5/5.0
- Condition / age +2.5/5.0
- Appreciation +0.0/10.0
$99,900
🖨 Deal sheet 📄 Offer letter ✓ Due diligence
Listing remarks
Attention Investors, Flippers, and DIY Enthusiasts! Bring your toolbelt and your vision to 57 Barbara Place, a diamond in the rough offering incredible equity potential in a highly convenient Cheektowaga neighborhood. This Cape Cod-style property represents the ultimate blank canvas, perfect for a complete modern rehab, a profitable fix-and-flip, or a high-yield addition to your long-term rental portfolio. The home features a classic floor plan, a flexible upper level, a full basement with great storage/workshop capacity, and a deep, fully fenced backyard. Tucked away on a quiet street just off Genesee, you are minutes from the Buffalo Niagara International Airport, the NYS Thruway (I-90),
Key facts
- Quiet street
- Near shopping
- Near local parks
Tags
Property features AI
Exterior
- Parking: No garage; Driveway; Shared driveway
- Utilities: Public water connected; Sewer connected
- Home design: Single-story home; Vinyl siding; Resale condition
- Construction: Built (existing); Block foundation
- Exterior features: Concrete driveway; Near public transit; Rectangular residential lot (approx. 48 x 60)
Interior
- Bedrooms: 2 main-level bedrooms
- Flooring: Carpet; Tile; Varies
- Bathrooms: 1 full bathroom; 1 half bathroom
- Heating & cooling: Gas forced-air heating
- Interior features: Separate/formal living room; Bedroom on main level; Full basement
- Laundry & utility: Laundry located in basement; Gas water heater
Neighborhood map
What this means for you Summary
Snapshot
- This is a 2-bed/1.5-bath single-family listed at $100k.
Deal economics
- At list price, monthly cash flow is $165 ($2k/yr) — positive.
- The deal already cash-flows at list — no discount required.
- Meets the 1% rule at list price ($1k rent vs $100k).
- Cap rate 8.3% vs local median 3.8% in Cheektowaga — top-decile yield for the area; either an underpriced asset or a hidden risk that comps aren't pricing in. Stress-test before assuming the spread holds.
Location & tenants
- Location reads 84/100 on livability (#54 in NY, #811 nationally) — a professional / high-income tenant draw. Strengths: commute A+, housing A+, health & safety A+; Watch: crime C-.
- Cheektowaga Central School District (urban): math 30% / reading 37% proficiency, ranked #564 of 590 in NY (top 96%) — families likely to look elsewhere, expect single-tenant / working-renter base with shorter leases.
- Market conditions: 207 active listings in the ZIP; 14 comparable units currently listed for rent nearby; rentals at typical pace (median 20d on market — plan ~3-4 weeks tenant-placement turnaround); 1,244 units permitted in Erie County in 2024 (563 in 5+ unit buildings).
Forward outlook
- Local home prices are declining (-3.0%/yr); year-one equity from $691 of loan paydown is wiped out by about $3k of value loss. Plan a longer hold.
Negotiation context
- Only 14 days on market — expect competitive offers; lowballing is unlikely to land.
Risks & watch-outs
- Watch-outs: property tax is 4.5% of price; built in 1940 — expect roof / HVAC / electrical / plumbing capex.
Questions for the listing agent
- Built in 1940 — when were the roof, HVAC, electrical panel, plumbing, and water heater last replaced?
- Property tax is high relative to price — has the assessment been appealed recently, and will the sale trigger a re-assessment?
- Is there a deadline driving the sale (1031 exchange, divorce, estate, relocation)? That informs how much negotiation room exists.
- Schools are B-rated — typically a magnet for longer-tenancy family renters. What's the average tenant stay here, and is there a school-zone premium baked into asking?
- What's the average days-on-market for RENTAL listings here right now (not sales)? A rising rental-DOM trend means longer vacancies and softer asking-rent achievability than the comps imply.
- What's the recent tenant-quality profile in this submarket — average credit score on applications, eviction rate, late-payment / NSF rate, and stable-employment percentage? A property-management company in the area should have these aggregated.
- How much new for-sale + rental construction is in the pipeline within 1–3 miles? Heavy new supply typically softens prices + rents 12–24 months out; constrained supply supports both.
Investment metrics
- 1% rule
- 1.40% ✓
- Cap rate
- 8.27%
- Cash-on-cash
- 7.06%
- DSCR
- 1.31
- GRM
- 6.0
CMA / ARV
- ARV (on-the-fly)
- $208,639
- Comps found
- 12
Show comp detail 12 sales within ~0.75 mi
| Address | Dist | Beds/Ba | Sqft | Sold | Price | $/sf | Match |
|---|---|---|---|---|---|---|---|
| 30 Olcott Pl | 0.22mi | 3/1.0 (+1) | 1,430 (-5%) | 8mo | $165,000 | $115 | 68 |
| 31 Alpine Pl | 0.22mi | 2/1.0 | 1,597 (+6%) | 14mo | $100,000 | $63 | 66 |
| 67 Carol Dr | 0.35mi | 3/1.0 (+1) | 1,384 (-8%) | 2mo | $225,000 | $163 | 62 |
| 54 Roma Ave | 0.32mi | 3/1.5 (+1) | 1,320 (-12%) | 1mo | $165,000 | $125 | 59 |
| 365 Pine Ridge Rd | 0.34mi | 2/1.0 | 1,374 (-8%) | 14mo | $190,365 | $139 | 57 |
| 70 Eggert Rd | 0.30mi | 3/1.0 (+1) | 1,342 (-11%) | 6mo | $215,000 | $160 | 56 |
| 4 Villa Moraine Dr | 0.36mi | 3/1.5 (+1) | 1,680 (+12%) | 4mo | $289,000 | $172 | 55 |
| 79 Courtland Ave | 0.45mi | 3/1.0 (+1) | 1,318 (-12%) | 9mo | $165,000 | $125 | 44 |
| 105 Hoerner Ave | 0.74mi | 3/1.0 (+1) | 1,367 (-9%) | 2mo | $90,000 | $66 | 42 |
| 57 Victoria Blvd | 0.51mi | 3/2.0 (+1) | 1,331 (-11%) | 13mo | $223,500 | $168 | 40 |
| 134 Park Edge Dr | 0.51mi | 3/1.5 (+1) | 1,290 (-14%) | 10mo | $253,000 | $196 | 39 |
| 372 Roslyn St | 0.67mi | 3/1.0 (+1) | 1,362 (-9%) | 14mo | $180,000 | $132 | 35 |
Match score weights: distance 35% · size 25% · config 20% · recency 20%. Top-matched comps best support the ARV.
Projected returns pro-forma
-3.0% appreciation · 3.0% rent growth · sell at horizon
- IRR
- -5.3%
- Equity multiple
- 0.80×
- Total profit
- $-5,525
- Equity at exit
- $14,895
- IRR
- 4.6%
- Equity multiple
- 1.34×
- Total profit
- $9,401
- Equity at exit
- $8,638
Cash invested: $27,972 (down + closing). Projections, not guarantees.
Landlord ↔ Tenant lean methodology
- Overall (STATE)
- 15 Strongly Tenant-Friendly
- State New York
- 15 Strongly Tenant-Friendly · D+10
- County
- — inherits STATE
- City
- — inherits STATE
ZIP-level market 14225
- Home prices YoY
- -27.3%
- Active inventory
- 207
- Price-to-rent
- 6.0×
Monthly cashflow live
- Estimated rent
- $1,397 high interval (Pro) →
- Mortgage (P&I)
- −$524
- Tax from tax record
- −$374 /mo · $4,483/yr
- Insurance
- −$42
- HOA
- −$0
- Vacancy / Maint / Mgmt
- −$293
- Net cashflow
- $165
Break-even live
UW: 25.0% down · 7.5% · 30yr · 1.5% tax · 5.0% vac · 8.0% maint · 8.0% mgmt
Financing live
Cash to close
- Down payment
- $24,975
- Closing costs
- $2,997
- Reserves months
- —
- Total cash needed
- —
Loan-product check · same deal, 3 products live
Conventional
25% down · 7.5% · 30yr
- Down + closing
- —
- Monthly P&I
- —
- Monthly cashflow
- —
- DSCR
- —
- Eligible?
- —
Personal DTI + credit; lowest rate.
DSCR
20% down · 8.5% · 30yr
- Down + closing
- —
- Monthly P&I
- —
- Monthly cashflow
- —
- DSCR
- —
- Eligible?
- —
No personal income docs; deal must DSCR.
Hard money
10% down · 12.0% · 12mo
- Down + closing
- —
- Monthly P&I
- —
- Monthly cashflow
- —
- DSCR
- —
- Eligible?
- —
Short-term bridge; refi at stabilization.
Rent comps 14 comps
| Address | Beds | Baths | Sqft | Rent | $/sqft | DOM | Units | Dist |
|---|---|---|---|---|---|---|---|---|
| 65 Domedion Ave Buffalo, NY | 3.0 | 1.0 | 1632 | $1,500 | $0.92 | 1d | 1 | 0.42mi |
| 216 Newburgh Ave Buffalo, NY | 2.0 | 1.0 | 1690 | $1,150 | $0.68 | 23d | 1 | 0.56mi |
| 110 Gerald Ave Buffalo, NY | 2.0 | 1.0 | 2098 | $1,100 | $0.52 | 23d | 1 | 0.66mi |
| 71 Gerald Ave Buffalo, NY | 2.0 | 1.0 | 1773 | $1,100 | $0.62 | 43d | 1 | 0.71mi |
| 143 Reo Ave Buffalo, NY | 3.0 | 2.0 | 1143 | $1,600 | $1.40 | 11d | 1 | 0.83mi |
| 24 Euclid Ave Buffalo, NY | 3.0 | 2.0 | 1150 | $1,700 | $1.48 | 43d | 1 | 0.90mi |
| 96 Academy Rd Buffalo, NY | 3.0 | 1.0 | 2247 | $1,400 | $0.62 | 23d | 1 | 0.94mi |
| 74 Dorris Ave Buffalo, NY | 3.0 | 1.0 | 1200 | $1,450 | $1.21 | 43d | 1 | 0.97mi |
| 1202 Walden Ave Unit 3 Buffalo, NY | 3.0 | 1.0 | 1500 | $1,400 | $0.93 | 17d | 1 | 0.99mi |
| 2935 Genesee St Unit Up Buffalo, NY | 1.0 | 1.0 | 1400 | $1,400 | $1.00 | 17d | 1 | 1.11mi |
| 2935 Genesee St Unit Up Buffalo, NY | 2.0 | 1.0 | 1400 | $1,400 | $1.00 | 10d | 1 | 1.11mi |
| 47 Awood Pl Buffalo, NY | 3.0 | 1.0 | 1840 | $1,500 | $0.82 | 1d | 1 | 1.18mi |
| 20 Mildred Dr Rm 2 Cheektowaga, NY | 1.0 | 1.0 | 1420 | $1,400 | $0.99 | 19d | 1 | 1.27mi |
| 517 Goodyear Ave Buffalo, NY | 3.0 | 1.0 | 1559 | $1,800 | $1.15 | 19d | 1 | 1.43mi |
Listing history 11 events
-
2026-06-18days on market $99,900 Active 14 DOM
-
2026-06-17days on market $99,900 Active 13 DOM
-
2026-06-16days on market $99,900 Active 12 DOM
-
2026-06-15days on market $99,900 Active 11 DOM
-
2026-06-13pricedays on market $99,900 Active 9 DOM
-
2026-06-10days on market $89,900 Active 6 DOM
-
2026-06-09days on market $89,900 Active 5 DOM
-
2026-06-08days on market $89,900 Active 4 DOM
-
2026-06-07days on market $89,900 Active 3 DOM
-
2026-06-05remarks 699-char remark
-
2026-06-05$89,900 Active 1 DOM
ⓘ Source: listings_history table (triggers on properties + properties_extension) + one-shot
backfill from property_details.listing_events for pre-trigger history.
Tax reassessment forecast NY · Partial reset (capped growth)
- Current annual tax
- $4,483 · $374/mo
- Projected year-2 tax
- $4,483 · $374/mo
- Expected delta
- $0/yr ($0/mo · 0.0%)
ⓘ Screening estimate from a state-policy table — verify with the county assessor before closing.
Climate risk First Street
- Flood 1/10 Low FEMA zone X (unshaded) · 0% chance over 30 yrs
- Wildfire 1/10 Low
- Heat 3/10 Moderate 7 d/yr ≥93°F today · 15 d/yr by 30 yrs out
- Wind 1/10 Low
- Air quality 3/10 Moderate 2 unhealthy d/yr today · 3 by 30 yrs out
Nearby sold comps map
Loading sold comps map…
Walkable amenities ~0.75 mi
Loading nearby amenities…
Taxation est. · year 1
- Rental income
- $16,766
- − Mortgage interest
- −$5,596
- − Property taxes
- −$4,483
- − Insurance
- −$500
- − Repairs & maintenance
- −$1,341
- − Management
- −$1,341
- − Depreciation
- −$2,906
- Taxable income
- $599
- Est. tax owed @ 24.0%
- −$144
- After-tax cash flow
- $1,832/yr
For passive investors: Depreciation is non-cash, so a rental often shows a tax loss while cash-flowing — sheltering income. Rental losses are passive: they offset passive income freely, and up to $25,000/yr can offset ordinary (W-2) income if you actively participate and your MAGI is under $100k (phasing out to $0 by $150k); unused losses carry forward. On sale, claimed depreciation is recaptured at up to 25%, and gains may owe capital-gains tax (a 1031 exchange can defer both). Figures are a year-1 estimate at your 24.0% rate — not tax advice; consult a CPA.
Schools (NCES district)
- District
- Cheektowaga Central School District
- NCES district ID
- 3607230
- Math proficiency
- 30% ▼ -7.00%
- Reading proficiency
- 37% ▲ 1.00%
- Median HH income
- $43,401
- Composite
- 28.45/100
- National rank
- #6753
- State rank
- #564 of 590 in NY
Livability — Cheektowaga
- Score
- 84/100
- State rank
- #54
- US rank
- #811
Category grades
Schools grade is shown separately in the Schools card above.
Census & demographics
- Census place
- Cheektowaga, NY
- County
- Erie County · 714,559 people
- City population
- 55,470
- Metro
- Buffalo-Cheektowaga, NY
- Population (ZIP)
- 33,620
- Household income
- $67,237
- Rent vs Own
- Severe rent burden
- 991.0
Population outlook (Erie County) Hauer SSP2
- Today (2025)
- 933,037 people
- By 2030
- 935,181 · +0.2%
- By 2040
- 928,531 · -0.5%
- By 2050
- 905,725 · -2.9%
- By 2075
- 834,037 · -10.6%
- By 2100
- 708,033 · -24.1%
Race, ethnicity, and origin ACS 2023
- Neighborhood character
- Predominantly White (74%)
- Race & ethnicity
- White 74% Black 13% Two or more races 7% Hispanic / Latino 4% Asian 3%
- Common ancestry
- Romanian 21% Lithuanian 3% Iranian 1%
- Foreign-born
- 6% · Canada, Vietnam
- Languages at home
- 92% English-only · Other Indo-European 2% Spanish 2% Arabic 1%
Political lean MEDSL · Erie
- 2024 margin
- Lean D (+9.7) · D 54.8% · R 45.2%
- 2008→2024 swing
- -7.9pp toward R · 2008: 17.5pp · 2024: 9.7pp
- All cycles
- 2024: D+9.7 2020: D+14.7 2016: D+4.8 2012: D+15.6 2008: D+17.5
Not yet ingested
- Civics
- —
Market trends
- HPI YoY
- ▼ -120.26%
- Current HPI
- 320.6248
- Rent YoY
- —
- Metro
- Buffalo-Cheektowaga, NY
- State GDP YoY
- ▲ 2.60%
- F500 in state
- 92
Industry mix (Fortune 500 HQ in NY)
| Industry | F500 HQs | Revenue |
|---|---|---|
| Financial Services | 10 | $950B |
|
||
| Consumer Goods | 9 | $162B |
|
||
| Insurance | 4 | $225B |
|
||
| Telecommunications | 2 | $144B |
|
||
| Pharmaceuticals | 2 | $112B |
|
||
| Media / Entertainment | 2 | $69B |
|
||
Price history
1 event — show timeline
- 2026-06-04 Listed $89,900 WNYREIS
Property tax history
+5.5%/yrLatest (2025): $4,483 · -2.2% YoY. Source: county tax records.
Cash-flow waterfall
monthlySold comps — $/sqft
last 12 mo · ≤1 miLoading sold comps…