350 SW 4th St · Krebs, OK
Flood risk 1/10 · Minimal
- FEMA flood zone
- X (unshaded)
- Chance of flooding over 30 yrs
- 0.0%
- Est. flood insurance / yr
- $507 – $1,088
Fire risk 7/10 · Major
- Est. fire insurance / yr
- $2,463 – $4,575
Heat risk 6/10 · Moderate
- Hot days now (above 111°F)
- 7 days/yr
- Hot days in 30 yrs
- 19 days/yr
Wind risk 4/10 · Minor
- Chance of severe wind over 30 yrs
- 9.0%
Air-quality risk 2/10 · Minimal
- Unhealthy air days now
- 1 days/yr
- Unhealthy air days in 30 yrs
- 2 days/yr
Risk factors via First Street. Map © Google.
Why this score? — see what drove the C grade
The composite is a weighted blend of 9 inputs, each scored 0–100. Each bar is that input's sub-score; the figure is the points it added to the 100-point composite (weight × sub-score).
- Cash flow +17.6/30.0
- ARV discount +10.5/15.0
- Appreciation +6.9/10.0
- DSCR +5.5/10.0
- 1% rule +4.7/10.0
- Livability +3.1/5.0
- Rent growth +2.5/5.0
- Condition / age +2.5/5.0
- Schools +2.2/10.0
$99,000
🖨 Deal sheet 📄 Offer letter ✓ Due diligence
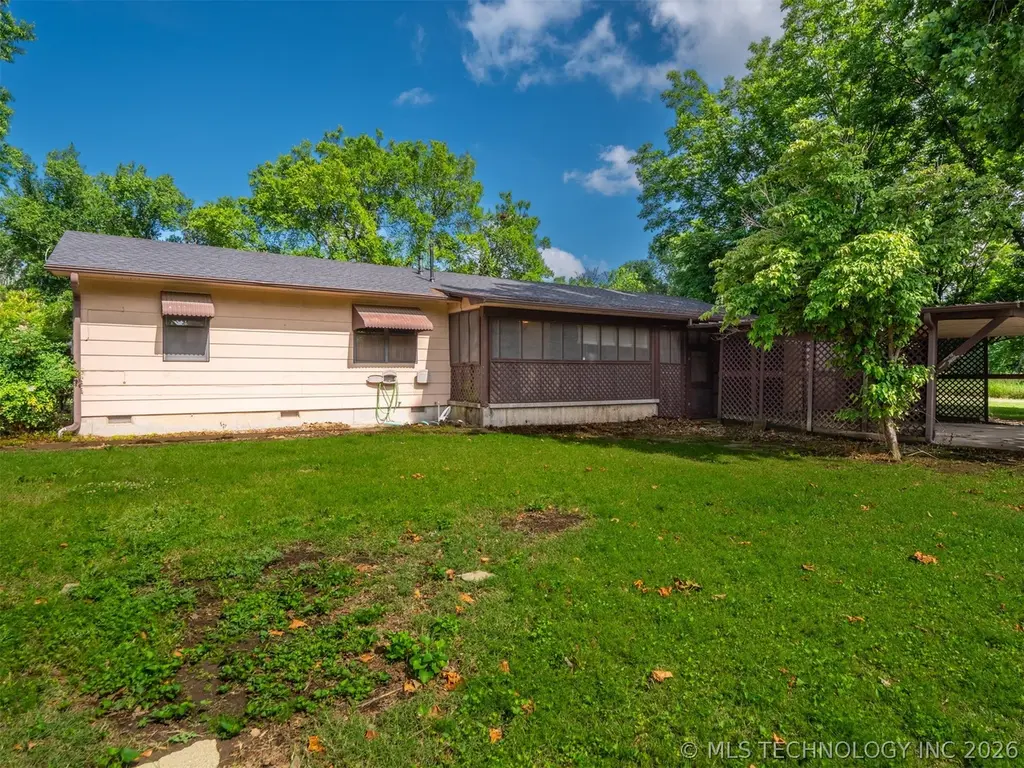
Listing remarks
This charming 3-bedroom, 3-bath home sits on a desirable corner lot and offers plenty of space and potential, making it a great starter home or investment opportunity. Featuring two separate living areas, there’s room for entertaining, relaxing, or creating a flexible space to fit your needs. Inside, you’ll find ample storage throughout the home, while outside two storage sheds provide even more space for tools, hobbies, or equipment. The property is shaded by several mature trees, adding beauty and privacy to the outdoor setting. With its versatile layout and added storage, this home is full of possibilities!
Key facts
- Two storage sheds
- Corner lot
- Ample storage
Tags
Property features AI
Finance
- HOA & community: Gutters noted as a community/feature
Exterior
- Parking: 2-car garage; Carport; Additional storage in parking area
- Security: No safety shelter
- Utilities: Electricity available; Natural gas available; Public water; Public sewer
- Home design: Single-story; Faces west; Crawlspace foundation
- Construction: Wood siding with wood frame construction; Asphalt/fiberglass roof; Built (year source: appraiser)
- Exterior features: Rain gutters; Covered, enclosed patio; Shed(s) / exterior storage; Corner lot
Interior
- Kitchen: Dishwasher; Microwave; Oven; Range; Stove
- Flooring: Carpet; Tile; Vinyl
- Bathrooms: 3 full bathrooms
- Heating & cooling: Central heating (gas); Central air conditioning
- Interior features: Aluminum-framed windows; Laminate counters; Ceiling fan(s); Electric oven connection
- Laundry & utility: Washer hookup; Gas dryer hookup; Gas water heater
Neighborhood map
What this means for you Summary
Snapshot
- This is a 3-bed/2.0-bath single-family listed at $99k.
Deal economics
- At list price, monthly cash flow is $78 ($932/yr) — positive.
- The deal already cash-flows at list — no discount required.
- To meet the 1% rule (rent ≥ 1% of price), the offer needs to be $96k (2.6% below list).
- Recommended offer: $96k (2.6% below list) — sets the bar for 1% rule.
Location & tenants
- Location reads 61/100 on livability (#294 in OK) — a middle-class / working-renter tenant base. Strengths: cost of living A+, housing A-; Watch: schools F, amenities F, commute F.
- Krebs (town): math 25% / reading 26% proficiency, ranked #99 of 270 in OK (top 37%) — low school quality limits family demand, transient renter base, plan for 1-2y turnover.
- Market conditions: 138 active listings in the ZIP; 46 units permitted in Pittsburg County in 2024 (0 in 5+ unit buildings).
Forward outlook
- In year one you build about $4k of equity ($684 loan paydown + $4k appreciation (3.8% local appreciation)).
- Pittsburg County population projected to shrink 7% by 2050 — rents likely to lag national; underwrite the cash flow, not the appreciation.
- At projected returns (3.8% appreciation + 3.0% rent growth), your $28k cash investment doubles in ~5 years — after that, you're playing with house money.
- By year 8, paydown + projected appreciation supports a ~$33k cash-out refi (75% LTV) — recoverable capital for the next deal without selling this one.
Negotiation context
- Only 6 days on market — expect competitive offers; lowballing is unlikely to land.
Risks & watch-outs
- Climate carrying-cost: major wildfire risk; extreme-heat days projected 7→19/yr by 2055 (HVAC capex compounding) — expect insurance premiums to compound above CPI over the hold.
Questions for the listing agent
- Built in 1971 — when were the roof, HVAC, electrical panel, plumbing, and water heater last replaced?
- Is there a deadline driving the sale (1031 exchange, divorce, estate, relocation)? That informs how much negotiation room exists.
- Schools are F-rated, which usually means shorter tenancies and higher turnover. Who's the typical renter profile here, and what's been the actual vacancy rate?
- What's the average days-on-market for RENTAL listings here right now (not sales)? A rising rental-DOM trend means longer vacancies and softer asking-rent achievability than the comps imply.
- What's the recent tenant-quality profile in this submarket — average credit score on applications, eviction rate, late-payment / NSF rate, and stable-employment percentage? A property-management company in the area should have these aggregated.
- How much new for-sale + rental construction is in the pipeline within 1–3 miles? Heavy new supply typically softens prices + rents 12–24 months out; constrained supply supports both.
Investment metrics
- 1% rule
- 0.97% ✗
- Cap rate
- 7.23%
- Cash-on-cash
- 3.36%
- DSCR
- 1.15
- GRM
- 8.6
CMA / ARV
- ARV (on-the-fly)
- $105,984
- Comps found
- 3
Show comp detail 3 sales within ~0.75 mi
| Address | Dist | Beds/Ba | Sqft | Sold | Price | $/sf | Match |
|---|---|---|---|---|---|---|---|
| 190 SW 2nd St | 0.17mi | 3/1.5 | 1,059 (-4%) | 4mo | $130,000 | $123 | 80 |
| 260 SE 2nd St | 0.45mi | 2/1.0 (-1) | 1,098 (-0%) | 16mo | $37,850 | $34 | 56 |
| 102 NW 8th St | 0.50mi | 2/1.0 (-1) | 960 (-13%) | 24mo | $92,500 | $96 | 26 |
Match score weights: distance 35% · size 25% · config 20% · recency 20%. Top-matched comps best support the ARV.
Projected returns pro-forma
3.83% appreciation · 3.0% rent growth · sell at horizon
- IRR
- 12.8%
- Equity multiple
- 1.77×
- Total profit
- $21,303
- Equity at exit
- $49,214
- IRR
- 14.3%
- Equity multiple
- 3.30×
- Total profit
- $63,668
- Equity at exit
- $79,721
Cash invested: $27,720 (down + closing). Projections, not guarantees.
Landlord ↔ Tenant lean methodology
- Overall (STATE)
- 83 Strongly Landlord-Friendly
- State Oklahoma
- 83 Strongly Landlord-Friendly · R+20
- County
- — inherits STATE
- City
- — inherits STATE
ZIP-level market 74462
- Home prices YoY
- 1.9%
- Active inventory
- 138
- Price-to-rent
- 8.6×
Monthly cashflow live
- Estimated rent
- $964 medium interval (Pro) →
- Mortgage (P&I)
- −$519
- Tax est. 1.5%
- −$124 /mo · $1,485/yr
- Insurance
- −$41
- HOA
- −$0
- Vacancy / Maint / Mgmt
- −$203
- Net cashflow
- $78
Break-even live
UW: 25.0% down · 7.5% · 30yr · 1.5% tax · 5.0% vac · 8.0% maint · 8.0% mgmt
Financing live
Cash to close
- Down payment
- $24,750
- Closing costs
- $2,970
- Reserves months
- —
- Total cash needed
- —
Loan-product check · same deal, 3 products live
Conventional
25% down · 7.5% · 30yr
- Down + closing
- —
- Monthly P&I
- —
- Monthly cashflow
- —
- DSCR
- —
- Eligible?
- —
Personal DTI + credit; lowest rate.
DSCR
20% down · 8.5% · 30yr
- Down + closing
- —
- Monthly P&I
- —
- Monthly cashflow
- —
- DSCR
- —
- Eligible?
- —
No personal income docs; deal must DSCR.
Hard money
10% down · 12.0% · 12mo
- Down + closing
- —
- Monthly P&I
- —
- Monthly cashflow
- —
- DSCR
- —
- Eligible?
- —
Short-term bridge; refi at stabilization.
Listing history 4 events
-
2026-06-02status $99,000 Pending 6 DOM
-
2026-06-01days on market $99,000 Active 6 DOM
-
2026-05-31days on market $99,000 Active 5 DOM
-
2026-05-26$99,000 Active
ⓘ Source: listings_history table (triggers on properties + properties_extension) + one-shot
backfill from property_details.listing_events for pre-trigger history.
Climate risk First Street
- Flood 1/10 Low FEMA zone X (unshaded) · 0% chance over 30 yrs
- Wildfire 7/10 Severe
- Heat 6/10 Major 7 d/yr ≥111°F today · 19 d/yr by 30 yrs out
- Wind 4/10 Moderate 9% chance of damaging wind over 30 yrs
- Air quality 2/10 Low 1 unhealthy d/yr today · 2 by 30 yrs out
Nearby sold comps map
Loading sold comps map…
Walkable amenities ~0.75 mi
Loading nearby amenities…
Taxation est. · year 1
- Rental income
- $11,572
- − Mortgage interest
- −$5,546
- − Property taxes
- −$1,485
- − Insurance
- −$495
- − Repairs & maintenance
- −$926
- − Management
- −$926
- − Depreciation
- −$2,880
- Taxable loss
- −$685
- Est. tax savings @ 24.0%
- +$164
- After-tax cash flow
- $1,096/yr
For passive investors: Depreciation is non-cash, so a rental often shows a tax loss while cash-flowing — sheltering income. Rental losses are passive: they offset passive income freely, and up to $25,000/yr can offset ordinary (W-2) income if you actively participate and your MAGI is under $100k (phasing out to $0 by $150k); unused losses carry forward. On sale, claimed depreciation is recaptured at up to 25%, and gains may owe capital-gains tax (a 1031 exchange can defer both). Figures are a year-1 estimate at your 24.0% rate — not tax advice; consult a CPA.
Schools (NCES district)
- District
- Krebs
- NCES district ID
- 4016720
- Math proficiency
- 25% ▼ -6.00%
- Reading proficiency
- 26% ▼ -6.00%
- Median HH income
- $46,002
- Composite
- 22.09/100
- National rank
- #8185
- State rank
- #99 of 270 in OK
Livability — Krebs
- Score
- 61/100
- State rank
- #294
- US rank
- #17457
Category grades
Schools grade is shown separately in the Schools card above.
Census & demographics
- Census place
- Krebs, OK
- City population
- 1,822
- Population (ZIP)
- 7,096
Population outlook (Pittsburg County) Hauer SSP2
- Today (2025)
- 42,795 people
- By 2030
- 41,901 · -2.1%
- By 2040
- 40,680 · -4.9%
- By 2050
- 39,952 · -6.6%
- By 2075
- 38,858 · -9.2%
- By 2100
- 36,031 · -15.8%
Race, ethnicity, and origin ACS 2023
- Neighborhood character
- Predominantly White (70%)
- Race & ethnicity
- White 70% Native American 13% Two or more races 13% Hispanic / Latino 6%
- Hispanic origin (detail)
- Mexican 6%
- Common ancestry
- Scotch-Irish 1% Slovak 1% Italian 1%
- Foreign-born
- 3% · Canada
- Languages at home
- 95% English-only · Spanish 4% Russian/Polish/Slavic 1%
Political lean MEDSL · Pittsburg
- 2024 margin
- Solid R (+59.0) · D 19.8% · R 78.8% · Other 1.5%
- 2008→2024 swing
- -22.4pp toward R · 2008: -36.6pp · 2024: -59.0pp
- All cycles
- 2024: R+59.0 2020: R+56.3 2016: R+52.4 2012: R+38.3 2008: R+36.6
Not yet ingested
- Civics
- —
Market trends
- HPI YoY
- ▲ 3.83%
- Current HPI
- 201.74
- Rent YoY
- —
- Metro
- —
- State GDP YoY
- ▲ 1.55%
- F500 in state
- 6
Industry mix (Fortune 500 HQ in OK)
| Industry | F500 HQs | Revenue |
|---|---|---|
| Energy | 3 | $48B |
|
||
Price history
1 event — show timeline
- 2026-05-26 Listed $99,000 MLS Technology, Inc.
Property tax history
-0.6%/yrLatest (2025): $178 · +4.7% YoY. Source: county tax records.
Cash-flow waterfall
monthlySold comps — $/sqft
last 12 mo · ≤1 miLoading sold comps…