3634 Harper St · Clinton, WA
Flood risk 1/10 · Minimal
- FEMA flood zone
- X (unshaded)
- Chance of flooding over 30 yrs
- 0.0%
- Est. flood insurance / yr
- $473 – $860
Fire risk 3/10 · Minor
- Est. fire insurance / yr
- $604 – $1,122
Heat risk 2/10 · Minimal
- Hot days now (above 85°F)
- 8 days/yr
- Hot days in 30 yrs
- 18 days/yr
Wind risk 1/10 · Minimal
- Chance of severe wind over 30 yrs
- —
Air-quality risk 6/10 · Moderate
- Unhealthy air days now
- 8 days/yr
- Unhealthy air days in 30 yrs
- 9 days/yr
Risk factors via First Street. Map © Google.
Why this score? — see what drove the D grade
The composite is a weighted blend of 9 inputs, each scored 0–100. Each bar is that input's sub-score; the figure is the points it added to the 100-point composite (weight × sub-score).
- ARV discount +13.8/15.0
- Cash flow +9.8/30.0
- Schools +5.0/10.0
- Livability +2.9/5.0
- DSCR +2.8/10.0
- Rent growth +2.5/5.0
- Condition / age +2.5/5.0
- 1% rule +2.3/10.0
- Appreciation +0.0/10.0
$409,500
🖨 Deal sheet (PDF) 📄 Offer letter ✓ Due diligence
Listing remarks
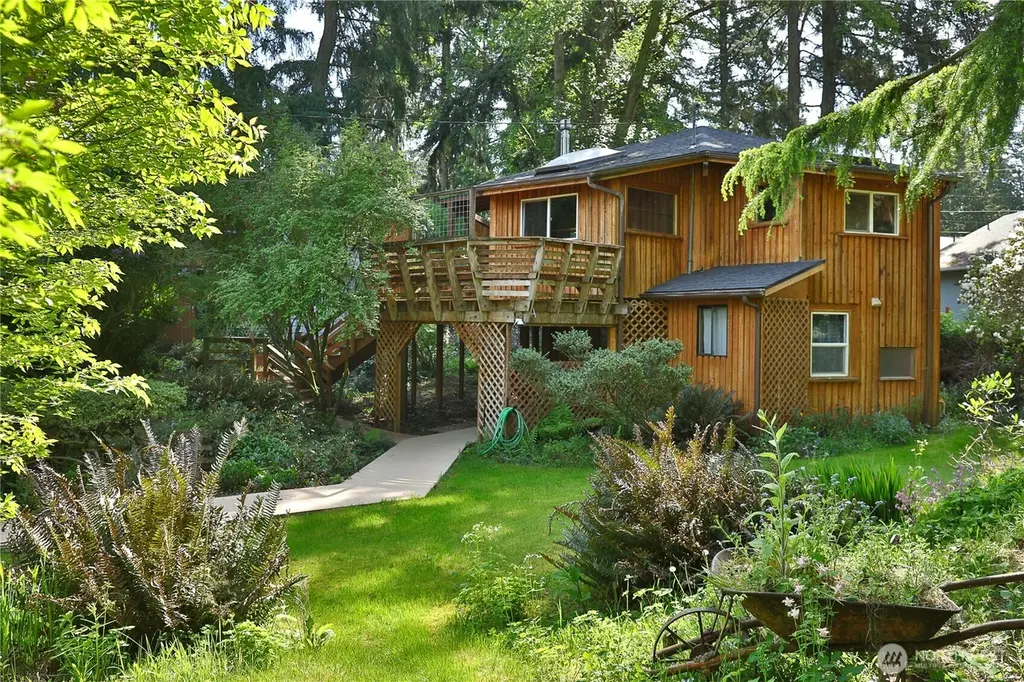
Opportunity awaits at 3634 Harper Street! Located in the desirable Scatchet Head community, this distinctive hexagon-style home offers character, flexibility, and potential throughout its 1,520 square feet. Inside you’ll find 2 bedrooms, 2 bathrooms, plus a bonus room ideal for an office, den, or creative space. Enter from the wraparound deck to the main level featuring hardwood floors and a cozy freestanding propane fireplace. The main-floor bedroom includes a lofted area that takes advantage of the soaring ceilings, creating extra space for sleeping, storage, or play. Downstairs offers an additional bedroom, full bathroom, laundry area, and generous storage spaces, including a large
Key facts
- Lofted area
- Wraparound deck
- Generator hookup
Tags
Property features AI
Finance
- Financial info: Listing terms: Cash or Conventional
- HOA & community: Homeowners association with annual fee ($563) covering common area and road maintenance (see remarks); Community pool
Exterior
- Parking: Off-street parking
- Utilities: Electric and propane energy sources; Community water and shared well; Septic tank; Puget Sound Energy power
- Home design: Single-family residence; Two-story; Has view; Built on lot
- Construction: Wood construction; Composition roof; Poured concrete foundation; House structure
- Exterior features: Wood exterior; Deck; Patio; Outbuildings; Garden space; Community waterfront / private beach access; Level to partially sloped topography; Dead-end street, paved
Interior
- Kitchen: Dishwasher; Microwave; Refrigerator; Stove/Range
- Bedrooms: 2 bedrooms total (1 on main level, 1 on lower level)
- Flooring: Hardwood; Laminate
- Bathrooms: 1 full bath; 1 three-quarter bath; 1 bathtub; 2 showers
- Heating & cooling: Stove / free-standing heating; No central air
- Interior features: Fireplace (gas)
- Laundry & utility: Washer; Dryer
Neighborhood map
What this means for you Summary
Snapshot
- This is a 3-bed/2.0-bath single-family listed at $410k.
Deal economics
- At list price, monthly cash flow is $-259 ($-3k/yr) — negative.
- To cash-flow at today's rent, offer at most $364k (11.2% below list).
- To meet the 1% rule (rent ≥ 1% of price), the offer needs to be $300k (26.7% below list).
- Recommended offer: $300k (26.7% below list) — sets the bar for 1% rule.
- Cap rate 5.5% vs local median 1.7% in Clinton — top-decile yield for the area; either an underpriced asset or a hidden risk that comps aren't pricing in. Stress-test before assuming the spread holds.
Location & tenants
- Location reads 58/100 on livability (#500 in WA) — a working-class tenant base; expect higher turnover. Strengths: crime A+, employment B+, housing B; Watch: amenities F, commute F, cost of living F.
- South Whidbey School District (rural): math 47% / reading 64% proficiency, ranked #87 of 291 in WA (top 30%) — acceptable for families but not a draw, mixed tenant base, ~2y average lease.
- Zoned schools: South Whidbey Elementary (571 students, 35% FRL); South Whidbey Middle (204 students, 41% FRL); South Whidbey High School (384 students, 30% FRL).
- Market conditions: 78 active listings in the ZIP; 1 comparable units currently listed for rent nearby; 402 units permitted in Island County in 2024 (54 in 5+ unit buildings).
Forward outlook
- Local home prices are declining (-3.0%/yr); year-one equity from $3k of loan paydown is wiped out by about $12k of value loss. Plan a longer hold.
- Island County population projected to shrink 6% by 2050 — rents likely to lag national; underwrite the cash flow, not the appreciation.
Negotiation context
- It's been on market 40 days — a 3% lower offer ($397k) is reasonable based on typical stale-listing flexibility.
Questions for the listing agent
- What do current leases actually rent for vs. the listed asking? Can we see a recent rent roll and the last 12 months of T-12 income?
- It's been on market 40 days. Have you received any prior offers? Is the seller open to a 27% concession, seller financing, or rate buy-down credit?
- Built in 1977 — when were the roof, HVAC, electrical panel, plumbing, and water heater last replaced?
- What does the HOA fee cover, when was the last increase, and are there any pending special assessments or reserve-fund shortfalls?
- Is there a deadline driving the sale (1031 exchange, divorce, estate, relocation)? That informs how much negotiation room exists.
- The area grade is low — what's the realistic commute time and amenity access for the typical tenant pool here? Any planned neighborhood developments (good or bad) we should know about?
- What's the average days-on-market for RENTAL listings here right now (not sales)? A rising rental-DOM trend means longer vacancies and softer asking-rent achievability than the comps imply.
- What's the recent tenant-quality profile in this submarket — average credit score on applications, eviction rate, late-payment / NSF rate, and stable-employment percentage? A property-management company in the area should have these aggregated.
- How much new for-sale + rental construction is in the pipeline within 1–3 miles? Heavy new supply typically softens prices + rents 12–24 months out; constrained supply supports both.
Investment metrics
- 1% rule
- 0.73% ✗
- Cap rate
- 5.53%
- Cash-on-cash
- -2.71%
- DSCR
- 0.88
- GRM
- 11.4
CMA / ARV
- ARV (median comp)
- $476,493
- List price
- $409,500
- Delta
- -14.06%
- Verdict
- UNDERPRICED
- Comps
- 20 within 1.0 mi
Show comp detail 12 sales within ~0.75 mi
| Address | Dist | Beds/Ba | Sqft | Sold | Price | $/sf | Match |
|---|---|---|---|---|---|---|---|
| 3681 Harper St | 0.12mi | 2/2.0 (-1) | 1,557 (+2%) | 9mo | $595,000 | $382 | 78 |
| 3635 Gamble St | 0.19mi | 3/1.5 | 1,483 (-2%) | 12mo | $470,000 | $317 | 75 |
| 7917 Decatur Ave | 0.16mi | 2/2.5 (-1) | 1,466 (-4%) | 8mo | $489,000 | $334 | 73 |
| 7882 Blakely Ave | 0.16mi | 3/2.0 | 1,323 (-13%) | 1mo | $485,000 | $367 | 70 |
| 7884 Guemes Ave | 0.16mi | 2/2.0 (-1) | 1,642 (+8%) | 7mo | $460,000 | $280 | 69 |
| 7913 San Juan Ave | 0.09mi | 2/2.0 (-1) | 1,400 (-8%) | 14mo | $470,000 | $336 | 66 |
| 7840 Blakely Ave | 0.27mi | 2/2.0 (-1) | 1,560 (+3%) | 16mo | $650,000 | $417 | 65 |
| 7806 Blakely Ave | 0.34mi | 3/2.5 | 1,621 (+7%) | 9mo | $469,000 | $289 | 64 |
| 3636 Gamble St | 0.16mi | 2/2.5 (-1) | 1,648 (+8%) | 11mo | $540,000 | $328 | 63 |
| 3644 Fidalgo Dr | 0.59mi | 3/2.0 | 1,617 (+6%) | 8mo | $780,000 | $482 | 55 |
| 3819 Driftwood Dr | 0.61mi | 2/2.0 (-1) | 1,613 (+6%) | 8mo | $610,000 | $378 | 50 |
| 8114 Pebble Ct | 0.55mi | 2/2.0 (-1) | 1,306 (-14%) | 21mo | $488,000 | $374 | 28 |
Match score weights: distance 35% · size 25% · config 20% · recency 20%. Top-matched comps best support the ARV.
Projected returns pro-forma
-3.0% appreciation · 3.0% rent growth · sell at horizon
- IRR
- -20.8%
- Equity multiple
- 0.28×
- Total profit
- $-82,945
- Equity at exit
- $61,058
- IRR
- -14.2%
- Equity multiple
- 0.18×
- Total profit
- $-93,804
- Equity at exit
- $35,406
Cash invested: $114,660 (down + closing). Projections, not guarantees.
Landlord ↔ Tenant lean methodology
- Overall (STATE)
- 28 Tenant-Leaning
- State Washington
- 28 Tenant-Leaning · D+8
- County
- — inherits STATE
- City
- — inherits STATE
ZIP-level market 98236
- Active inventory
- 78
- Price-to-rent
- 11.4×
Monthly cashflow live
- Estimated rent
- $3,000 medium interval (Pro) →
- Mortgage (P&I)
- −$2,147
- Tax from tax record
- −$264 /mo · $3,170/yr
- Insurance
- −$171
- HOA
- −$47
- Vacancy / Maint / Mgmt
- −$630
- Net cashflow
- $-259
Break-even live
Sensitivity live
| Price | -10% $-27 | -5% $-143 | +0% $-259 | +5% $-375 | +10% $-491 |
|---|---|---|---|---|---|
| Rent | -10% $-496 | -5% $-378 | +0% $-259 | +5% $-141 | +10% $-22 |
| Rate | -1.0pp $-53 | -0.5pp $-155 | base $-259 | +0.5pp $-365 | +1.0pp $-473 |
UW: 25.0% down · 7.5% · 30yr · 1.5% tax · 5.0% vac · 8.0% maint · 8.0% mgmt
Financing live
Cash to close
- Down payment
- $102,375
- Closing costs
- $12,285
- Reserves months
- —
- Total cash needed
- —
Loan-product check · same deal, 3 products live
Conventional
25% down · 7.5% · 30yr
- Down + closing
- —
- Monthly P&I
- —
- Monthly cashflow
- —
- DSCR
- —
- Eligible?
- —
Personal DTI + credit; lowest rate.
DSCR
20% down · 8.5% · 30yr
- Down + closing
- —
- Monthly P&I
- —
- Monthly cashflow
- —
- DSCR
- —
- Eligible?
- —
No personal income docs; deal must DSCR.
Hard money
10% down · 12.0% · 12mo
- Down + closing
- —
- Monthly P&I
- —
- Monthly cashflow
- —
- DSCR
- —
- Eligible?
- —
Short-term bridge; refi at stabilization.
Rent comps 1 comps
| Address | Beds | Baths | Sqft | Rent | $/sqft | DOM | Units | Dist |
|---|---|---|---|---|---|---|---|---|
| 3656 Gamble St Clinton, WA | 2.0 | 2.0 | 1934 | $3,000 | $1.55 | 45d | 1 | 0.23mi |
HOA detail
- Monthly dues
- $47 · $564/yr
Listing history 18 events
-
2026-06-22days on market $409,500 Active 40 DOM
-
2026-06-19days on market $409,500 Active 38 DOM
-
2026-06-18days on market $409,500 Active 37 DOM
-
2026-06-17days on market $409,500 Active 36 DOM
-
2026-06-16days on market $409,500 Active 35 DOM
-
2026-06-15days on market $409,500 Active 34 DOM
-
2026-06-14days on market $409,500 Active 32 DOM
-
2026-06-13pricedays on market $409,500 Active 31 DOM
-
2026-06-10days on market $420,000 Active 29 DOM
-
2026-06-09days on market $420,000 Active 28 DOM
-
2026-06-08days on market $420,000 Active 27 DOM
-
2026-06-07days on market $420,000 Active 26 DOM
-
2026-06-05days on market $420,000 Active 23 DOM
-
2026-06-02days on market $420,000 Active 21 DOM
-
2026-06-01days on market $420,000 Active 20 DOM
-
2026-05-31days on market $420,000 Active 19 DOM
-
2026-05-30days on market $420,000 Active 18 DOM
-
2026-05-12$420,000 Active
ⓘ Source: listings_history table (triggers on properties + properties_extension) + one-shot
backfill from property_details.listing_events for pre-trigger history.
Tax reassessment forecast WA · Resets to sale price
- Current annual tax
- $3,170 · $264/mo
- Projected year-2 tax
- $4,013 · $334/mo
- Expected delta
- +$843/yr (+$70/mo · 26.6%)
ⓘ Screening estimate from a state-policy table — verify with the county assessor before closing.
Climate risk First Street
- Flood 1/10 Low FEMA zone X (unshaded) · 0% chance over 30 yrs
- Wildfire 3/10 Moderate
- Heat 2/10 Low 8 d/yr ≥85°F today · 18 d/yr by 30 yrs out
- Wind 1/10 Low
- Air quality 6/10 Major 8 unhealthy d/yr today · 9 by 30 yrs out
Nearby sold comps map
Loading sold comps map…
Walkable amenities ~0.75 mi
Loading nearby amenities…
Taxation est. · year 1
- Rental income
- $36,000
- − Mortgage interest
- −$22,938
- − Property taxes
- −$3,170
- − Insurance
- −$2,048
- − Repairs & maintenance
- −$2,880
- − Management
- −$2,880
- − HOA
- −$564
- − Depreciation
- −$11,913
- Taxable loss
- −$10,392
- Est. tax savings @ 24.0%
- +$2,494
- After-tax cash flow
- $-617/yr
For passive investors: Depreciation is non-cash, so a rental often shows a tax loss while cash-flowing — sheltering income. Rental losses are passive: they offset passive income freely, and up to $25,000/yr can offset ordinary (W-2) income if you actively participate and your MAGI is under $100k (phasing out to $0 by $150k); unused losses carry forward. On sale, claimed depreciation is recaptured at up to 25%, and gains may owe capital-gains tax (a 1031 exchange can defer both). Figures are a year-1 estimate at your 24.0% rate — not tax advice; consult a CPA.
Schools (NCES district)
- District
- South Whidbey School District
- NCES district ID
- 5308190
- Math proficiency
- 47% ▲ 2.00%
- Reading proficiency
- 64% ▲ 4.00%
- Median HH income
- $62,601
- Composite
- 50.31/100
- National rank
- #4050
- State rank
- #87 of 291 in WA
Livability — Clinton
- Score
- 58/100
- State rank
- #500
- US rank
- #20708
Category grades
Schools grade is shown separately in the Schools card above.
Census & demographics
- Population (ZIP)
- 7,052
Population outlook (Island County) Hauer SSP2
- Today (2025)
- 82,019 people
- By 2030
- 81,329 · -0.8%
- By 2040
- 78,552 · -4.2%
- By 2050
- 77,042 · -6.1%
- By 2075
- 80,799 · -1.5%
- By 2100
- 84,451 · +3.0%
Race, ethnicity, and origin ACS 2023
- Neighborhood character
- Predominantly White (86%)
- Race & ethnicity
- White 86% Two or more races 8% Hispanic / Latino 6% Asian 2% Black 1%
- Hispanic origin (detail)
- Mexican 4%
- Common ancestry
- Lithuanian 5% Portuguese 5% Slovak 4%
- Foreign-born
- 5% · Canada, China
- Languages at home
- 96% English-only · Spanish 3% Russian/Polish/Slavic 1% Chinese 1%
Political lean MEDSL · Island
- 2024 margin
- D (+16.6) · D 56.8% · R 40.3% · Other 2.9%
- 2008→2024 swing
- +10.3pp toward D · 2008: 6.2pp · 2024: 16.6pp
- All cycles
- 2024: D+16.6 2020: D+12.0 2016: D+5.9 2012: D+4.4 2008: D+6.2
Not yet ingested
- Civics
- —
Market trends
- HPI YoY
- ▼ -324.14%
- Current HPI
- 209.7494
- Rent YoY
- —
- Metro
- —
- State GDP YoY
- ▲ 4.65%
- F500 in state
- 22
Industry mix (Fortune 500 HQ in WA)
| Industry | F500 HQs | Revenue |
|---|---|---|
| Retail | 2 | $269B |
|
||
| Technology / Retail | 1 | $638B |
|
||
| Technology | 1 | $245B |
|
||
| Telecommunications | 1 | $38B |
|
||
| Food / Beverage | 1 | $36B |
|
||
| Automotive / Trucks | 1 | $34B |
|
||
Price history
-2.5% since first listed2 events — show timeline
- 2026-06-11 Price Changed $409,500 NWMLS as Distributed by MLS Grid
- 2026-05-12 Listed $420,000 NWMLS as Distributed by MLS Grid
Property tax history
+4.8%/yrLatest (2026): $3,170 · +12.3% YoY. Source: county tax records.
Cash-flow waterfall
monthlySold comps — $/sqft
last 12 mo · ≤1 miLoading sold comps…