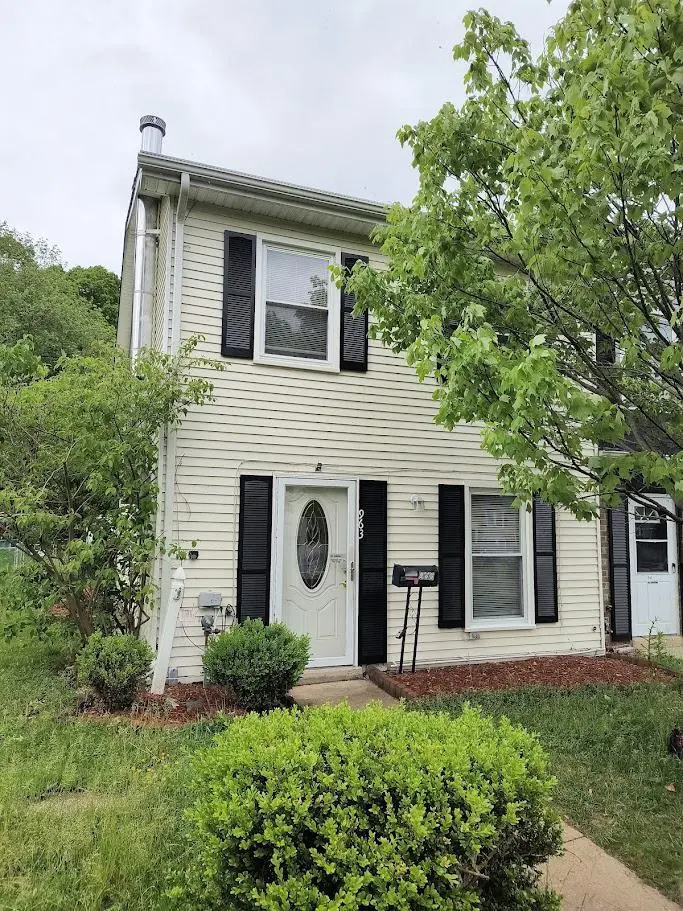
963 Top View Dr · Edgewood, MD
Flood risk 1/10 · Minimal
- FEMA flood zone
- X (unshaded)
- Chance of flooding over 30 yrs
- 0.0%
- Est. flood insurance / yr
- $507 – $1,088
Fire risk 1/10 · Minimal
- Est. fire insurance / yr
- $755 – $1,403
Heat risk 7/10 · Major
- Hot days now (above 104°F)
- 7 days/yr
- Hot days in 30 yrs
- 15 days/yr
Wind risk 6/10 · Moderate
- Chance of severe wind over 30 yrs
- 27.0%
Air-quality risk 4/10 · Minor
- Unhealthy air days now
- 4 days/yr
- Unhealthy air days in 30 yrs
- 6 days/yr
Risk factors via First Street. Map © Google.
Why this score? — see what drove the C grade
The composite is a weighted blend of 9 inputs, each scored 0–100. Each bar is that input's sub-score; the figure is the points it added to the 100-point composite (weight × sub-score).
- Cash flow +20.3/30.0
- ARV discount +12.5/15.0
- DSCR +6.5/10.0
- 1% rule +4.3/10.0
- Rent growth +3.7/5.0
- Livability +3.7/5.0
- Schools +2.9/10.0
- Condition / age +2.5/5.0
- Appreciation +0.0/10.0
$194,000
🖨 Deal sheet 📄 Offer letter ✓ Due diligence
Listing remarks MLS
Come and get it! End unit town home in good condition, Wood floors, newer roof, gutters and water heater. Fenced rear yard with two storage sheds included. Needs cosmetic updates but otherwise move in ready. Priced to sell!
Key facts
- New vanity
- Spacious backyard
- Private driveway
Tags
Property features AI
Exterior
- Parking: Asphalt driveway; Driveway parking for 2 cars; Total of 2 garage/parking spaces
- Utilities: Public water; Public sewer
- Home design: Fee simple ownership; Estimated year built
- Construction: Aluminum siding; Slab foundation
- Exterior features: End of row townhouse; No basement; Above-grade living space
Interior
- Bedrooms: Three bedrooms on the upper level
- Bathrooms: One full bathroom (upper level); One half bathroom (main level)
- Heating & cooling: 90% forced air heating; Central air conditioning
- Interior features: Dining area; Traditional floor plan
- Laundry & utility: Washer and dryer in unit
Neighborhood map
What this means for you Summary
Snapshot
- This is a 3-bed/1.5-bath townhouse listed at $194k.
Deal economics
- At list price, monthly cash flow is $249 ($3k/yr) — positive.
- The deal already cash-flows at list — no discount required.
- To meet the 1% rule (rent ≥ 1% of price), the offer needs to be $181k (6.6% below list).
- Recommended offer: $181k (6.6% below list) — sets the bar for 1% rule.
- Cap rate 7.8% vs local median 5.5% in Edgewood — top-decile yield for the area; either an underpriced asset or a hidden risk that comps aren't pricing in. Stress-test before assuming the spread holds.
Location & tenants
- Location reads 73/100 on livability (#118 in MD, #4,991 nationally) — a middle-class / working-renter tenant base. Strengths: commute A+, housing A+, health & safety A+; Watch: schools D, amenities D, crime F.
- Harford County Public Schools (suburban): math 22% / reading 39% proficiency, ranked #9 of 24 in MD (top 38%) — families likely to look elsewhere, expect single-tenant / working-renter base with shorter leases.
- Market conditions: Rents rising fast (+4.9%/yr); 94 active listings in the ZIP; 16 comparable units currently listed for rent nearby; rentals at typical pace (median 22d on market — plan ~3-4 weeks tenant-placement turnaround); solid renter incomes; 803 units permitted in Harford County in 2024 (26 in 5+ unit buildings).
Forward outlook
- Local home prices are declining (-3.0%/yr); year-one equity from $1k of loan paydown is wiped out by about $6k of value loss. Plan a longer hold.
Negotiation context
- It's been on market 23 days — a 2% lower offer ($191k) is reasonable based on typical stale-listing flexibility.
- 7 sale attempts since 29y ago with the ask held roughly flat each time — persistent listings suggest the price (not the market) is what's stuck; bring a comps-based counter.
- Current owner paid $76k; list at $194k implies a 155% gain — meaningful room to come down on a strong offer.
Risks & watch-outs
- Climate carrying-cost: major wind risk, 27% chance of damaging wind over 30y; extreme-heat days projected 7→15/yr by 2055 (HVAC capex compounding) — expect insurance premiums to compound above CPI over the hold.
Questions for the listing agent
- Built in 1973 — when were the roof, HVAC, electrical panel, plumbing, and water heater last replaced?
- Is there a deadline driving the sale (1031 exchange, divorce, estate, relocation)? That informs how much negotiation room exists.
- Schools are D-rated, which usually means shorter tenancies and higher turnover. Who's the typical renter profile here, and what's been the actual vacancy rate?
- Crime grade is F in this area — have there been break-ins, vandalism, or insurance claims at this property in the last 3 years? What carrier currently insures it and at what premium?
- What's the average days-on-market for RENTAL listings here right now (not sales)? A rising rental-DOM trend means longer vacancies and softer asking-rent achievability than the comps imply.
- What's the recent tenant-quality profile in this submarket — average credit score on applications, eviction rate, late-payment / NSF rate, and stable-employment percentage? A property-management company in the area should have these aggregated.
- How much new for-sale + rental construction is in the pipeline within 1–3 miles? Heavy new supply typically softens prices + rents 12–24 months out; constrained supply supports both.
Investment metrics
- 1% rule
- 0.93% ✗
- Cap rate
- 7.84%
- Cash-on-cash
- 5.51%
- DSCR
- 1.25
- GRM
- 8.9
CMA / ARV
- ARV (on-the-fly)
- $217,980
- Comps found
- 12
Show comp detail 12 sales within ~0.75 mi
| Address | Dist | Beds/Ba | Sqft | Sold | Price | $/sf | Match |
|---|---|---|---|---|---|---|---|
| 982 Topview Dr | 0.04mi | 3/1.5 | 1,278 (+1%) | 3mo | $205,000 | $160 | 93 |
| 1860 Eloise Ln | 0.24mi | 3/1.5 | 1,240 (-2%) | 0mo | $185,000 | $149 | 86 |
| 1415 St Christopher Ct | 0.40mi | 3/1.5 | 1,224 (-3%) | 1mo | $230,000 | $188 | 76 |
| 1513 Saint Christopher Ct | 0.37mi | 3/1.5 | 1,224 (-3%) | 6mo | $237,000 | $194 | 73 |
| 1875 Brookside Dr | 0.34mi | 4/1.5 (+1) | 1,240 (-2%) | 5mo | $214,900 | $173 | 72 |
| 1421 Saint Michael Ct | 0.43mi | 3/2.0 | 1,224 (-3%) | 2mo | $250,000 | $204 | 71 |
| 1770 Judy Way | 0.27mi | 4/1.5 (+1) | 1,360 (+8%) | 2mo | $215,000 | $158 | 67 |
| 620 Yorkshire Dr | 0.54mi | 3/3.0 | 1,240 (-2%) | 4mo | $240,000 | $194 | 63 |
| 803 Angel Valley Ct | 0.49mi | 2/2.0 (-1) | 1,325 (+5%) | 0mo | $223,000 | $168 | 61 |
| 844 Angel Valley Ct | 0.52mi | 3/1.5 | 1,120 (-11%) | 3mo | $240,000 | $214 | 55 |
| 1407 Harford Square Dr | 0.60mi | 3/1.5 | 1,386 (+10%) | 1mo | $224,000 | $162 | 54 |
| 815 W Spring Meadow Ct W | 0.39mi | 2/2.5 (-1) | 1,110 (-12%) | 7mo | $190,000 | $171 | 47 |
Match score weights: distance 35% · size 25% · config 20% · recency 20%. Top-matched comps best support the ARV.
Projected returns pro-forma
-3.0% appreciation · 4.92% rent growth · sell at horizon
- IRR
- -5.9%
- Equity multiple
- 0.78×
- Total profit
- $-12,059
- Equity at exit
- $28,926
- IRR
- 5.7%
- Equity multiple
- 1.46×
- Total profit
- $24,886
- Equity at exit
- $16,774
Cash invested: $54,320 (down + closing). Projections, not guarantees.
Landlord ↔ Tenant lean methodology
- Overall (STATE)
- 27 Tenant-Leaning
- State Maryland
- 27 Tenant-Leaning · D+14
- County
- — inherits STATE
- City
- — inherits STATE
ZIP-level market 21040
- Home prices YoY
- -29.4%
- Rents YoY
- 4.9%
- Active inventory
- 94
- Price-to-rent
- 8.9×
Monthly cashflow live
- Estimated rent
- $1,812 high interval (Pro) →
- Mortgage (P&I)
- −$1,017
- Tax from tax record
- −$84 /mo · $1,005/yr
- Insurance
- −$81
- HOA
- −$0
- Vacancy / Maint / Mgmt
- −$380
- Net cashflow
- $249
Break-even live
UW: 25.0% down · 7.5% · 30yr · 1.5% tax · 5.0% vac · 8.0% maint · 8.0% mgmt
Financing live
Cash to close
- Down payment
- $48,500
- Closing costs
- $5,820
- Reserves months
- —
- Total cash needed
- —
Loan-product check · same deal, 3 products live
Conventional
25% down · 7.5% · 30yr
- Down + closing
- —
- Monthly P&I
- —
- Monthly cashflow
- —
- DSCR
- —
- Eligible?
- —
Personal DTI + credit; lowest rate.
DSCR
20% down · 8.5% · 30yr
- Down + closing
- —
- Monthly P&I
- —
- Monthly cashflow
- —
- DSCR
- —
- Eligible?
- —
No personal income docs; deal must DSCR.
Hard money
10% down · 12.0% · 12mo
- Down + closing
- —
- Monthly P&I
- —
- Monthly cashflow
- —
- DSCR
- —
- Eligible?
- —
Short-term bridge; refi at stabilization.
Rent comps 16 comps
| Address | Beds | Baths | Sqft | Rent | $/sqft | DOM | Units | Dist |
|---|---|---|---|---|---|---|---|---|
| 962 Topview Dr Edgewood, MD | 3.0 | 1.5 | 1278 | $1,700 | $1.33 | 2d | 1 | 0.05mi |
| 1703 Fountain Rock Way Unit 1703-B Edgewood, MD | 2.0 | 1.0 | 882 | $1,250 | $1.42 | 23d | 1 | 0.12mi |
| 1772 Judy Way Edgewood, MD | 3.0 | 1.5 | 1040 | $2,195 | $2.11 | 43d | 1 | 0.24mi |
| 905 Swallow Crest Ct Unit E Edgewood, MD | 2.0 | 1.0 | 990 | $1,495 | $1.51 | 43d | 1 | 0.25mi |
| 807 Windstream Way Unit 807-C Edgewood, MD | 3.0 | 1.5 | 1260 | $1,800 | $1.43 | 2d | 1 | 0.25mi |
| 805 Windstream Way Unit 805B Edgewood, MD | 3.0 | 1.5 | 1260 | $1,450 | $1.15 | 21d | 1 | 0.25mi |
| 1857 Simons Ct Edgewood, MD | 3.0 | 1.5 | 1240 | $1,700 | $1.37 | 43d | 1 | 0.34mi |
| 802 Kingston Ct Edgewood, MD | 1.0–3.0 | 1.0–1.5 | 1007 | $1,883 | $1.87 | 1d | 15 | 0.37mi |
| 1501 Saint Christopher Ct Edgewood, MD | 4.0 | 2.0 | 1224 | $2,200 | $1.80 | 12d | 1 | 0.39mi |
| 807 W Spring Meadow Ct Edgewood, MD | 3.0 | 1.5 | 1400 | $1,850 | $1.32 | 43d | 1 | 0.42mi |
| 719 Woodbridge Center Way Edgewood, MD | 4.0 | 2.0 | 994 | $2,700 | $2.72 | 17d | 1 | 0.42mi |
| 700 Saint Peters Ct Edgewood, MD | 3.0 | 1.5 | 1524 | $1,100 | $0.72 | 17d | 1 | 0.42mi |
| 705 Bayberry Rd Edgewood, MD | 3.0 | 1.5 | 1657 | $2,600 | $1.57 | 17d | 1 | 0.63mi |
| 1523 Charlestown Dr Edgewood, MD | 3.0 | 1.5 | 1240 | $1,595 | $1.29 | 43d | 1 | 0.77mi |
| 2120 Cedar Dr Apt F Edgewood, MD | 3.0 | 1.5 | 1000 | $1,295 | $1.29 | 43d | 1 | 1.26mi |
| 2033 Armstrong St Edgewood, MD | 1.0–4.0 | 1.0–2.0 | 1000 | $1,766 | $1.77 | 1d | 6 | 1.40mi |
Listing history 27 events
-
2026-06-07statusdays on market $194,000 Pending 23 DOM
-
2026-06-04days on market $194,000 Active 22 DOM
-
2026-06-03days on market $194,000 Active 21 DOM
-
2026-06-02days on market $194,000 Active 20 DOM
-
2026-06-02price $194,000 Active 19 DOM
-
2026-06-01days on market $199,000 Active 19 DOM
-
2026-05-31days on market $199,000 Active 18 DOM
-
2026-05-13$199,000 Active
-
2018-06-26soldstatus $76,000
-
2018-05-23soldstatus $76,000 Closed 224-char remark
Show marketing remark (224 chars)
Come and get it! End unit town home in good condition, Wood floors, newer roof, gutters and water heater. Fenced rear yard with two storage sheds included. Needs cosmetic updates but otherwise move in ready. Priced to sell!
-
2018-05-23soldstatus $76,000 Sold 224-char remark
Show marketing remark (224 chars)
Come and get it! End unit town home in good condition, Wood floors, newer roof, gutters and water heater. Fenced rear yard with two storage sheds included. Needs cosmetic updates but otherwise move in ready. Priced to sell!
-
2018-04-23status Pending 224-char remark
Show marketing remark (224 chars)
Come and get it! End unit town home in good condition, Wood floors, newer roof, gutters and water heater. Fenced rear yard with two storage sheds included. Needs cosmetic updates but otherwise move in ready. Priced to sell!
-
2018-04-23status Contract 224-char remark
Show marketing remark (224 chars)
Come and get it! End unit town home in good condition, Wood floors, newer roof, gutters and water heater. Fenced rear yard with two storage sheds included. Needs cosmetic updates but otherwise move in ready. Priced to sell!
-
2018-04-16$75,000 Active 224-char remark
Show marketing remark (224 chars)
Come and get it! End unit town home in good condition, Wood floors, newer roof, gutters and water heater. Fenced rear yard with two storage sheds included. Needs cosmetic updates but otherwise move in ready. Priced to sell!
-
1999-05-05soldstatus $67,000
-
1999-04-29soldstatus $67,000
-
1999-04-01historical
-
1999-02-08$67,900
-
1998-10-29historical
-
1998-06-18
-
1998-06-11historical
-
1998-06-09
-
1998-05-28historical
-
1997-10-08
-
1994-02-15soldstatus $51,900
-
1986-10-22soldstatus $51,900
ⓘ Source: listings_history table (triggers on properties + properties_extension) + one-shot
backfill from property_details.listing_events for pre-trigger history.
Tax reassessment forecast MD · Partial reset (capped growth)
- Current annual tax
- $1,005 · $84/mo
- Projected year-2 tax
- $1,560 · $130/mo
- Expected delta
- +$555/yr (+$46/mo · 55.2%)
ⓘ Screening estimate from a state-policy table — verify with the county assessor before closing.
Climate risk First Street
- Flood 1/10 Low FEMA zone X (unshaded) · 0% chance over 30 yrs
- Wildfire 1/10 Low
- Heat 7/10 Severe 7 d/yr ≥104°F today · 15 d/yr by 30 yrs out
- Wind 6/10 Major 27% chance of damaging wind over 30 yrs
- Air quality 4/10 Moderate 4 unhealthy d/yr today · 6 by 30 yrs out
Nearby sold comps map
Loading sold comps map…
Walkable amenities ~0.75 mi
Loading nearby amenities…
Taxation est. · year 1
- Rental income
- $21,741
- − Mortgage interest
- −$10,867
- − Property taxes
- −$1,005
- − Insurance
- −$970
- − Repairs & maintenance
- −$1,739
- − Management
- −$1,739
- − Depreciation
- −$5,644
- Taxable loss
- −$223
- Est. tax savings @ 24.0%
- +$54
- After-tax cash flow
- $3,046/yr
For passive investors: Depreciation is non-cash, so a rental often shows a tax loss while cash-flowing — sheltering income. Rental losses are passive: they offset passive income freely, and up to $25,000/yr can offset ordinary (W-2) income if you actively participate and your MAGI is under $100k (phasing out to $0 by $150k); unused losses carry forward. On sale, claimed depreciation is recaptured at up to 25%, and gains may owe capital-gains tax (a 1031 exchange can defer both). Figures are a year-1 estimate at your 24.0% rate — not tax advice; consult a CPA.
Schools (NCES district)
- District
- Harford County Public Schools
- NCES district ID
- 2400390
- Math proficiency
- 22% ▼ -23.00%
- Reading proficiency
- 39% ▼ -12.00%
- Median HH income
- $79,569
- Composite
- 29.38/100
- National rank
- #6527
- State rank
- #9 of 24 in MD
Livability — Edgewood
- Score
- 73/100
- State rank
- #118
- US rank
- #4991
Category grades
Schools grade is shown separately in the Schools card above.
Census & demographics
- Census place
- Edgewood, MD
- County
- Harford County · 198,512 people
- City population
- 24,960
- Metro
- Baltimore-Columbia-Towson, MD
- Population (ZIP)
- 24,960
- Household income
- $81,704
- Rent vs Own
- Severe rent burden
- 859.0
Population outlook (Harford County) Hauer SSP2
- Today (2025)
- 262,292 people
- By 2030
- 266,437 · +1.6%
- By 2040
- 269,954 · +2.9%
- By 2050
- 265,659 · +1.3%
- By 2075
- 252,886 · -3.6%
- By 2100
- 224,014 · -14.6%
Race, ethnicity, and origin ACS 2023
- Neighborhood character
- Diverse neighborhood (Simpson 0.66)
- Race & ethnicity
- Black 45% White 36% Two or more races 11% Hispanic / Latino 10% Asian 2%
- Hispanic origin (detail)
- Mexican 1% Puerto Rican 2%
- Common ancestry
- Romanian 4% Slovak 1% Italian 1%
- Foreign-born
- 8% · Canada, South Korea
- Languages at home
- 89% English-only · Spanish 5% Russian/Polish/Slavic 2% German/W. Germanic 1%
Political lean MEDSL · Harford
- 2024 margin
- R (+13.8) · D 41.9% · R 55.7% · Other 2.4%
- 2008→2024 swing
- +5.0pp toward D · 2008: -18.8pp · 2024: -13.8pp
- All cycles
- 2024: R+13.8 2020: R+12.0 2016: R+24.5 2012: R+19.5 2008: R+18.8
Not yet ingested
- Civics
- —
Market trends
- HPI YoY
- ▼ -106.14%
- Current HPI
- 254.2305
- Rent YoY
- ▲ 4.92%
- Metro
- Baltimore-Columbia-Towson, MD
- State GDP YoY
- ▲ 2.97%
- F500 in state
- 12
Industry mix (Fortune 500 HQ in MD)
| Industry | F500 HQs | Revenue |
|---|---|---|
| Aerospace / Defense | 1 | $71B |
|
||
| Utilities | 1 | $25B |
|
||
| Hotels | 1 | $24B |
|
||
| Consumer Goods | 1 | $7B |
|
||
| Real Estate | 1 | $6B |
|
||
| Chemicals | 1 | $2B |
|
||
Price history
+283.4% since first listed20 events — show timeline
- 2026-05-13 Listed $199,000 BRIGHT MLS
- 2018-06-26 Sold (Public Records) $76,000 Public Records
- 2018-05-23 Sold (MLS) $76,000 MRIS
- 2018-05-23 Sold (MLS) $76,000 BRIGHT MLS
- 2018-04-23 Pending — BRIGHT MLS
- 2018-04-23 Pending — MRIS
- 2018-04-16 Listed $75,000 MRIS
- 2018-04-16 Listed $75,000 BRIGHT MLS
- 1999-05-05 Sold (Public Records) $67,000 Public Records
- 1999-04-29 Sold (MLS) $67,000 MRIS
- 1999-04-01 Delisted — MRIS
- 1999-02-08 Listed $67,900 MRIS
- 1998-10-29 Delisted — MRIS
- 1998-06-18 Listed — MRIS
- 1998-06-11 Delisted — MRIS
- 1998-06-09 Listed — MRIS
- 1998-05-28 Delisted — MRIS
- 1997-10-08 Listed — MRIS
- 1994-02-15 Sold (Public Records) $51,900 Public Records
- 1986-10-22 Sold (Public Records) $51,900 Public Records
Property tax history
-0.3%/yrLatest (2025): $1,005 · +7.2% YoY. Source: county tax records.
Cash-flow waterfall
monthlySold comps — $/sqft
last 12 mo · ≤1 miLoading sold comps…