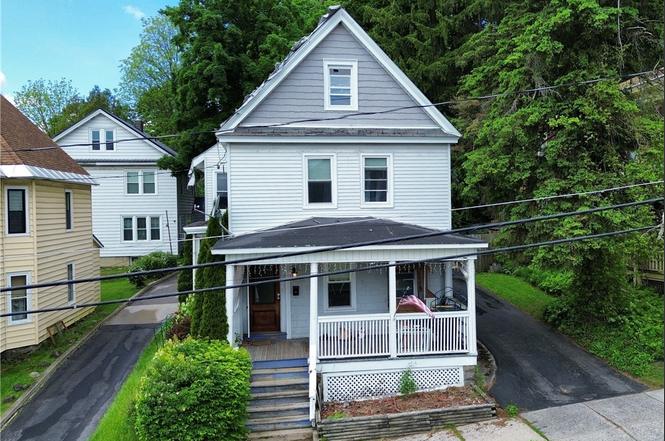
68 Alexander St · Little Falls, NY
Flood risk 1/10 · Minimal
- FEMA flood zone
- —
- Chance of flooding over 30 yrs
- 0.0%
- Est. flood insurance / yr
- —
Fire risk 1/10 · Minimal
- Est. fire insurance / yr
- $691 – $1,283
Heat risk 3/10 · Minor
- Hot days now (above 95°F)
- 7 days/yr
- Hot days in 30 yrs
- 17 days/yr
Wind risk 2/10 · Minimal
- Chance of severe wind over 30 yrs
- 1.0%
Air-quality risk 1/10 · Minimal
- Unhealthy air days now
- 0 days/yr
- Unhealthy air days in 30 yrs
- 0 days/yr
Risk factors via First Street. Map © Google.
Why this score? — see what drove the B+ grade
The composite is a weighted blend of 9 inputs, each scored 0–100. Each bar is that input's sub-score; the figure is the points it added to the 100-point composite (weight × sub-score).
- Cash flow +30.0/30.0
- 1% rule +10.0/10.0
- DSCR +10.0/10.0
- Appreciation +10.0/10.0
- ARV discount +7.5/15.0
- Schools +3.6/10.0
- Livability +3.5/5.0
- Rent growth +2.5/5.0
- Condition / age +2.5/5.0
$49,900
🖨 Deal sheet (PDF) 📄 Offer letter ✓ Due diligence
Listing remarks
Welcome to 68 Alexander Street in Little Falls — an opportunity packed with potential for investors, renovators, or buyers looking to build equity. This spacious 4-bedroom, 1-bath home offers approximately 1,840 square feet of living space and sits in a convenient city location close to schools, parks, shopping, restaurants, and major commuter routes. Built in 1934, this classic two-story home retains much of its original character, featuring generous room sizes, hardwood flooring, tall ceilings, and a traditional layout ready for your vision and updates. The covered front porch provides a welcoming entrance and a great place to relax, while the interior offers ample space to redesign
Key facts
- Covered front porch
- Hardwood flooring
- Manageable yard
Tags
Property features AI
Exterior
- Parking: No garage
- Utilities: Public water (connected); Sewer connected
- Home design: 2-story existing home
- Construction: Vinyl siding; Stone foundation
- Exterior features: Blacktop driveway; Rectangular residential lot, 35 x 85
Interior
- Kitchen: Free‑standing range; Oven
- Bedrooms: Total of 6 rooms (includes living areas and bedrooms)
- Flooring: Hardwood; Varied flooring
- Bathrooms: 1 full bathroom (main level)
- Heating & cooling: Gas forced-air heating
- Interior features: Eat-in kitchen; Separate/formal living room; Full basement
- Laundry & utility: Electric water heater
Neighborhood map
What this means for you Summary
Snapshot
- This is a 4-bed/1.0-bath single-family listed at $50k.
Deal economics
- At list price, monthly cash flow is $581 ($7k/yr) — positive.
- The deal already cash-flows at list — no discount required.
- Meets the 1% rule at list price ($1k rent vs $50k).
- Cap rate 20.3% vs local median 8.0% in Little Falls — top-decile yield for the area; either an underpriced asset or a hidden risk that comps aren't pricing in. Stress-test before assuming the spread holds.
Location & tenants
- Location reads 70/100 on livability (#440 in NY) — a middle-class / working-renter tenant base. Strengths: crime A+, cost of living A+, health & safety A+; Watch: schools C-, amenities F, commute F.
- Little Falls City School District (rural): math 37% / reading 49% proficiency, ranked #492 of 590 in NY (top 83%) — families likely to look elsewhere, expect single-tenant / working-renter base with shorter leases.
- Market conditions: 66 active listings in the ZIP; 54 units permitted in Herkimer County in 2024 (0 in 5+ unit buildings).
Forward outlook
- In year one you build about $5k of equity ($345 loan paydown + $5k appreciation (10.0% local appreciation)).
- Herkimer County population projected at -24% by 2050 — secular population decline; favor cash flow + early exit over multi-decade hold.
- At projected returns (10.0% appreciation + 3.0% rent growth), your $14k cash investment doubles in ~2 years — after that, you're playing with house money.
- By year 6, paydown + projected appreciation supports a ~$31k cash-out refi (75% LTV) — recoverable capital for the next deal without selling this one.
Negotiation context
- Only 8 days on market — expect competitive offers; lowballing is unlikely to land.
- 2 sale attempts since 11y ago with the ask held roughly flat each time — persistent listings suggest the price (not the market) is what's stuck; bring a comps-based counter.
Risks & watch-outs
- Watch-outs: property tax is 4.7% of price; built in 1934 — expect roof / HVAC / electrical / plumbing capex.
Questions for the listing agent
- Built in 1934 — when were the roof, HVAC, electrical panel, plumbing, and water heater last replaced?
- Property tax is high relative to price — has the assessment been appealed recently, and will the sale trigger a re-assessment?
- Is there a deadline driving the sale (1031 exchange, divorce, estate, relocation)? That informs how much negotiation room exists.
- What's the average days-on-market for RENTAL listings here right now (not sales)? A rising rental-DOM trend means longer vacancies and softer asking-rent achievability than the comps imply.
- What's the recent tenant-quality profile in this submarket — average credit score on applications, eviction rate, late-payment / NSF rate, and stable-employment percentage? A property-management company in the area should have these aggregated.
- How much new for-sale + rental construction is in the pipeline within 1–3 miles? Heavy new supply typically softens prices + rents 12–24 months out; constrained supply supports both.
Investment metrics
- 1% rule
- 2.68% ✓
- Cap rate
- 20.26%
- Cash-on-cash
- 49.89%
- DSCR
- 3.22
- GRM
- 3.1
CMA / ARV
- ARV (on-the-fly)
- $130,640
- Comps found
- 10
Show comp detail 10 sales within ~0.75 mi
| Address | Dist | Beds/Ba | Sqft | Sold | Price | $/sf | Match |
|---|---|---|---|---|---|---|---|
| 62 Salisbury St | 0.14mi | 4/1.0 | 1,651 (-10%) | 1mo | $37,500 | $23 | 75 |
| 628 E Gansevoort St | 0.17mi | 4/1.5 | 1,812 (-2%) | 15mo | $172,000 | $95 | 75 |
| 778 E Main St | 0.20mi | 4/2.0 | 1,936 (+5%) | 5mo | $40,000 | $21 | 74 |
| 345 S William St | 0.33mi | 3/1.0 (-1) | 1,757 (-4%) | 14mo | $52,000 | $30 | 61 |
| 598 E Monroe St | 0.25mi | 5/1.5 (+1) | 2,066 (+12%) | 8mo | $110,000 | $53 | 54 |
| 176 Loomis St | 0.33mi | 3/1.5 (-1) | 1,726 (-6%) | 22mo | $118,540 | $69 | 49 |
| 102 W Monroe St | 0.72mi | 3/1.5 (-1) | 1,760 (-4%) | 4mo | $125,000 | $71 | 49 |
| 790 E Monroe St | 0.68mi | 3/2.5 (-1) | 1,936 (+5%) | 2mo | $277,000 | $143 | 47 |
| 97 W Gansevoort St | 0.67mi | 4/1.5 | 1,976 (+7%) | 9mo | $192,000 | $97 | 47 |
| 556 E Monroe St | 0.36mi | 4/2.0 | 2,074 (+13%) | 18mo | $175,000 | $84 | 43 |
Match score weights: distance 35% · size 25% · config 20% · recency 20%. Top-matched comps best support the ARV.
Projected returns pro-forma
10.0% appreciation · 3.0% rent growth · sell at horizon
- IRR
- 63.6%
- Equity multiple
- 5.60×
- Total profit
- $64,278
- Equity at exit
- $44,954
- IRR
- 57.2%
- Equity multiple
- 12.48×
- Total profit
- $160,391
- Equity at exit
- $96,945
Cash invested: $13,972 (down + closing). Projections, not guarantees.
Landlord ↔ Tenant lean methodology
- Overall (STATE)
- 15 Strongly Tenant-Friendly
- State New York
- 15 Strongly Tenant-Friendly · D+10
- County
- — inherits STATE
- City
- — inherits STATE
ZIP-level market 13365
- Home prices YoY
- 9.9%
- Active inventory
- 66
- Price-to-rent
- 3.1×
Monthly cashflow live
- Estimated rent
- $1,338 medium interval (Pro) →
- Mortgage (P&I)
- −$262
- Tax from tax record
- −$193 /mo · $2,322/yr
- Insurance
- −$21
- HOA
- −$0
- Vacancy / Maint / Mgmt
- −$281
- Net cashflow
- $581
Break-even live
Sensitivity live
| Price | -10% $747 | -5% $595 | +0% $581 | +5% $567 | +10% $553 |
|---|---|---|---|---|---|
| Rent | -10% $475 | -5% $528 | +0% $581 | +5% $634 | +10% $687 |
| Rate | -1.0pp $606 | -0.5pp $594 | base $581 | +0.5pp $568 | +1.0pp $555 |
UW: 25.0% down · 7.5% · 30yr · 1.5% tax · 5.0% vac · 8.0% maint · 8.0% mgmt
Financing live
Cash to close
- Down payment
- $12,475
- Closing costs
- $1,497
- Reserves months
- —
- Total cash needed
- —
Loan-product check · same deal, 3 products live
Conventional
25% down · 7.5% · 30yr
- Down + closing
- —
- Monthly P&I
- —
- Monthly cashflow
- —
- DSCR
- —
- Eligible?
- —
Personal DTI + credit; lowest rate.
DSCR
20% down · 8.5% · 30yr
- Down + closing
- —
- Monthly P&I
- —
- Monthly cashflow
- —
- DSCR
- —
- Eligible?
- —
No personal income docs; deal must DSCR.
Hard money
10% down · 12.0% · 12mo
- Down + closing
- —
- Monthly P&I
- —
- Monthly cashflow
- —
- DSCR
- —
- Eligible?
- —
Short-term bridge; refi at stabilization.
Listing history 7 events
-
2026-06-12statusdays on market $49,900 Pending 8 DOM
-
2026-06-09days on market $49,900 Active 7 DOM
-
2026-06-08days on market $49,900 Active 6 DOM
-
2026-06-07days on market $49,900 Active 5 DOM
-
2026-06-07days on market $49,900 Active 4 DOM
-
2026-06-03remarks 693-char remark
-
2026-06-03$49,900 Active 1 DOM
ⓘ Source: listings_history table (triggers on properties + properties_extension) + one-shot
backfill from property_details.listing_events for pre-trigger history.
Tax reassessment forecast NY · Partial reset (capped growth)
- Current annual tax
- $2,322 · $193/mo
- Projected year-2 tax
- $2,322 · $193/mo
- Expected delta
- $0/yr ($0/mo · 0.0%)
ⓘ Screening estimate from a state-policy table — verify with the county assessor before closing.
Climate risk First Street
- Flood 1/10 Low 0% chance over 30 yrs
- Wildfire 1/10 Low
- Heat 3/10 Moderate 7 d/yr ≥95°F today · 17 d/yr by 30 yrs out
- Wind 2/10 Low 100% chance of damaging wind over 30 yrs
- Air quality 1/10 Low 0 unhealthy d/yr today · 0 by 30 yrs out
Nearby sold comps map
Loading sold comps map…
Walkable amenities ~0.75 mi
Loading nearby amenities…
Taxation est. · year 1
- Rental income
- $16,054
- − Mortgage interest
- −$2,795
- − Property taxes
- −$2,322
- − Insurance
- −$250
- − Repairs & maintenance
- −$1,284
- − Management
- −$1,284
- − Depreciation
- −$1,452
- Taxable income
- $6,667
- Est. tax owed @ 24.0%
- −$1,600
- After-tax cash flow
- $5,371/yr
For passive investors: Depreciation is non-cash, so a rental often shows a tax loss while cash-flowing — sheltering income. Rental losses are passive: they offset passive income freely, and up to $25,000/yr can offset ordinary (W-2) income if you actively participate and your MAGI is under $100k (phasing out to $0 by $150k); unused losses carry forward. On sale, claimed depreciation is recaptured at up to 25%, and gains may owe capital-gains tax (a 1031 exchange can defer both). Figures are a year-1 estimate at your 24.0% rate — not tax advice; consult a CPA.
Schools (NCES district)
- District
- Little Falls City School District
- NCES district ID
- 3617460
- Math proficiency
- 37% ▼ -10.00%
- Reading proficiency
- 49% ▲ 7.00%
- Median HH income
- $42,445
- Composite
- 36.22/100
- National rank
- #4724
- State rank
- #492 of 590 in NY
Livability — Little Falls
- Score
- 70/100
- State rank
- #440
- US rank
- #7681
Category grades
Schools grade is shown separately in the Schools card above.
Census & demographics
- Census place
- Little Falls, NY
- Population (ZIP)
- 8,545
Population outlook (Herkimer County) Hauer SSP2
- Today (2025)
- 59,340 people
- By 2030
- 56,838 · -4.2%
- By 2040
- 51,098 · -13.9%
- By 2050
- 45,080 · -24.0%
- By 2075
- 32,648 · -45.0%
- By 2100
- 22,266 · -62.5%
Race, ethnicity, and origin ACS 2023
- Neighborhood character
- Predominantly White (92%)
- Race & ethnicity
- White 92% Hispanic / Latino 5% Two or more races 4%
- Hispanic origin (detail)
- Puerto Rican 4%
- Common ancestry
- Romanian 8% Lithuanian 3% Polish 2%
- Foreign-born
- 1%
- Languages at home
- 95% English-only · German/W. Germanic 3% Spanish 2% Other Indo-European 1%
Political lean MEDSL · Herkimer
- 2024 margin
- Solid R (+36.4) · D 31.8% · R 68.2%
- 2008→2024 swing
- -27.1pp toward R · 2008: -9.3pp · 2024: -36.4pp
- All cycles
- 2024: R+36.4 2020: R+30.5 2016: R+34.5 2012: R+8.4 2008: R+9.3
Not yet ingested
- Civics
- —
Market trends
- HPI YoY
- ▲ 27.04%
- Current HPI
- 300.9696
- Rent YoY
- —
- Metro
- —
- State GDP YoY
- ▲ 2.60%
- F500 in state
- 92
Industry mix (Fortune 500 HQ in NY)
| Industry | F500 HQs | Revenue |
|---|---|---|
| Financial Services | 10 | $950B |
|
||
| Consumer Goods | 9 | $162B |
|
||
| Insurance | 4 | $225B |
|
||
| Telecommunications | 2 | $144B |
|
||
| Pharmaceuticals | 2 | $112B |
|
||
| Media / Entertainment | 2 | $69B |
|
||
Price history
+9.7% since first listed4 events — show timeline
- 2026-06-02 Listed $49,900 CNYIS
- 2016-01-29 Listing Removed — CNYIS
- 2015-07-29 Listed $59,900 CNYIS
- 1995-04-20 Sold (Public Records) $45,500 Public Records
Property tax history
+6.6%/yrLatest (2025): $2,322 · +2.0% YoY. Source: county tax records.
Cash-flow waterfall
monthlySold comps — $/sqft
last 12 mo · ≤1 miLoading sold comps…